Extraction with 5-Chlorosalicylaldehyde Thiosemicarbazone of Cu(II) in n-Butyl Acetate and its Spectrophotometric Study
Priyanka Melwin Rodrigues1* and Sunetra Rajendra Chaudhary1
Department of chemistry, Kishinchand Chellaram College, Mumbai, India.
Corresponding Author E-mail: priyankapereira7@gmail.com
DOI : http://dx.doi.org/10.13005/ojc/400210
Download this article as:
![]()
The highly reactive 5-Chlorosalicylaldehyde thiosemicarbazone (CSTSC) has been employed as an extractive reagent to create a simple and precise spectrophotometric technique for detecting Cu(II) spontaneously. The complex of 5-Chlorosalicylaldehyde thiosemicarbazone and Cu(II) has been quantitatively extracted in n-butyl acetate in the pH range of 5.4–6.4 after equilibrating for 60 sec. Up to 5.0 μg mL-1 concentration of Cu(II), the complex of 5-Chlorosalicylaldehyde thiosemicarbazone with Cu(II) in n-butyl acetate follows Beer’s law, with its maximum absorbance occurring at 380 nm. By employing the Jobs continuous variation method, the composition 1:1 has been determined for the Cu(II)-CSTSC complex, and this finding is further supported by the mole ratio method. The extracted complex remained stable for 72 hours. 5.48 x 10⁻³ μg cm-2 was determined to be Sandell's sensitivity, whereas 1.16 x 10⁴ L mol-1 cm-1 was the molar absorptivity. Commercial and synthetic samples have been effectively analysed using this method.
KEYWORDS:Analysis; n-Butyl acetate; Copper; CSTSC; Extraction; Pharmaceutical samples
Introduction
Copper metal plays an important role in biological systems, apart from its industrial application. Copper is the third most essential element after zinc and iron in the human body. It plays a significant role in haemoglobin synthesis, oxidative phosphorylation, and various biochemical reactions1. Diseases like low immune function and anaemia can be caused by a shortage of copper, whereas excessive amounts of copper develop gastrointestinal symptoms like abdominal pain, vomiting, and nausea2. They also affect aquatic life. Various analytical techniques, like atomic absorption spectrometry3-6, spectrophotometry7-9, voltammetry10-13, ICP-AES14-16, ICP-MS17-18 have been used for the determination of copper. In chemistry, solvent extraction is a growingly significant separation method. Due to its ease of usage, quickness, and versatility, it has emerged as one of the most promising techniques for separating metal ions at the trace level. The extractive spectrophotometric study of copper has been reported with several reagents like hydrazone19-20, thiosemicarbazone21-24, oxime25, imines26-28 and thiourea29. Thiosemicarbazones are a class of molecules that possess well-established pharmacological and medicinal qualities, such as antiparasitic, antiviral, antifungal, antitumor, and antimicrobial actions. Thiosemicarbazone compounds have been extensively used in extraction because of their strong reactivity towards metal ions and extremely stable coloured complexes. The current study focuses on spectrophotometric analysis of copper (II) with 5-chlorosalicylaldehyde thiosemicarbazone as a reagent. For the study of copper, this method offers an extremely reliable and sensitive approach.
Materials and methods
Instruments and Chemicals
A quartz cell of 1.0 cm has been used for absorbance studies on the Jasco V-730 UV-VIS spectrophotometer. pH was adjusted with Equiptronics pH meter. Weighing was done using an electronic Contech balance (CA 64). All chemicals were of AR grade, obtained from commercial suppliers. All of the trials used freshly made, doubly distilled water. Hydrochloric acid and water that was double-distilled were utilised to dissolve Copper (II) chloride and create a 1000 ppm copper solution. Iodometry was used to standardise the solution30. To get a functional solution, portions were diluted every day. The proper amount of 0.2 M NaOH was mixed with 0.2 M KHP to create a buffer solution with a pH of 5.4–6.4.
Solutions of foreign ions
Anions were dissolved in distilled water whereas metal salts were dissolved in appropriate acids, then water was added to a known volume to create stock solutions of various metal ions and anions.
Synthesis of 5-Chlorosalicylaldehyde thiosemicarbazone
Equimolar amounts of each 5-Chlorosalicylaldehyde (1.567 g) in 25 mL of ethanol were condensed with an aqueous ethanolic solution of thiosemicarbazide (0.911 g) by refluxing the reaction mixture in a water bath for five hours. Precipitate was produced by pouring the mixture into crushed ice. After being filtered out and repeatedly cleaned with water, it was recrystallized from ethanol and then dried. 0.1% reagent solution was prepared by using a recrystallized product.
Procedure
Cu(II) solution containing 2.5–50 µg mL-1 concentration, 1.0 mL of 0.1% (4.35 x 10⁻³ mole/dm3) reagent in methanol, and phthalate buffer (pH 6.0) 4.0 mL were combined in a 10 mL volumetric flask. After adding distilled water to make the final volume 10 mL, the mixture was transferred into a separating funnel. The equilibration of the mixture was carried out with 10 ml of n- butyl acetate. Both the organic and aqueous layers were separated when equilibrium was achieved. Sodium sulphate in anhydrous form was used to dry the organic phase. Next, using a 1.0 cm-matched cell at a wavelength of 380nm, the absorbance of the solution was determined in comparison to a reagent blank.
Result and discussion
Absorption spectra
The greenish complex forms after mixing Copper(II) with 5-Chlorosalicylaldehyde thiosemicarbazone. This complex can be quantitatively extracted into n-butyl acetate in the pH range 5.4-6.4. The complex Cu(II)-CSTSC absorption spectra, when measured in n-butyl acetate between 300nm–500nm and at 380nm, exhibit absorption maxima(Fig.1 Curve A). Because of the reagent’s insignificant absorbance at the complex’s λmax, the reagent has no impact on the copper determination process (Fig.1 Curve B). Therefore, for all of the Cu(II)-CSTSC complex absorbance measurements, a 380 nm wavelength was selected.
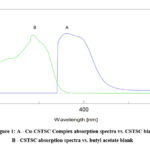 |
Figure 1: A – Cu(ll)-CSTSC Complex absorption spectra vs. CSTSC blank. B – CSTSC absorption spectra vs. n-butyl acetate blank |
pH Study
The extractions have been performed in n-butyl acetate at different pH to find out the influence of pH on colour development, maximum complexation, and the Cu(II)-CSTSC complex’s quantitative extraction. Buffer solutions of pH 1–10 were prepared in series. In the presence of these pH the colour development and subsequent extraction of the Cu(II)-CSTSC complex in n-butyl acetate were carried out as per the above procedure. It was observed that maximum extraction of Cu(II) ions takes place between pH 5.4-6.4 as the organic phase shows maximum absorbance. No absorbance was observed by the diethyldithiocarbamate method in the aqueous phase after decomposition, which indicates the absence of the Cu(II) ion. Therefore, an optimum pH range of 6.0 was maintained for extraction.
Effect of Solvent
Different organic solvents were used to study the influence of solvents on the Cu(II)-CSTSC complex extraction and absorbance.The solvents exhibit varying percentages of copper (II) ion extraction as Cu(II)-CSTSC complex: n-butyl acetate (99.9%), n-butanol (95.0%), ethyl acetate (85.0%), isoamyl alcohol (80.0%), cyclohexanone (40.0%), toluene (14.9%), benzene (10.00%), chloroform (10.00%), carbon tetrachloride (5.00%), xylene (5.0%), and hexane (2.5%). The Cu(II)-CSTSC complex can be easily extracted in an oxygenated solvent. Since the miscibility of n-butyl acetate with water is less; all extractions were carried out in n-butyl acetate.
Effect of reagent concentration
The reagent concentration required for maximum colour development and quantitative extraction is determined by adding 0.1 mL to 1.5 mL of 0.1% reagent concentration (4.35 x 10⁻³ M) in 30 µg of copper (II) solution. A four-fold excess concentration was required for maximum colour development, and adding excess reagent concentration did not affect the absorbance of the solution. Hence, 1.0 mL of reagent concentration was added to all further studies. The impact of concentration of reagent on Cu(II)-CSTSC Complex absorbance is shown in Fig.2.
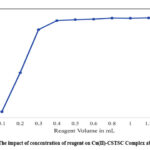 |
Figure 2: The impact of concentration of reagent on Cu(II)-CSTSC Complex absorbance. |
Equilibration time and Stability of colour
The Cu(II)-CSTSC complex can be extracted completely by equilibrating for 60 sec. The extracted complex remained stable for 72 hours.
Beer’s range and sensitivity
Cu(II) at 380 nm between the concentration range that varies from 0.25-5.0 µg mL-1 obeys Beer’s law( Fig.3). 5.48 x 10⁻³ μg cm-2 was determined to be Sandell’s sensitivity, and 1.16 x 10⁴ L mol-1 cm-1 was the molar absorptivity.
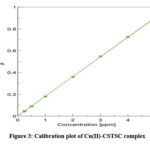 |
Figure 3: Calibration plot of Cu(II)-CSTSC complex. |
Influence of salting out agents on the absorbance
Ammonium sulphate, calcium chloride, magnesium sulphate, sodium chloride, and potassium carbonate were added as salting out agents to increase the extraction of metal complex in n-butyl acetate. It was observed that the absorbance of the solution remains the same after adding a salting out agent.
Composition determination of the Cu(II)-CSTSC complex
By employing the Jobs continuous variation method, the complex composition has been determined, and this finding is further supported by the mole ratio method. Copper (II) and CSTSC solutions were prepared in equimolar concentrations (4.35 x 10⁻⁴M). The varying proportions of metal and reagents were mixed by keeping the total volume fixed at 2.0 ml. The composition 1:1 of Cu(II)-CSTSC complex was formed, as shown by the plot (Fig.4) of absorbance at 380 nm against the mole fraction of metal. Fig.5 illustrates the mole ratio method.
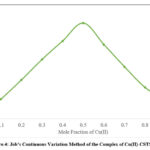 |
Figure.4: Job’s Continuous Variation Method of the Complex of Cu(II)-CSTSC |
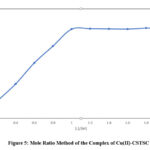 |
Figure 5: Mole Ratio Method of the Complex of Cu(II)-CSTSC. |
Impact of foreign ions
Cu(II)-CSTSC absorbance was investigated with 30.0 μg of copper(II) and different concentrations for every foreign ion to determine the impact of interfering ions. The absorbance value’s tolerance limit was set at an error of ±2%.
For the various ions under investigation, the tolerance limits were as follows (Table 1):
F–, Cl–, Br–, I–, SO42-, SO32-, ClO3–, BrO3–, IO3– , SCN–, acetate, tartarate, urea, thiourea (20000µg each), NO2–, NO3– (10000µg each), S2O32-, S2O82- (5000µg each), Ca(II), Mg(II), W(VI), Cr(III), Zn(II) (2000µg each), Al(III), Pb(II), Sn(II), La(III), Sr(II) (1000µg each), U(VI), Th(III), Cd(II), (500µg each), V(V), Ce(IV), Bi(II) (200 µg each), and Fe(III) (75 µg). Severe interference of Co(II), Hg(II) Pd(II), Ag(I) and EDTA was observed at all concentration levels, and interference of EDTA, Hg(II) Co(II), Pd(II) and Ag(I) can be removed by using a suitable masking agent.
Table 1: Impact of foreign ions on extraction of Cu(II)-CSTSC complex
|
Interfering ions |
Tolerated amount in µg |
Interfering ions |
Tolerated amount in µg |
Interfering ions |
Tolerated amount in µg |
|
F– |
40000 |
SCN– |
10000 |
Sn2+ |
1000 |
|
Cl– |
40000 |
NO2– |
10000 |
La3+ |
1000 |
|
Br– |
40000 |
NO3– |
10000 |
Al3+ |
1000 |
|
I– |
40000 |
S2O32- |
5000 |
U6+ |
500 |
|
ClO3– |
20000 |
S2O82- |
5000 |
Th3+ |
500 |
|
BrO3– |
20000 |
EDTA |
Masked |
Cd2+ |
500 |
|
IO3– |
20000 |
Ca2+ |
2000 |
V5+ |
200 |
|
SO42- |
20000 |
Mg2+ |
2000 |
Ce4+ |
200 |
|
SO32- |
20000 |
W6+ |
2000 |
Bi2+ |
200 |
|
P2O72- |
20000 |
Cr3+ |
2000 |
Fe3+ |
75 |
|
Acetate |
20000 |
Mn2+ |
2000 |
Hg2+ |
Masked |
|
Tartarate |
20000 |
Zn2+ |
1000 |
Co2+ |
Masked |
|
Urea |
20000 |
Sr2+ |
1000 |
Ag+ |
Masked |
|
Thiourea |
20000 |
Pb2+ |
1000 |
Pd2+ |
Masked |
Precision and accuracy
Ten different 30 µg copper containing solutions absorbance were measured in order to determine accuracy and reproducibility. The standard deviation and these ten readings average was computed. It was discovered that the standard deviation was 0.017. The reproducibility of results with a 95% confidence level, based on the standard deviation, was 2.999 ± 0.010.
Applications
Pharmaceutical samples, alloys, and synthetic mixtures are all tested for copper content using the current method.
Determination of copper ion concentration in synthetic mixture
Using the suggested method, copper ions were determined from a number of synthetic mixtures with different copper (II) and other metal ion compositions. Table 2 presents the findings.
Table 2: Copper (II) content analysis in a synthetic mixture
|
Composition of mixtures in µg |
Amount present in µg |
Found by present method in µg |
|
Cu (40), Cd (100), Zn (100) |
40.0 |
39.9 |
|
Cu (40), Pb (50), Mn (100) |
40.0 |
39.85 |
|
Cu (40), Fe (50), Cr (100) |
40.0 |
39.7 |
|
Cu (40), Th (100), Zn (50) |
40.0 |
39.8 |
Detection of Cu(II) ions in alloy materials
The copper content of alloys such as Brass and Devarda’s alloys was measured using the proposed technique. 0.1 g of the alloy samples were dissolved in 10 mL of aqua regia after being dried in an oven. Following almost complete drying, 5 mL of dil. HCl was added, and then, up to 100 mL the solution was diluted using double-distilled water. The suggested method was then followed to test the right quantities of these solutions for copper (II). Table 3 displays the findings.
Detection of copper levels in drug samples
10 mL of aqua regia were used for each pharmaceutical sample, and the samples were heated until almost dry. After applying HClO4 to the organic matter to break it down, 10 mL of 2N HNO3 were used to extract the residue. After filtering, distilled water was added to the solution to dilute it to the desired volume. The suggested method was used to analyse suitable aliquots for copper (II). Table 3 represents the outcomes of analysis.
Table 3: Detection of Cu(II) in drugs and alloys samples (n = 4 average of four determination).
|
Sample |
Amount present |
Amount found |
|
Keraboost |
3.0 mg/tablet |
2.98 mg/tablet |
|
Antoxid-HC |
1.0 mg/tablet |
0.97 mg/tablet |
|
Brass alloy |
67.9% |
67.7% |
|
Devardas Alloy |
48.2% |
48.1% |
Conclusion
This method provides high sensitivity and selectivity for spectrophotometric detection of Cu(II) in microgram amounts. The extraction was not affected in presence several anions and cations. The amount of Cu(II) can be measured very quickly from alloys and pharmaceutical samples, as the method is simple and rapid.
Acknowledgment
This research did not receive any specific grant from funding agencies in the public, commercial, or not-for-profit sectors.
Conflict of Interest
The authors declare no competing financial interest.
References
- Sailer, H.G.; Sigel A.; Sigel, H.; , Marcel Dekker, New York, Handbook on metals in clinical and analytical chemistry, 1994.
- Scheiber, I; Dringen, R.; Mercer, JF., Met Ions Life Sci., 2013;13,359-87.
CrossRef - Hosseini, Mehdi; Dalali, Nasser; Mohammad nejad, Saeid; International Journal of Industrial Chemistry, 2012, 3, 7.
- Yang, Qiang ; Tang, Guang Ping; Tian, Lun Fu; Wei, Qi Long; Wang, Chao; Advanced Materials Research, 2015, 1120-1121,1395-1398.
CrossRef - Han, Quan ; Yang, Xiaohui; Huo, Yanyan; Lu, Jiale; Liu, Yaqi; Separations, 2023, 10(2), 93.
CrossRef - Soylak, Mustafa; Unsal, Yunus Emre; Kizil, Nebiye; Aydin, Ayse; Food and Chemical Toxicology,2010, 48, 517-521.
CrossRef - Babayeva, Könül; Demir, Serkan; Andac, Müberra; Journal of Taibah University for Science, 2017, 11, 808-814.
CrossRef - Alharthi, Salman. S.; Al-Saidi, Hamed. M.; Appl. Sci., 2020, 10(11), 3895.
CrossRef - Dorehgiraee, Ali; Pourabdollah, Elham; Ghanei-Motlagh, Masoud; J. Chil. Chem. Soc., 2018, 63, 4.
CrossRef - Squissato, André L.; Richter, Eduardo M.; Munoz, Rodrigo A.A.; Talanta, 2019, 201, 433-440.
CrossRef - Suyanta, Suyanta; Sunarto, Sunarto; Padmaningrum, Regina Tutik; Karlinda, Karlinda; Illyas, Md. Isa; Rahadian, Rahadian; Indones. J. Chem., 2021, 21(2), 332 – 339
CrossRef - Georgieva; Todorov, Petar, Artem; Bezfamilnyi; Journal of Chemical Technology and Metallurgy,2021, 56(5), 999-1007.
- Hassan, Khalid M.; Elhaddad, Ghada M.; Azzem, Magdi Abdel; Microchimica Acta, 2019, 186, 440.
CrossRef - Paktsevanidou, Ioanna P.; Manousi, N.; Zachariadis, G. A.; Analytical Letters, 2021,54(13), 2227-2238.
- Manousi, Natalia; Zachariadis, George A.; Separations, 2020, 7(4), 66.
CrossRef - Hussain, Adil; Sajid, Muhammad; Potter, Daniel; Rasheed, Hassam; Hassan, Mujtaba; Akhtar, Naeem; Ahmad, Bashir; Bokhari, Syed Ali Imran; Biological Trace Element Research,2023, 201, 4143–4155.
CrossRef - Mohd-Taufek, Nor; Cartwright, David; Davies, Mark; Hewavitharana, Amitha K.; Koorts, Pieter; Shaw, Paul N.; Sumner, Ronald; Lee, Eugene; Whitfield, Karen; Food Analytical Methods, 2016,9, 2068–2075.
CrossRef - Cao, Yupin; Feng, Jinsu; Tang, Lifu; Yu, Chunhe; Mo, Guichun; Deng, Biyang; Talanta, 2020,206,120174.
CrossRef - D., Rekha; K., Suvardhan; K., Suresh Kumar; P., Reddy,Prasad; B., Jayaraj; P., Chiranjeevi; J. Serb. Chem. Soc., 2007,72 (3), 299–310.
CrossRef - Aswar, A. S.; Joshi, M.D.; Indian Journal of Chemical Technology, 2008, 15, 79-81.
- Reddy, B. K.; Kumar, J. R.; Reddy, K. J.; Sarma, L. S.; Reddy, A. V.; Analytical Sciences, 2003, 19, 423–428.
CrossRef - Reddy, K. Janardhan; Kumar, J. Rajesh; Narayana, S. Lakshmi; Ramachandraiah, C.; Thriveni, T.; A. Reddy, Varada; Environ Monit Assess, 2007,124, 309–320.
CrossRef - Madan, Parinita Umesh; Barhate, Vasant Dnyandeo; European Journal of Biomedical and Pharmaceutical Sciences,2016, 3(4), 392-396.
- Reddy, Nagarjuna; Reddy, Vasudeva; Momona Ethiopian Journal of Science, 2012, 4(2), 70-83.
CrossRef - Sreedhar, N. Y.; Jyothi, Y.; Indian Chem. Soc., 2005, 82, 1038-1040.
- Shinde,D. R., Chaskar, M. G.; Tambade, P. S.; International Conference on Frontiers in Life and Earth Science,2018, 5(1), 38-41.
- Gupta, AnandKumar S.; Barhate, V. D.; J. Chem. Pharm. Res., 2011, 3(6),159-165.
- Patil, Jayashree S.; International Journal of Advanced Research in Science, Communication and Technology, 2022, 2,3.
- Kuchekar, Shashikant R.; Pulatea, Shivaji D.; Aherb, Haribhau R.; Gaikwadc, Vishvas B.; Hand,Sung H.; Eurasian Chemical Communications, 2019, 1,212-222.
- Vogel, A.I; Longman, Green, London, Vogel’s textbook of quantitative chemical analysis,1961.
Second Review by: Dr. Luz Alejandra Arancibia
Final Approval by: Dr. MGH Zaidi


![]()


