Sequent Adsorption of Phosphate Ions by Copper Ions Adsorbed on Tripolyphosphate Chitosan
Thai Anh Nguyen1,2 , Huu Trung Bui3, Vu Bich Hanh Dang1,2, Thi Bich Huyen Trinh1,2, Thi Huynh Tram Le1,2 and Vinh Tien Nguyen3*
1Vietnam National University Ho Chi Minh City, Linh Trung Ward, Thu Duc City, Ho Chi Minh City, Vietnam.
2Faculty of Environment and Natural Resources, Ho Chi Minh City University of Technology (HCMUT), 268 Ly Thuong Kiet St., Dist. 10, Ho Chi Minh City, Vietnam.
3Faculty of Chemical and Food Technology, Ho Chi Minh City University of Technology and Education, 01 Vo Van Ngan Street, Thu Duc City, Ho Chi Minh City, Vietnam.
Corresponding Author E-mail: tiennv@hcmute.edu.vn
DOI : http://dx.doi.org/10.13005/ojc/390209
Article Received on : 25 Feb 2023
Article Accepted on : 26 Mar 2023
Article Published : 04 Apr 2023
Reviewed by: Dr. Hatice Karaer Vağmur
Second Review by: Dr. Ajay Tiwari
Final Approval by: Dr. Vandana Magarde
In this study, we successfully crosslinked chitosan using STPP and produced chitosan beads to adsorb copper ions and subsequently phosphate ions from aqueous solutions. The optimal concentrations of chitosan (2% w/v) and STPP (7.5% w/v) during chitosan beads preparation and the optimal pH of 5.0 during adsorption were determined. Several adsorption models, including pseudo-first-order, pseudo-second-order, Langmuir, and Freundlich models, were used to evaluate the static adsorption experimental data. Moreover, the chitosan beads were applied in a dynamic adsorption column and several models including Bohart-Adam, Thomas, Yoon-Nelson, and Clark models were used to describe the system. This study showed that after adsorbing heavy metal ions, chitosan-STPP beads can be used for further adsorption of toxic anions from wastewater.
KEYWORDS:Adsorption; Chitosan; Copper; Phosphate; Sequent Adsorption; STPP
Download this article as:| Copy the following to cite this article: Nguyen T. A, Bui H. T, Dang V. B. H, Trinh T. B. H, Le T. H. T, Nguyen V. T. Sequent Adsorption of Phosphate Ions by Copper Ions Adsorbed on Tripolyphosphate Chitosan. Orient J Chem 2023;39(2). |
| Copy the following to cite this URL: Nguyen T. A, Bui H. T, Dang V. B. H, Trinh T. B. H, Le T. H. T, Nguyen V. T. Sequent Adsorption of Phosphate Ions by Copper Ions Adsorbed on Tripolyphosphate Chitosan. Orient J Chem 2023;39(2). Available from: https://bit.ly/3KyddOd |
Introduction
Wastewater contains toxic waterborne pollutants such as bacteria and heavy metal ions, which pose health problems to humans. Conventional approaches to removing heavy metal ions from wastewater include precipitation, filtration, electrochemical treatment, and adsorption, with the latter as an effective and low-cost separation process. In recent years, increasing attention is being attracted to natural polymers as alternative adsorbents due to their high affinity to heavy metal ions. Other advantages of natural polymers as adsorbents include their abundance, biocompatibility and environmental safety 1.
Chitosan, which is a biopolymer derived from chitin found in crustacean shells, in the last decade was extensively studied thanks to its unique properties in adsorbing heavy metal ions, including chromium 2,3, copper4,5, mercury6,7, and lead 7,8 from aqueous wastewater. Chitosan contains amine and C-3 hydroxyl groups that can adsorb heavy metal ions through chelation, ion exchange, electrostatic attraction, or ternary complexation 5.
Because chitosan dissolves in acidic solutions, chemical and physical modifications were usually employed to increase its stability and adsorption capacity. It was reported sodium tripolyphosphate (STPP) can form electrostatic crosslinking effects between its tripolyphosphate anions with the protonated amine groups of chitosan. Due to the large size of tripolyphosphate ions, the space between chitosan chains increased after crosslinking, thus improving the accessibility of metal ions to the reactive functional groups in chitosan and increasing its adsorption capacity 10.
After adsorbing heavy metal ions, the surface of chitosan is covered with a layer of cations, which can further adsorb toxic anions from wastewater. Therefore, in this study, after crosslinking chitosan with STPP and using it as an adsorbent for copper(II) ions, we further used the chitosan-copper material to adsorb phosphate ions from aqueous solutions. Static and dynamic adsorption models for the adsorption of copper and phosphate ions were also be established and studied in this research.
Materials and Methods
Chemicals and materials
Chitosan (98.6% purity and 91.6% deacetylation degree) was purchased from ChitosanVietnam LTD. All other chemicals were purchased from Xilong LTD and of analytical grades.
Preparation of chitosan beads
Chitosan was dissolved in a 1% acetic acid solution to obtain concentrations from 1.5% to 4%. The chitosan solution was dropped from a syringe into an STPP solution (6.5 to 8.5%) to produce chitosan beads with a volume ratio 1:2 of chitosan:STPP solutions. After 24 h, the chitosan beads were collected, washed using deionized water until neutral pH of the washings, and then dried at 40 oC for 24 h.
Static absorption study
In a typical experiment, 1 g of the chitosan beads was shaked at 250 rpm in 100 mL of an adsorbate (Cu2+ or PO43-) solution at pH = 5 for 4 h at 30 oC in a water bath. The copper ion concentrations were determined using titration with EDTA on an automatic titrator Titroline 5000 (SI Analytics, Germany), while the phosphate ions concentration was determined using a colorimetric method 11.
The static adsorption kinetics was modelled using pseudo-first-order and pseudo-second-order adsorption models with the following linearized integrated equations [12]:

where k1 and k2 are the rate constant in the pseudo-first-order and pseudo-second-order models, respectively; qe and qt (mmol/g) are the adsorbed amount of adsorbate at equilibrium and at any moment t.
Equilibrium amounts of adsorbates were used to fit into the following r can be calculate to evaluate Langmuir and Freundlich isotherms, respectively:

Where KL andKF: are adsorption equilibrium constants in the Langmuir and Freundlich models, respectively; qmax and q are the sorption capacity and the absorbed amount on the chitosan beads, respectively.
From KL and the initial concentration of adsorbate C, the separation factor can be calculated to evaluate the separating ability of the chitosan beads:

Column dynamic adsorption
A glass column with an inner diameter of 1 cm was filled with the chitosan beads (Fig. 1). An adsorbate solution was pumped through the column and the passed solution was collected continuously to determine the concentration of the remaining adsorbate.
To evaluate the loss of adsorbing capacity over time and the column service time in a fixed-bed adsorption column, the following equations were used to model the dynamic adsorption.
Linearized Thomas model:

where C0, Ce are the inlet and outlet concentrations (mg/L) ,qo is the sorption capacity (mg/g), m is the mass of absorbed substance (g/g), Q is the flow rate (mL/min), V is the volume of solution that passed the column (mL), KT is the Thomas rate constant (mL.min-1.mg-1).
Linearized Yoon –Nelson model

where KYN is the rate constant (min-1), τ is the time to adsorb 50% of the sorption capacity (min), t is the sorption time (min).
Linearized Bohart – Adam model:
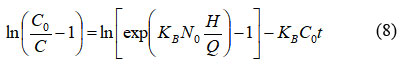
where KB is the kinetic constant in the Bohart – Adam model (L.mg-1.min-1), Q is the flow rate (mL/min), H is the length of the adsorption column (cm).
Linearized Clark model:

where n is the Freundlich constant; lnA and r are constants in the Clark model.
 |
Figure 1: Experimental setup for column dynamic adsorption |
Results and Discussion
Appearance and morphology of the absorbent before and after absorbing copper and phosphate ions
Chitosan beads were formed as white spheres when the chitosan solution was dropped into the STPP solution (Fig. 2A). In this stage, STPP as the crosslinking agent firstly reacted with the outer chitosan layer of the drop to form a hard shell. During the ageing time, STPP diffused into the chitosan solution drop and further crosslinked chitosan molecules to form a gel. The crosslinking and gelation processes exclude water molecules and hence reduced the size of the beads (Fig. 2B).
The beads turned dark green after absorbing copper ions (Fig. 2C) due to the electrostatic interactions between the phosphate anions on the bead surface and copper cations from the solution. The beads then turned light blue after subsequent absorption of phosphate ions (Fig. 2D), indicating further interactions between the absorbed copper ions and the phosphate ions.
 |
Figure 2: Appearance of chitosan beads at various stages of production and adsorption |
SEM micrographs show that the chitosan beads are sphere-like with diameters of approximately 1 mm (Fig. 3A). Higher magnification revealed the shrinkled morphology of the beads due to water evaporation when they were dried. This shrinkage may increase the surface area and hence be advantageous for the adsorbent.
After adsorbing copper ions (Fig. 3B) and phosphate ions (Fig. 3C), the surface of the beads became significantly cracked. The reason for this crack may be due to absorbed copper ions that reacted with amino groups of chitosan and phosphate groups of STPP, hence weakening the 3D structure of chitosan beads.
 |
Figure 3: SEM micrographs of chitosan beads before adsorption (A), after adsorption of |
Influence of factors on copper adsorbing capacity of chitosan beads
Concentrations of chitosan and STPP during beads preparation
Fig. 4 shows that when the STPP concentration was fixed at 7%, the adsorption efficiency and capacity were highest with 2% chitosan concentration. It should be noted that the copper binding capacity of the chitosan beads was mainly due to the presence of phosphate moieties. Because the concentration of STPP was fixed, higher chitosan concentrations would result in depletion of STPP in solution and lower phosphate contents in the chitosan beads, hence lowering copper adsorption capacity. Although amine groups can bind copper ions through complexation, the acidic medium turned amine groups into -NH3+ with a much lower copper binding capacity 13.
 |
Figure 4: Influence of chitosan concentration on copper adsorption efficiency and capacity at pH =5, Co=100 mg/L. |
 |
Figure 5: Influence of STPP concentration on copper adsorption efficiency and capacity at pH =5, Co=100 mg/L. |
Fig. 5 shows that when chitosan concentration was 2%, maximum copper adsorption capacity and efficiency were reached at 7.5% w/v STPP concentration. Higher STPP concentration would result in too high densities of crosslinks and hence rendering the diffusion of copper ions into the beads. From these results, we chose 2% w/v chitosan and 7.5% w/v STPP concentrations for further studies.
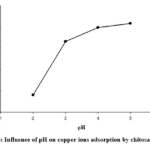 |
Figure 6: Influence of pH on copper ions adsorption by chitosan beads. |
Adsorption pH
The adsorption experiments were conducted at pH <5.4 because higher pH would result in the precipitation of copper ions as hydroxides 14. Fig. 6 shows that the efficiency of copper removal increased with increasing pH in the studied range. This result is consistent with other studies, in which the optimum pH for copper adsorption by chitosan tripolyphosphate was 5 15 and a highly acidic medium would significantly lower the adsorption efficiency 16. At low pH, the phosphate ions are converted to phosphoric acid, while amine groups are converted to -NH3+ ions with significantly lower affinities to copper ions 17. From this result, we chose pH = 5 for further studies.
Influence of the amount of chitosan beads and adsorption time
Fig. 7 shows that when increasing the mass of chitosan beads used for 100 mL of copper ions, the adsorption efficiency increased and the adsorbed capacity decreased. These results were normal because more adsorbent would adsorb more copper ions and the load of adsorbed copper ions per gram of adsorbent would decrease. Besides, increasing the contact time between the adsorbent and the copper ions solution would increase the adsorbing efficiency (Fig. 8). From these results, we chose 1 g of adsorbent per 100 mL and 150 min of contact time for further studies.
 |
Figure 7: Influence of amount of chitosan beads on adsorbing efficiency and capacity for 100 mL of copper ions solution. |
 |
Figure 8: Influence of contact time between chitosan beads and copper solution. |
Modelling adsorption kinetics for copper ions
The results of calculations of adsorption kinetics according to the pseudo-first/second-order models are presented in table 1. The determination coefficients R2 for second-order kinetics were higher than those for first-order were higher than 0.92, and the adsorption capacity for second-order kinetics were closer to the experimental adsorption capacity than that for first-order kinetics. These results showed that the pseudo-second-order kinetics was more appropriate to describe the adsorption process of copper ions onto the chitosan beads, which is consistent with several studies on adsorption of copper ions on chitosan-STPP 18, carbon materials 19,20, kaolin/zeolite 21. It should be noted that the k2 values in Table 1 decreased with increased copper concentrations indicating that the adsorption of copper ions on chitosan beads is a complex process.
Table 1: Parameters in the adsorption kinetic models for copper ions
|
C mg/L |
Exp. qe |
Pseudo-first-order |
Pseudo-second-order |
|||||
|
k1 |
qe, |
R2 |
k2 |
qe |
R2 |
h |
||
|
50 |
4.84 |
0.028 |
5.01 |
0.9828 |
0.0047 |
6.035 |
0.994 |
0.171 |
|
100 |
9.52 |
0.027 |
15.53 |
0.9202 |
0.0019 |
11.655 |
0.9967 |
0.258 |
|
150 |
13.4 |
0.021 |
20.41 |
0.9400 |
0.0008 |
17.452 |
0.9986 |
0.244 |
Isothermal adsorption models for copper ions
A comparison of the R2 values in the Langmuir and Freundlich models shows that the adsorption of copper ions by the chitosan beads is better described by the Langmuir model.
Table 2: Parameters in the Langmuir and Freundlich models for copper adsorption.
|
|
Langmuir model |
Freundlich model |
||
|
Parameters |
qmax(mg/g) |
19.08 |
n |
1.73 |
|
KL |
0.10 |
KF |
2.18 |
|
|
R2 |
0.999 |
R2 |
0.9702 |
|
From the KL of the Langmuir model and the initial concentration of copper ions, we determined RL using the formula (7). When the initial concentration of copper ions increased, the RL values became closer to 0, indicating irreversible adsorption 22
Table 3: RL values when increasing the initial concentration of copper ions.
|
Concentration (mg/L) |
20 |
60 |
100 |
140 |
180 |
220 |
|
RL |
0.33 |
0.14 |
0.09 |
0.06 |
0.05 |
0.04 |
Subsequent adsorption of phosphate ions by chitosan beads after adsorbing copper ions
In a recent study, Perez-Novo et. Al demonstrated that phosphate ions can be scavenged by copper ions 23. Therefore, after adsorbing 29.12 mg Cu/g adsorbent, we dried and used the adsorbent for further adsorbing phosphate ions. Preliminary experiments showed that 60 min was enough to reach adsorption equilibrium (Fig. 9).
At pH=2, most of copper ions were desorbed from the adsorbent, hence making the latter incapable of adsorbing phosphate ions. When the pH increased from 3 to 7, the amount of adsorbed phosphate decreased (Fig. 10), possiblly due to the competition of the hydroxide ions with the phosphate ions in binding with copper.
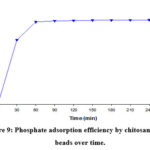 |
Figure 9: Phosphate adsorption efficiency by chitosan-copper beads over time. |
 |
Figure 10: Influence of pH on the phosphate adsorption capacity of the chitosan-copper beads. |
Kinetic models for phosphate adsorption by chitosan-copper beads
Values of R2 in Table 4 indicate that the pseudo-second-order model was more appropriate in describing the phosphate adsorption kinetics at phosphate concentrations lower than 57 mg/mL. When the phosphate concentration was higher, the pseudo-first-order model gave more fit to the experimental data.
Table 4: Parameters in the adsorption kinetic models for phosphate ions
|
C mg/L |
Pseudo-first-order |
Pseudo-second-order |
||||
|
k1 |
qe, |
R2 |
k2 |
qe |
R2 |
|
|
34.14 |
0.069 |
11.676 |
0.9124 |
0.006 |
7.479 |
0.9924 |
|
56.22 |
0.056 |
14.086 |
0.9303 |
0.005 |
10.764 |
0.9972 |
|
70.61 |
0.041 |
14.119 |
0.9601 |
0.002 |
14.124 |
0.9481 |
As for copper ions adsorption, the adsorption of phosphate ions by the chitosan-copper adsorption was better described by the Langmuir model (Table 5). According to the Langmuir model, a monolayer of copper ions was adsorbed on the chitosan bead surface, which subsequently binds another layer of phosphate ions.
Table 5: Parameters in the Langmuir and Freundlich models for phosphate adsorption
|
|
Langmuir model |
Freundlich model |
||
|
Parameters |
qmax(mg/g) |
8.7 |
n |
1.91 |
|
KL |
0.37 |
KF |
2.29 |
|
|
R2 |
0.9928 |
R2 |
0.9898 |
|
Dynamic adsorption models for copper and phosphate ions
In this study, we used linearized Bohart-Adam and Clark models (Equations 8 and 9) to process the experimental data (Fig. 11) and obtain the parameters of these models (Table 6).
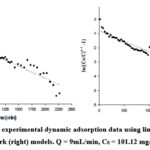 |
Figure 11: Processing experimental dynamic adsorption data using linearized Bohart-Adam (left) and Clark (right) models. |
Table 6. Calculated parameters in the Bohart-Adam and Clark models for dynamic adsorption of copper ions by chitosan beads
|
Variable |
Bohart-Adam model |
Clark model |
||||||
|
Co (mg/L) |
Q (ml/p) |
H (cm) |
KB (m3/kg.s) |
No (kg/m3) |
R2 |
r (L/h) |
ln B |
R2 |
|
101.1 |
9 |
16.5 |
0.00024728 |
23.382 |
0.9241 |
0.0015 |
-0.7992 |
0.9258 |
|
101.76 |
12 |
32 |
9.827.10-5 |
48.035 |
0.905 |
0.0006 |
-0.591 |
0.9039 |
The calculation results indicate that both models described the experimental data with relatively high determination coefficients (R2>0.90). All parameters in the models (KB, No, r, ln B) depended on the flow rate, initial concentration and the height of the adsorption column.
We then further modelled the experimental dynamic adsorption data of phosphate ions using Thomas, Yoon – Nelson and Bohart – Adam models and the results are shown in Table 7. The determination coefficients R2 for Bohart-Adam model were lower than 0.52, while those for Thomas and Yoon-Nelson models were higher than 0.82. All parameters in the models depended on the flow rate, initial phosphate concentration and the height of the adsorption column.
According to the Thomas model, KT coefficient increased with higher flow rate and lower column height. Besides, the maximum adsorption capacity q0 increased with higher flow rate and column height.
According to the Yoon-Nelson model, the KYN coefficient increased with flow rate and column height. Besides, the time when the phosphate concentration remained 50% of the initial increased with the higher column height and lower flow rate.
Table 7: Calculated parameters in the Thomas, Yoon-Nelson and Bohart-Adam models for dynamic adsorption of phosphate ions by chitosan-copper beads.
|
Variable |
Thomas |
Yoon – Nelson |
Bohart-Adam |
||||||||
|
Co mg/L |
Q mL/min |
H cm |
KT mL/min/g |
qo mg/g |
R2 |
KYN L/min |
τ min |
R2 |
105KB m3/kg.s |
No kg/m3 |
R2 |
|
153.9 |
12 |
32 |
0.032 |
93.6 |
0.86 |
0.005 |
507 |
0.86 |
21.7 |
83 |
0.51 |
|
152.0 |
9 |
16.5 |
0.033 |
87.68 |
0.82 |
0.005 |
320 |
0.82 |
11.0 |
165 |
0.43 |
Conclusion
This study showed that chitosan beads crosslinked by STPP effectively adsorbed copper ions and then can be utilized to subsequently adsorb phosphate ions thanks to the copper-phosphate interactions. This approach may be used for other heavy metals ion and pollutant anions. Besides, further studies are required to enhance the adsorbing capacities of the adsorbent and adapt the material to real-world applications.
Acknowledgment
We acknowledge the support of time and facilities from Ho Chi Minh City University of Teahnology (HCMUT), VNU-HCM for this study.
Conflict of Interest
The author declare that we have no conflict of interest.
References
- Yaashikaa P., Kumar P.S., Karishma S., Environ Res, 2022, 212, 113-114.
CrossRef - Schmuhl R.,Krieg H., Keizer K., Water Sa, 2001, 27, 1-8.
- Boddu V.M., Abburi K.,Talbott J.L., Smith E.D., Environ Sci Technol, 2003, 37, 4449-4456.
CrossRef - Cheung J. Ng, W., McKay G., J Colloid Interf Sci, 2002, 255, 64-74.
CrossRef - Yu K., Ho J., McCandlish E., Buckley B., Patel R., Li Z., Shapley N.C., Colloid Surface A, 2013, 425, 31-41.
CrossRef - Jeon C., Höll W.H., Water Res, 2003, 37, 4770-4780.
CrossRef - Kyzas G.Z., Deliyanni E.A., Molecules, 2013, 18, 6193-6214.
CrossRef - Wan M.W., Kan C.C., Rogel B.D., Dalida M.L.P., Carbohyd Polym, 2010, 80, 891-899.
CrossRef - Jin L., Bai R., Langmuir, 2002, 18, 9765-9770.
CrossRef - Guibal E., Sep Purif Technol, 2004, 38, 43-74.
CrossRef - Dai J., Yang H., Yan H., Shangguan Y., Zheng Q., Cheng R., Chem Eng J, 2011, 166, 970-977.
CrossRef - Ho Y., McKay G., Process Saf Environ, 1998, 76, 332-340.
CrossRef - Liu H., Gao C., Polym Advan Technol, 2009, 20, 613-619.
CrossRef - Renman A., Renman G., Chemosphere, 2010, 79, 659-664.
CrossRef - Lee S.T., Mi F.L., Shen Y.J., Shyu S.S., Polymers, 2001, 42, 1879-1892.
CrossRef - Ngah W.W., Fatinathan S., J Environ Manage, 2010, 91, 958-969.
CrossRef - Ngah W.W., Endud C., Mayanar R., React Funct Polym, 2002, 50, 181-190.
CrossRef - Wu S.J., Liou T.H., Yeh C.H., Mi F.L., Lin T.K., J Appl Polym Sci, 2013, 127, 4573-4580.
CrossRef - Demiral H., Güngör C., J Clean Prod, 2016, 124, 103-113.
CrossRef - Mobasherpour I., Salahi E., Ebrahimi M., J Saudi Chem Soc, 2014, 18, 792-801.
CrossRef - El-Eswed B., Yousef R.I., Alshaaer M., Hamadneh I., Khalili F., Adv Mater Phys & Chem, 2013, 2, 119.
CrossRef - Mansour M., Ossman M., Farag H., Desalination, 2011, 272, 301-305.
CrossRef - Pérez-Novo C., Bermúdez-Couso A., López-Periago E., Fernández-Calviño D., Arias-Estévez M., Geoderma, 2009, 150, 166-170.
CrossRef

This work is licensed under a Creative Commons Attribution 4.0 International License.
About The Author
![]()
A New Edition of Web of Science
Journal Impact Factor
2022: 0.5
Five Year: 0.8
Journal is Indexed in

Cabells Whitelist
![]()


