Spectroscopic, Voltammetric, DFT and Molecular Docking Studies of Copper (II) Complex of Carbothiohydrazide Derivative
Reem K. Shah1 , Marwa G. Elghalban1,2 and Ahmed M. El-Defrawy1,2*
1Department of Chemistry, Faculty of Applied Science, Umm Al-Qura University, Makkah, Saudi Arabia.
2Department of Chemistry, Faculty of Science, Mansoura University, 35516 Egypt.
Corresponding Author E-mail: ameldefrawy@gmail.com
DOI : http://dx.doi.org/10.13005/ojc/370210
Article Received on : 30-Mar-2021
Article Accepted on : 30-Apr-2021
Article Published : 26 Apr 2021
In this work, the nature of complexation between copper and N′,2-bis((E)-2-hydroxybenzylidene) hydrazine-1-carbothiohydrazide (a promising metal sensing Schiff base with a marked biological activity) (H4L) has been investigated and experimentally characterized. The investigation includes spectroscopic tools as infrared spectra (FT-IR), XRD, thermal analysis (TG) Raman spectra, UV-Vis, in addition to cyclic voltammetric study. Quantum chemical calculations using density functional theory (DFT) used to predict the structural properties of the complex under investigation and to aid in the explanation of the electronic spectra of the complex. In addition to that, the Molecular docking for the complex under investigation with the 2ylh target protein have been conducted in order to check the biological activity of the complex.
KEYWORDS:Copper Complexes, Carbothiohydrazide; Cyclic Voltammetry; Molecular Docking
Download this article as:| Copy the following to cite this article: Shah R. K, Elghalban M. G, El-Defrawy A. M. Spectroscopic, Voltammetric, DFT and Molecular Docking Studies of Copper (II) Complex of Carbothiohydrazide Derivative. Orient J Chem 2021;37(2). |
| Copy the following to cite this URL: Shah R. K, Elghalban M. G, El-Defrawy A. M. Spectroscopic, Voltammetric, DFT and Molecular Docking Studies of Copper (II) Complex of Carbothiohydrazide Derivative. Orient J Chem 2021;37(2). Available from: https://bit.ly/3vjNA9e |
Introduction
Organic dyes are an important class of compounds that attracts much interest because of its wide applications particularly in biotechnology and medical diagnostics.1,2. The structures, spectroscopic properties and chemical reactivates of these dyes are different in many aspects. Schiff base ligands in metal complexes show wide applications in chemistry. Carbothiohydrazide is a member of a well-known class of compounds that possess high biological and coordination ability due to the presence of several heteroatoms as N, O and S atoms 3-8. Cations play an important role in many biological processes. In some cases, the absence of these cations in the human body or its overdoses is known to have some effects for specific diseases. Copper is the third most abundant heavy metal coming after iron and zinc. Excess copper is toxic and can cause neurodegenerative diseases, like Alzheimer’s and Wilson’s disease9, 10.
Because of the above mentioned, search for different methods for the quantitative analytical procedure for the determination of copper have been motivated 11-15. The analytical determination of Cu2+ metal ion in biological and environmental systems 16–20, has attracted Considerable attention for many scientists. Among them, colorimetric and electroanalytical methods have become of a great importance due to their high selectivity, sensitivity, and adaptability 21-28. The binding mode between ligand and metal ion will be evaluated by DFT calculations. The time-dependent density functional theory (TD-DFT) approach along with the polarizable continuum model (PCM) has been extensively used to assess UV–visible spectra for metal complexes. In this work, we report the redox properties as well as cation sensing behavior of absence and the presence of Cu2+ consequently to check the feasibility of Carbothiohydrazide -based Schiff base as an electrochemical sensor for metal ions. Docking study of ligand schiff base and the Cu-complex under investigation in this study toward the 2ylh target protein will be investigated.
Experimental
Materials and instrumentation
All chemicals used in this study were of analytical grade quality, and used as received without further purification. UV–Vis absorption spectra were recorded with a Shimadzu UV-240 spectrophotometer using quartz cells with 1 cm optical path length in DMSO as a solvent. The Schiff base ligand, N′,2-bis((E)-2-hydroxybenzylidene) hydrazine-1-carbothiohydrazide (H4L), (Fig.1) used in this study was prepared as reported previously 29.
 |
Figure 1: structure of N′,2-bis((E)-2-hydroxybenzylidene) hydrazine-1- carbothiohydrazide (H4L). |
Copper salt used as commercially available from Sigma-Aldrich. The copper complex is synthesized where the Schiff base ligand is added to the metal salt (copper chloride (CuCl2.2H2O)) in 1:1 ratio, where 1mmol (0.3144 g) of ethanolic solution of the ligand drop wisely added to 1 mmol (0.1705 gm) of Copper salt and refluxed for 3-4 h. The precipitate was then filtered and dried.
The X-ray diffraction patterns (XRD) were obtained on Pikagu diffractometer using CuKα radiation. The infrared spectra, as KBr discs, were recorded on JASCO FT-IR-4100 Spectrophotometer (400–4000 cm-1). Raman spectra were recorded on Brucker Raman microscope (sientera) in the range from 100-4000 cm-1. Shimadzu thermogravimetric analyzer equipment used in thermal analysis of the complex at a heating rate of 10 °C min−1 under nitrogen in a temperature range of 20–900 °C.
Electrodes
Alumina powder (down to 0.06 mm) was used to polish the polycrystalline gold (poly-Au) electrode (1.6 mm in diameter) which is then rinsed with water followed by 10 min sonication in bidistilled water. In addition to that, the electrode is pretreated electrochemically in 0.05 M H2SO4 solution saturated with N2. The potential was then scanned in the ranges of – 0.2 to 1.5 V vs. Ag/AgCl (KCl sat.) at 100 mV s-1 for 10 min to check the CV for the Au electrode as obtained in Fig. 2.
 |
Figur 2: Cyclic voltammtery of a clean Au electrode. |
Computational details
To further evaluate the selectivity of the different sites of the ligand (H4L) and investigate the complex formation of Cu2+ complex under investigation, DFT method of calculations with (B3LYP) exchange-correlation functional level of theory was carried out using the Gaussian09 package. The ligand as well as the 1:1 species were optimized applying the B3LYP/ 6-31G(d) level of theory for C, H, O, N, S atoms, while the LANL2DZ basis set has been applied for the copper atom without any symmetry constrains and with default convergence criteria. The structure of the complex under investigation has been checked to be a minimum with the absence of imaginary frequencies. All the calculations have been performed using GAUSSIAN 09 software. Time dependent density functional level (TDDFT) calculation was conducted, based on the optimized geometries, applying the B3LYP/GEN level of theory in DMSO as a solvent with the polarizable continuum model (PCM) in order to calculate the vertical electron transition energies.
Molecula docking
Molegro Virtual Docker (MVD) program 30, 31 was used for Molecular docking procedure for the ligand and the cu-complex with the protein (2ylh, DOI: 10.2210/pdb2YLH/pdb). The cavity with the binding site for docked ligand and complex crystal structure of the protein was performed by applying the grid-based cavity prediction algorithm in which minimization of the protein residues active sites were achieved. Torsion angles in the side chains were modified during the minimization proecess while all other properties were held fixed. For each docking procedure, 10 independent runs were conducted. The the lowest (negative ) energy poses was taken as the best-scoring one based on the MolDock Score and Rerank Score.
Results and Discussion
Characterization of Copper complex in solid feature
The Cu (II) complex was synthesized using Schiff base (C15H14O2N4S) in its solid feature to give an insight about the interaction behavior which may serve to visualize the solution condition. The following discussion will be focused on the results of characterization of the solid complex using different tools.
IR and Raman spectra
The assignment has been made by an analysis of the normal modes. Since the complex posses 114 vibrational degrees of freedom, only the predominant bands, for which experimental data are available, would be discussed. The O-H bond in the spectra of the complex is masked by the presence of the coordinated water showing absorbance at the 3443cm-1. The absence of the deprotonation of the N-H and consequently its absence in the complex formation is observed based on the appearance of a peak at 3201 cm-1 in the spectra of the complex. The C–H stretching modes in the phenyl ring vibrations appear in the region 3100– 3000 cm-1.32 The absence of any band in 2500-2800 cm-1 in the region of the IR and Raman spectrum (Fig.3) of the ligand infers that the thiol tautomer is absent in the solid phase 33. This is also confirmed by the presence of a strong peak in both the ligand and complex spectra around 1185 cm-1 assigned to the C=S stretching mode. Moreover, an unshifted peak at 821 cm-1, could be assigned in both the ligand and the complex spectra as C=S bending mode that give another confirmation for the absence of the C=S in the complex formation. A splitted peak appears on the 1620 cm-1 region in the ligand spectra could be assigned to a C=C bond stretch with a contribution from the bending mode of the H2O coordinated to the metal ion. Coordination of the C=N group assigned at 1539 cm-1 causes the strong peak to be shift and decrease in intensity confirming the participation of the Nitrogen atom in the complex formation with the copper ion. The coordination through oxygen atom was confirmed by the appearance of a new peak due to Cu-O in the range 530-510 cm-1. The band assigned for ν (Cu-N) appears in 450 – 440 cm-1 range in the Raman spectra of the complex 34-36.
 |
Figure 3: Mid IR spectra (2000-200cm-1) (A), |
Thermal Analysis (TGA and DTG) investigations
The thermogravimetric analysis (TGA) curve of the complex displays three degradation stages. The first one starts at 45 oC till 400 oC and attributes to the loss of one water molecules by 4.71% (calcd. 4.58%) weights. The two follower stages corresponding to successive endothermic degradation till 789oC as inferred from the derivative thermogravimetric analysis (DTG) (Fig.4). As inferred from these results, the thermal stability of the complex formed could be attributed to the coordination of the metal ion to the ligand 37. The foregoing results confirmed the square pyramidal coordination around the copper atom.
 |
Figure 4: (A) TGA, (B) DTG analysis for the complex. |
XRD studies
XRD patterns for the solid complex were carried out in the diffraction angle (θ) range of 10˚ < 2θ < 90˚ degrees [Fig.5]. The most prominent intensity peak (2θ (13.88o)) with relative intensity (1000%) was used with a full width at half maximum (FWHM) (0.4148) to evaluate the crystalline size by applying Deby–Scherrer equation 29. The crystal size of the complex particles was found to be 3.596 nm. Bragg equation: nλ = 2dsin(θ) was used to calculate to calculate, (at n = 1), the inner crystal plane d-spacing value (d=3.211).
 |
Figure 5: XRD of Cu(II) complex. Click here to View figure |
Cyclic voltammetery
The response of the blank is featureless; it presents just the charging current. Upon adding, the ligand to the blank, the response is negligible (Fig.6 a) indicating that the ligand is electrochemically inactive within the studied potential range. In the presence of copper (Fig.6 curve c) the anodic peak is obtained at 0.34 V, coupled with a redox peak coupled at 0.32 V, probably corresponds to the Cu2+/Cu+ couple (Fig.6).
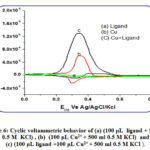 |
Figure 6: Cyclic voltammetric behavior of (a) (100 μL ligand + 500 ml 0.5 M KCl) , (b) (100 μL Cu2+ + 500 ml 0.5 M KCl) and (c) (100 μL ligand +100 μL Cu2+ + 500 ml 0.5 M KCl ). |
Interestingly in the presence of similar copper concentrations along with ligand, coexisting together, the copper response significantly increased indicating some interaction between the ligand (Fig. 6) which is likely to be a complex formed. This gives an indication of the possible use of this ligand as a reagent in electrochemical determination of copper in solution. The onset potentials of the cyclic volatmmety could be used to determine the HOMO energy level of the copper complex under investigation applying the following relation: EHOMO=-(Eox+4.4) eV, where EHOMO is the HOMO energy level, and the electrode potential value are vs. SCE as the reference electrode. The EHOMO estimated from the cyclic volatmetery, using Eox onset of 0.2254 v, would be -4.625 v. This value is in good agreement with that obtained theoretically (-5.5974 ev).
Geometry and structural parameters of the complex
Considering the geometry of ligand (Fig.7), the two phenyl rings and the heteroatom of the thiosemcarbazide moieties are not in the same plane. Hence, with this geometry, it facilitates the bonding to Cu2+, where by this atomic orientation the ligand molecule shows a considerable rotation and flexibility.
 |
Figure 7: Optimized structure of the Ligand showing atomic numbering as obtained from DFT/B3LYP/6-31G(d) calculations. |
Fig.8 shows the optimized 1:1 copper complex under investigation along with the atomic numbering. The optimized geometries computed for ligand and square pyramidal (1:1) copper complex as calculated by B3LYP level of theory are depicted in Table 1. In the copper complex, it was found that the two diagonal angles of the coordination sphere are in the range of 177–173◦ and the four angular projections formed by the four bonds around the copper atom are in the range 80–90◦ (Table 1). The presence of a four coordinated bonds between Cu2+ and the ligand gives a molecular system with a nearly planar structure Hence, a well-established square pyramidal geometry is observed for the complex under investigation with the copper atom forming three six–memeberd rings that stabilize the formed complex.
 |
Figure 8: Optimized structure of the the Cu complex showing atomic numbering as obtained from DFT/B3LYP calculations. |
Table 1: Selected experimental/calculated bond length (A˚) and angles for Cu-complex and ligand.
|
parameter |
Cu-complex |
Ligand |
|
R(1-2) |
1.380 |
1.389 |
|
R(1-6) |
1.411 |
1.401 |
|
R(2-3) |
1.420 |
1.409 |
|
R(3-4) |
1.434 |
1.412 |
|
R(3-7) |
1.428 |
1.480 |
|
R(4-5) |
1.421 |
1.400 |
|
R(4-31) |
1.307 |
1.368 |
|
R(5-6) |
1.384 |
1.391 |
|
R(7-8) |
1.308 |
1.292 |
|
R(8-9) |
1.386 |
1.393 |
|
R(8-33) |
2.027 |
– |
|
R(9-19) |
1.350 |
1.373 |
|
R(10-11) |
1.421 |
1.400 |
|
R(10-15) |
1.384 |
1.391 |
|
R(11-12) |
1.434 |
1.413 |
|
R(11-32) |
1.307 |
1.366 |
|
R(12-13) |
1.420 |
1.409 |
|
R(12-16) |
1.428 |
1.479 |
|
R(13-14) |
1.380 |
1.389 |
|
R(14-15) |
1.411 |
1.401 |
|
R(16-17) |
1.308 |
1.292 |
|
R(17-18) |
1.386 |
1.366 |
|
R(17-33) |
2.022 |
– |
|
R(18-19) |
1.350 |
1.371 |
|
R(19-20) |
1.707 |
1.677 |
|
R(31-33) |
1.940 |
– |
|
R(32-33) |
1.942 |
– |
|
R(36-38) |
0.976 |
– |
|
A(2-1-6) |
118.9 |
119.4 |
|
A(1-2-3) |
121.4 |
121.4 |
|
A(1-6-5) |
121.2 |
120.4 |
|
A(2-3-4) |
119.8 |
118.3 |
|
A(2-3-7) |
117.3 |
118.5 |
|
A(4-3-7) |
122.9 |
123.2 |
|
A(3-4-5) |
117.4 |
120.3 |
|
A(3-4-31) |
123.4 |
123.1 |
|
A(3-7-8) |
127.0 |
129.9 |
|
A(5-4-31) |
119.2 |
116.6 |
|
A(4-5-6) |
121.3 |
120.1 |
|
A(4-31-33) |
127.9 |
– |
|
A(7-8-9) |
114.3 |
118.1 |
|
A(7-8-33) |
123.5 |
– |
|
A(9-8-33) |
122.1 |
– |
|
A(8-9-19) |
129.1 |
121.7 |
|
A(8-33-17) |
90.5 |
– |
|
A(8-33-31) |
90.7 |
– |
|
A(8-33-32) |
173.2 |
– |
|
A(8-33-36) |
109.6 |
– |
|
A(9-19-18) |
122.8 |
110.9 |
|
A(9-19-20) |
118.6 |
124.8 |
|
A(11-10-15) |
121.4 |
120.1 |
|
A(10-11-12) |
117.4 |
120.2 |
|
A(10-11-32) |
119.1 |
116.6 |
|
A(10-15-14) |
121.2 |
120.5 |
|
A(12-11-32) |
123.5 |
123.2 |
|
A(11-12-13) |
119.8 |
118.4 |
|
A(11-12-16) |
123.0 |
122.8 |
|
A(11-32-33) |
128.1 |
– |
|
A(13-12-16) |
117.2 |
118.7 |
|
A(12-13-14) |
121.4 |
121.4 |
|
A(12-16-17) |
127.0 |
129.6 |
|
A(13-14-15) |
118.9 |
119.4 |
|
A(16-17-18) |
114.4 |
117.7 |
|
A(16-17-33) |
124.0 |
– |
|
A(18-17-33) |
121.6 |
– |
|
A(17-18-19) |
129.0 |
121.7 |
|
A(17-33-31) |
177.2 |
– |
|
A(17-33-32) |
91.1 |
– |
|
A(18-19-20) |
118.6 |
124.3 |
|
A(31-33-32) |
87.5 |
– |
|
A(31-33-36) |
75.5 |
– |
|
A(32-33-36) |
76.3 |
– |
|
A(33-36-37) |
75.9 |
– |
|
A(33-36-38) |
75.6 |
– |
|
A(37-36-38) |
101.9 |
– |
The angles around copper show slight distortions from the normal values of square pyramidal geometry with angles vary from lowest 87.5 o to highest 91.5o. The average Cu-N bond distance of 2.024 (Table 1) is in agreement with the values reported for other Cu(II)- complexes 38-43. The Cu-O bond length of 1.941 Å slightly shorter than the normal range observed for the aqua copper (II) complexes 44. This semi rigid structure indicated the suitability of the space available to accommodate the copper metal ion. The rest of the bonds and the angles show some variations (Table1) according to the effect of the coordination sphere on this parameter.
The trigonality index (τ) is used to predict the geometry around Cu2+ ion 45. The trigonality index could be expressed as : τ = (φ1-φ2)/60°, where φ1 and φ2 are the largest angles in the coordination sphere. A perfect square pyramidal geometry could be verified when τ = 0, while a perfect trigonal bipyramid geometry could be verified when τ = 1. In our case τ = (177.2°-173.2°)/60° = 0.066. A square planar geometry could be verified in a Cu2+ complexes when the values of (τ) lie in the range 0.05–0.17 46, 47. The obtained value for the τ index for the complex under investigation indicates a square-based pyramidal geometry which is slightly distorted. The basal plane contains the Nitrogen atoms and hydroxyl oxygen atoms from the ligand where as the coordinated oxygen from the water molecule being on the apical position.
UV-Vis absorption spectra
Recently, TD-DFT calculations have been approved as useful method for studying excitation energies [48, 49]. TDDFT calculations, applying the B3LYP/GEN level of theory in DMSO as a solvent, on the Cu2+ complex under investigation have been carried out in order to aid in the assignment of the UV-Vis electronic absorption bands obtained experimentally. The assignment of the calculated electronic excitation energies alongside with their oscillator compared to the experimental transitions (λexp) are recorded in Table 2. The electronic transitions anticipated for the metal complexes could be one of the following transitions based on the metal used. d-d transition is one of these transitions and could be observed in the range of (300 – 1500 nm). In addition to that, two charge transfer bands namely ligand to metal charge transfer transition (MLCT) as well as Ligand to metal charge transfer transition(LMCT) transitions could be observed in the range (200 – 500 nm). Another transition known as Intra ligand charge transfer transition (ILCT) could be obtained in the UV region 49.
Table 2: The orbital transition contributions for some electronic transition for the L-Cu2+ complex as obtained from the TDDFT calculation.(A:Alpha, B:beta)
|
Excitation energy(nm) |
Electronic Transition* |
Oscillator strength |
λ(nm) exp. |
Assignment |
Percent contribution% |
coefficient of transition |
|
791 |
ψ 100B – ψ 101B ψ90B – ψ 101B |
0.0001 |
LMCT |
62 27 |
0.78616 0.51675 |
|
|
693 |
ψ 87B – ψ 101B ψ 92B – ψ 101B ψ 95B – ψ 101B |
0.0005 |
d-d/LMCT |
10 19 45 |
-0.31417 0.43447 0.66981 |
|
|
616 |
ψ 85B – ψ 101B ψ 89B -101B ψ 92B – ψ 101B ψ 98B – ψ 101B ψ 99B – ψ 101B |
0.0004 |
d-d/LMCT |
11 40 9 10 19 |
0.33533 0.63336 -0.30071 -0.31158 0.43123 |
|
|
577 |
ψ 85B – ψ 101B ψ 88B – ψ 101B ψ 89B – ψ 101B ψ 92B – ψ 101B |
0.0007 |
520 |
d-d/LMCT |
15 13 26 22 |
-0.38798 0.36675 0.51228 0.47024 |
|
482 |
ψ 85B – ψ 101B ψ 99B – ψ 101B |
0.0091 |
470 |
d-d/LMCT |
11 65 |
-0.33403 0.80667 |
|
443 |
ψ 101A – ψ 102A ψ 100B – ψ 102B |
0.1047 |
440 |
ILCT |
43 49 |
0.65757 0.69893 |
|
402 |
ψ 100A- ψ 102A ψ 101A – ψ 103A ψ 99B – ψ 102B ψ 100B -103B |
0.0047 |
ILCT |
15 24 28 16 |
-0.38036 -0.48993 0.52556 0.39826 |
|
|
390 |
ψ 99B- ψ 102B ψ 100A- ψ 102A |
0.1882 |
390 |
ILCT |
30 45 |
0.54679 0.67372 |
|
364 |
ψ 96B- ψ 101B ψ 101A- ψ 103A ψ 100B- ψ 103B |
0.1751 |
360 |
LMCT |
11 32 39 |
0.33002 0.56369 0.62631 |
|
337 |
ψ 99A- ψ 102A ψ 98B- ψ 102B |
0.1934 |
ILCT |
38 47 |
0.61659 0.68849 |
|
|
319 |
ψ 96A- ψ 102A ψ 97A- ψ 102A ψ 96B- ψ 102B |
0.3081 |
330 |
ILCT/MLCT |
16 21 52 |
0.39564 0.46116 0.7175 |
|
303 |
ψ 94B- ψ 101B |
0.2127 |
LMCT |
69 |
0.83045 |
|
|
296 |
ψ 85B- ψ 101B ψ 92B- ψ 101B ψ 94B- ψ 101B ψ 95B- ψ 101B |
0.1138 |
ILCT/MLCT |
11 13 12 39 |
0.33177 0.36415 0.34085 0.62202 |
|
|
277 |
ψ 94A- ψ 102A ψ 96A- ψ 103A ψ 97A- ψ 103A ψ 96B- ψ 103B |
0.1402 |
ILCT/MLCT |
10 10 26 37 |
0.32107 0.30443 0.50621 0.60943 |
|
|
262 |
ψ 95A- ψ 102A ψ 94A- ψ 102B |
0.1908 |
ILCT |
26 33 |
0.50825 0.57463 |
*HOMO=ψ101, LUMO=ψ102 for both A(alpha) and B(beta)
Two bands were observed for the Cu-complex at 520nm and 470 nm (Fig.9). These two bands resulted from [d(cu) +π(H4L)]→ [d(cu) +π*(H4L)] electronic transition with a mixed character of d-d/LMCT transitions.
From the TD-DFT calculations performed at the optimized geometries of the Cu-complex, we observed that the molecular orbitals were found to include both Alpha and Beta orbitals (Table2). The electron arrangement in the MO with the presence of single electron in the HOMO and LUMO for the Complex suggests its paramagnetic character. In addition to that, the two peaks obtained experimentally for the complex were predicted at 577 nm and 482 nm are in an excellent agreement with those observed experimentally (Fig.9). The oscillator strength for these two theoretically predicted bands was 0.007 and 0.0091 respectively. The molecular orbital that mainly contribute to the electronic transition are depicted in Table2. Fig.10 shows the frontier molecular orbitals contributing to these electronic transitions.
 |
Figure 9: Experimental and theoretical electronic spectra for the Cu-complex. Click here to View figure |
 |
Figure 10: Frontier molecular orbitals predicted for the Cu2+ complex as obtained from the TDDFT/ B3LYP level of calculation. |
The optical band gap (Eg) calculated from the experimental spectra for the complex was found to be equal to 2.225 ev. This value is in good agreement with that obtained theoretically as the difference between the HOMO and LUMO energies 2.399 ev. This gives an indication about the quality of the theoretical calculation at this level of theory and confirms the adequacy of using the different parameters obtained from these calculations to be compared to the corresponding experimental ones.
Molecular docking
The previous results of molecular docking study inferred that the Schiff base ligand used in this study may bind to the active site 2ylh protein and show a high tendency compared to some other proteins 29. Thus, to obtain more information on how the complex formation of this ligand with copper could alter or affect the binding ability with this protein (2ylh).
The Schiff base ligand used in the preparation of the complex under investigation contains electron donor nitrogen atoms that can form hydrogen bonds. In addition to that, a sulfur atom, which is doubly bonded to a carbon atom, is an electronegative atom that is a weak hydrogen bond acceptor 50, 51. These atoms show the ability of the Schiff base ligand to interact with the target protein (Fig.11). Through the interaction between the Schiff base ligand and the target protein, the binding region in target protein (2ylh) is formed as a pocket formed by hydrophobic amino acids chains val67, val111 and pro114 (Table 3). In addition to that, polar amino acids chains residues of ser66, ser68, Thr62 and Gln64 along with a charged Lys112 residue constitutes the binding sites pocket of the protein. A hydrogen bond of 2.848 Ǻ is formed between the ligand and the target protein through the interaction between the azo- Nitrogen atom with the polar Gln64 amino acid residue (Table 3).
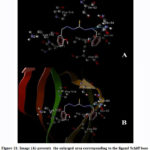 |
Figure 11: Image (A) presents the enlarged area corresponding to the ligand Schiff base binding sites in subdomain of 2yLH target protein. (B)Ribbon model of 2ylh target protein with detected binding site for ligand Schiff base. |
Concerning the interaction between the Cu-complex with the target protein (Fig.12), the cavity amino acid residues are almost the same as in case of that of the Schiff base ligand docking with only one exception which is the polar ser68 amino acid replaced by the charged Asp68 amino acid residue (Table 3). A hydrogen bond of 3.810 Ǻ is formed between the Cu- complex and the target protein through the interaction with the polar Thr62 amino acid residue (Table 3). The longer hydrogen bond formed in case of the Cu-complex and the target protein compared to that of the ligand could be explained on basis of the bad clashes (steric interactions) exist .These results indicate a comparable inhibition effect of the ligand and the Cu-complex toward the target protein.
 |
Figure 12: Image (A) presents the enlarged area corresponding to the ligand Cu complex binding sites in subdomain of 2ylh target protein. (B)Ribbon model of 2ylh target protein with detected binding site for ligand Cu complex. |
Table 3: Interaction energies (Rerank Score and Moldock Score) between different ligands and 2ylh target protein.
|
Ligand |
Rerank Score |
MoldockScore |
Binding sites |
|
Schiff base |
-115.125 |
-134.246 |
val67, val111 , pro114, ser66, ser68, Thr62 , ,Gln64 , Lys112 |
|
Cu- Complex |
-87.875 |
-116.908 |
val67, val111 , pro114, ser66, Asp68, Thr62 , ,Gln64 , Lys112 |
Conclusions
The results of the experimental investigation of the prepared Cu2+ complex in this study proposed the square pyramidal geometry for the complex under investigation. The ground state structural parameters of the Cu-complex investigated by DFT method of calculation in solution phase at the B3LYP/6-31g (d) level of theory for all atoms except the Cu atom LANL2DZ basis set, are in good agreement with corresponding cited parameters in similar systems . The trigonality index (τ) was calculated to be 0.066 around the Cu2+ for the complex under investigation. This value supports the square pyramidal geometry. The Cu-N bond length found to be within an average 2.024Å where as the Cu-O bond length found to be within an average 1.940Å. The investigated cyclic voltammetry of the complex gives a HOMO value of -4.625 v, which is in good agreement with the theoretically obtained value. Moreover, XRD study of the copper complex gives a particle size of 3.596nm. The electronic spectrum of copper complex showed two main bands at 520 and 470 nm mainly attributable to mixed d-d/ LMCT. Good agreement between the experimental and calculated absorption spectra of the Cu2+ complexes under investigation. Docking study of Schiff base ligand and the Cu-complex under investigation in this study show a good biological activity of the Cu-complex compared toward the 2ylh target protein.
Acknowledgement
The authors would like to thank the institute of scientific research and Revival of Islamic Heritage at Umm Al-Qura University, project ID (43405034) for the financial support.
Conflict of Interest
The authors declare that they have no conflict of interest.
Reference
- Bates M.; Huang B.; Dempsey G.T.; Zhuang X. Science, 2007, 317, 1749-1753.
CrossRef - Marks K.M.; Nolan G.P. Nat. Meth., 2006, 3, 591.
CrossRef - Lin H.H.; Wu W.Y.; Cao S.L.; Liao J.; Ma L.; Gao M.; Li Z.F.; Xu X. Bioorganic Med. Chem. Lett., 2013, 23(11), 3304-33011.
CrossRef - Gomha S. M.; El-Hag F. A. A.; El Defrawy A. M.; Farghaly T. A. Curr. Org. Synth., 2016 , 13, 907-916.
CrossRef - Kasuga N.C.; Hara Y.; Koumo C.; Sekino K.; Nomiya K. Acta Crystallogr. Sect. C Cryst. Struct. Commun., 1999 , C55, 1264-1267.
CrossRef - Kasuga N.C.; Ohashi A.; Koumo C.; Uesugi J.; Oda M.; Nomiya K. Chem. Lett., 1997 , 26(7), 609-610.
CrossRef - Macalik L.; Pyrkosz-Bulska M.; Małecki G.; Hermanowicz K.; Solarz P.; J. Janczak; J. Hanuza. Inorg. Chem. Comm., 2021, 123, 108351-108359.
CrossRef - Castiñeiras A.; Fernández-Hermida N.; García-Santos I.; Gómez-Rodríguez L. Proceedings, 2019, 41(1), 10-16.
CrossRef - Malvankar P. L.; Shinde V. M. Analst., 1991, 116 , 1081-1084.
CrossRef - C. Bull P.; Thomas G. R.; J; Rommens M.; Forbes J. R.; Cox D. W. Nat. Genet., 1993, 5 , 327-337.
CrossRef - Xi. P.; Dou J.; Huang L.; Xu M.; Chen F.; Wu Y.; Bai D.; Li W.; Zeng Z. Sens. Actuators B, 2010,148, 337-341.
CrossRef - Zhang X.; Shiraishi Y.; Hirai T. Org. Lett., 2007, 9 , 5039-5042.
CrossRef - Chen X.; Jou M. J.; Lee H.; Kou S.; Lim J.; Nam S. W.; Park S.; Kim K. M.; Yoon J. Sens. Actuators B, 2009, 137 , 597-602.
CrossRef - Dong M.; Ma T.H. Zhang A. J.; Dong Y.-M.; Wang Y. W.; Peng Y. Dyes Pigm., 2010, 87 , 164-172.
CrossRef - Chen X.; Ma H. Anal. Chim. Acta., 2006, 575 , 217-222.
CrossRef - Jayabharathi J.; Thanikachalam V.; Jayamoorthy K.; Sathishkumar R. Spectrochim. Acta. A, 2012, 97, 384–387.
CrossRef - Qu Q.; Zhu A.; Shao X.; Shi G.; Tian Y. Chem. Commun., 2012, 48, 5473–5475.
CrossRef - Que E.L.; Domaille D.W.; Chang C.J. Chem. Rev., 2008, 108 , 1517–1549.
CrossRef - Yu C.; Zhang J.; Wang R.; Chen L. Org. Biomol. Chem., 2010, 8 , 5277–5279.
CrossRef - Liu Y.; Sun Y.; Du J.; Lv X.; Zhao Y.; Chen M.; et al. Org. Biomol. Chem., 2011, 9, 432–437.
CrossRef - Tehrani M. B. and Souri E. E J. Chem., 2011, 8 , 587–590.
- Barazandeh Tehrani M.; Mirkamali S. M. S.; Souri E.; and Foroumadi A. Asian J. Chem., 2012, 24, 4517–4521.
- Alfonso M.; T´arraga A.; and Molina P. Inorg. Chem., 2013, 52, 7487–7496.
CrossRef - Cao Q. Y.; Lee M. H.; Zhang J. F.; Ren W. X.; and Kim J. S. Tetrahedron Lett., 2011, 52, 2786–2789.
CrossRef - Liu Y.; Li M.; Zhao Q.; Wu H.; Huang K.; and Li F. Inorg. Chem ., 2011, 50, 5969–5977.
CrossRef - Lou B.; Chen Z. Q.; Bian Z. Q.; Huang and C. H. New J. Chem., 2010, 34 , 132–136.
CrossRef - Khan T. K. and Ravikanth M. Dyes Pigm., 2012, 95, 89–95.
CrossRef - Kim Y. R.; Kim H. J.; Lee M. H. et al. Chem. Comm., 2010, 46, 8448–8450.
CrossRef - El-Metwaly N. M. and El-Ghalban M. G. J. Mole. Liq., 2016, 220, 265–276.
CrossRef - Molegro Virtual Docker; CLC bio 2012; version 5.5
- Thomsen T.; Christensen M.H. J.Med. Chem., 2006, 49, 3315-3321.
CrossRef - West D. X.; Kozub N. and Bain G. A. Trans. Met. Chem., 1996, 21, 52-57 .
- Jain S. K.; Garg B. S.; Bhoon Y. K.; Klayman D. L. and Scovill J. P. Spectrochim Acta, 1985, 41 , 407-413 .
CrossRef - Inskeep R. G. J. Inorg. Nucl. Chem., 1962, 24, 763-776 .
CrossRef - Schilt A. A. and Taylor R. C. J. Inorg. Nucl. Chem., 1959, 9, 217-221 .
- Manoyama M. Inorg. Chim. Acta., 1975, 13, 5-10 .
- Mohamed G. G.; Nour-Ei Dien F. A. and El-Gamel E. A. J. Therm. Anal. Cal., 2002, 67, 135-146.
CrossRef - Pariya C.; Panneerselvan K.; Chung C.S.; Lu T. H. Polyhedron, 1998, 17, 2555-2561.
CrossRef - Pariya C.; Liao F.L.; Wang S. L.; Chung C.S. Polyhedron, 1998, 17, 547- 554.
CrossRef - Fu D. W.; Zhao H. Acta Cryst. E, 2007, 63, 1630.
CrossRef - Pavlova S.V.; Wen Y. S.; Chan S.I. Acta Cryst. E, 2003, 59, 792-793.
CrossRef - Sureshbabu P.;. Tjakraatmadja A.A.J.S; Hanmandlu C.; Elavarasan K.; Kulak N.; Sabiah S. RSC Adv., 2015, 5 , 22405-22418.
CrossRef - Nawaz S.; Ghaffar A.; Mehboob M. M.; Tahir M.N.; Alotaibi M.A.; Isab A.A.; Ahmad S. Z. Naturforsch. B, 2017, 72 , 43-47.
CrossRef - de Almeida K. J. l.; Murugan N. A.; Rinkevicius Z.; Hugosson H. W.; Vahtras O.; gren H. Ǻ. and Cesar A. Phys. Chem. Chem. Phys., 2009, 11, 508-519.
CrossRef - Addison A.W.; Rao T.N.; Reedijk J.; Rijn J. v.; Verchoor G.C. J. Chem. Soc. Dalton Trans., 1984 , 1349–1356.
CrossRef - Vishwakarma P. K.; Mir J. M. and Maurya R. C. J. Chem. Sci., 2016, 128, 511-522.
CrossRef - Patel R. N.; Gundla V. L. N. and Patel D. K. Polyhedron, 2008, 27, 1054-1060.
CrossRef - Zárate X.; Schott E.; Carey D.M.; Bustos C.; and Arratia-Pérez R. J. Mol. Struct.: THEOCHEM, 2010, 957, 126-132.
CrossRef - Mohammed L.S.; Hamza I.S.; AL -Deen F.R.M.; and Muhyedeen B.R.J. J. Applic. Chem., 2014, 3, 2102-2122.
- Patrick G.L. An Introduction to Medicinal Chemistry; 3rd edn.; p. 9; Oxford University Press; New York, 2005.
- Reichman U.; Bergmann F.; Lichtenberg D.; Neiman Z. J. Chem. Soc., Perkin Trans. I; 1973, 793-800.
CrossRef

This work is licensed under a Creative Commons Attribution 4.0 International License.
About The Author
![]()
A New Edition of Web of Science
Journal Impact Factor
2022: 0.5
Five Year: 0.8
Journal is Indexed in

Cabells Whitelist
![]()


