Physicochemical Analysis of Ground Water Quality, Hydrochemical Characterization of the Doukkala Plain, Morocco
Mostafa Doubi1* , Abderazzak Nimour1, Ahmed Dermaj1, Mohammed Aboulouafa1, Rachid Touir2 and Hamid Erramli1
1Laboratory of organic chemistry, inorganic, electrochemistry, and environment, Faculty of Science, University IbnTofail, B.P 133, 1400, Kenitra, Morocco.
2Regional Center for Education and Training Professions (CRMEF), Kenitra, Morocco.
Corresponding Author E-mail: doubi_mostafa@yahoo.fr
DOI : http://dx.doi.org/10.13005/ojc/370213
Download this article as:
![]()
This study concerns the analysis of the physico-chemical parameters (T°, pH, EC, NO3-, Cl-, PO43-, HCO3-, SO42-, Ca2+, Mg2+, K+ and Na+) of groundwater from the Doukkala, in order to establish its pollution diagnosis. Thus, water samples were taken at 8 stations in January and July.The results show that the wells are characterized by a geochemical facies Chloride and sulphate of calcium and magnesiu and potassium chloride or sodium sulphate. According to Moroccan standards and the values of certain parameters such as temperature, hydrogen potential, conductivity, alkalis, alkaline earth metals, sulphates, chlorides the studied the ground water was classified from good to poor quality (CNS, 1994).
KEYWORDS:Conductivity; Doukkala Groundwater; Physico-chemical Parameters; Water quality.
Introduction
Morocco classify in the category of countries in a situation of chronic water stress (Water Basin Agency State, OumErrbia Quality, 2016, Morocco). The deterioration of the water quality resources by the increase of different sources of pollution (fertilizers and pesticides, discharges of untreated wastewater, discharges of uncontrolled solid waste, urbanization, mining….etc), leads to the degradation of the groundwater quality (AsfersY. et al., 2017). So, in our previous work, the fertilizing value of the domestic wastewater of Dar Gueddari and the influence of these waters on the growth and yield of grain corn were evaluated (NjimatS.et al., 2019).For this, six elementary parcels were cultivated and irrigated with raw and purified wastewater at different percentages of dilution in comparison with the waters of the groundwater considered as a control. It is found that the parcels treated with treated wastewater diluted to 50% have high growths with respect to the vegetative matter and grain
yield compared to the control without fertilizer (NjimatS. et al., 2019). The present study concerns the assessment of the physicochemical quality of groundwater from aquifers in the Doukkala region (Morocco). For this, it is necessary to determine the concentrations of a certain number of hydrogeochemical parameters (major elements, physicochemical parameters) in wells in the studied region using volumetric titration.
Materials and methods
Geographic location
The Sahel-Doukkala basin is one part of western Morocco. It is limited to the northeast by the Oum-Errbiawadi river, to the east by the Rehamna massif, to the south by the Gantour plateau and to the west by the Atlantic Ocean (AghzarN. et al., 2002; El AchhebA. et al., 2000). The region is part of the Moroccan Meseta, consists of sedimentary formations of tertiary, secondary and quaternary age resting on a base which is made up of metamorphic and granitic rocks. The Doukkala aquifer consists of two aquifers depending on the geology and hydrochemistry of the region:
 |
Figure 1: Geographic map of Doukkala |
The Sahel-Doukkala water table
The Sahel aquifer extends over a narrow strip of 3,100 km2 along the Atlantic Ocean. It circulates in dune formations of the Plio-Quaternary and limestone formations of the Cretaceous. It is used intensively for the development of market gardening. That of Doukkala, it extends over 3250 km2 under the Doukkala plain with limited potential. It circulates in plio-quaternary formations.
The tablecloth of ChaouiaCôtière
located between the right bank of the Oued Oum Erbia and the agglomeration of Casablanca. In addition to these main aquifers, there are also aquifer units in the basin such as the Senonian of Tadla, Ayer (Safi) and the localized aquifers of the primary and the Atlas.
Sampling sites
The water points were chosen so as to have an overall picture of the water table. We performed a total of 16 samples for the physico-chemical analysis of the water distributed as follows: 8 samples in January 2019 and 8 samples July 2019.
Analyzes performed
In Situ measurements
Certain physicochemical parameters change during transport. It is always preferable to take measurements on site, among these parameters we have temperature, pH and electrical conductivity, and these parameters are measured using a device (multi parameter Hanna HI 991300).
Measurements were conducted in the laboratory
The measurements of all the physicochemical parameters were carried out after 48 hours following the samples. The chloride was determined by silver nitrate “volumetric titration”(RodierJ. 1996).Calcium and magnesium ions are determined by titration with acid ethylene-diamine-tetracetique (EDTA)(RodierJ. 1996).Carbonates and bicarbonates are determined by volumetric titration with 0.1 N HCl. Concerning sodium and potassium ions, are dosed by photometry of the flame
Data analysis
The physicochemical data obtained were processed by Principal Component Analysis (PCA) using the XLSAT version 2014 software.
Results and discussion
Physicochemical parameters
Hydrogen potential
The pH depends on the origin of the water, the geological nature of the type of facies crossed. This parameter determines a few of physico-chemical equilibrium between water, the dissolved carbon dioxide, carbonates and bicarbonates (EttazariniS. 2006). The most natural waters, the pH is usually between 6 and 8.5. For doukkal aquifer, the pH values of the waters do not show notable variations for the two periods (the left represent January and the right represent july throughout the manuscript), with a minimum of 7.16 and a maximum of 8, which reveal to slight neutral alkalinity of the medium.
 |
Figure 2: Spatio-temporal variation of the pH of the wells in January and July. |
Conductivity
The conductivity in the two periods (Figure 3) shows that the four sites exceeds the potability Standards of the Morocco, this indicates that these waters of very poor quality with an electrical conductivity between 3110 µs/cm to 4100 µS/cm. The other sites are of good to medium quality with an electrical conductivity less than 2700 µS/cm.
Table 1: Values of waters conductivity in the study area.
|
Walls |
CE (January) |
CE(July) |
|
P1 |
3110 |
3472 |
|
P2 |
1382 |
1428 |
|
P3 |
3990 |
3620 |
|
P4 |
2320 |
2531 |
|
P5 |
2230 |
2536 |
|
P6 |
3720 |
3950 |
|
P7 |
3990 |
3376 |
|
P8 |
2790 |
2590 |
|
Appreciation |
Excellent |
Good |
Medium |
Bad |
Verybad |
|
EC (µs / cm) |
<750 |
750-1300 |
1300-2700 |
2700-3000 |
> 3000 |
Bicarbonates
From figure 3, we note that the lowest content is recorded in the well P3, but generally, the alkalinity remains almost constant in different stations with contents varying between 290 mg/L and 390 mg/L, the water from the wells is of medium to poor quality.
 |
Figure 3: Spatio-temporal variation of the bicarbonate of the wells in January and July. |
Nitrates content
According to Figure 4, the nitrates have high contents, between 52 mg/L and 210 mg/L for the 4 sites “P1, P3, P4, P5” which are of poor quality, while the other sites are of excellent to medium with a nitrate content between 2.6 and 42.6 mg/L.
 |
Figure 4: Spatio-temporal variation of nitrate from wells in January and July. |
|
Appreciation |
Excellent |
Good |
Medium |
Bad |
Verybad |
|
NO3– (mg/L) |
<10 |
10-25 |
25-50 |
> 50 |
– |
Chloride content
The chloride concentrations in different stations vary in the same direction as the total mineralization of the water such as indicated in Figure 5. The chloride content is variable: Six sites (P1, P3, P4, P5, P6 and P7) have chloride contents respectively of 2023.5 mg/L, 923mg/Ll, 1029 mg/L, 674.5mg/L, 1032mg/L and 1029.5mg/L, they are characterized by poor to very poor quality. The other sites are of good to medium quality, with chloride content between 256.2 mg/L and 514.75 mg/L
 |
Figure 5: Spatio-temporal variation of the chloride of the wells in January and July |
Sulphates
The evolution of the sulphate content presented in Figure 6 shows very high values in P1, P3, P5. These stations are characterized by poor to very poor quality. The other sites are characterized by excellent to medium quality with a chloride content varying between 86.7 and 195, generally in groundwater the sulphate content is related to the abundance of secondary evaporite formations mainly gypsum (CaSO4, 2H2O) and anhydrite (CaSO4)(RodierJ. 1996).
 |
Figure 6: Spatio-temporal variation of the sulphate of the wells in January and July |
|
Appreciation |
Excellent |
Good |
Average |
Bad |
Verybad |
|
Cl– (mg/L) |
9-200 |
200-300 |
300-750 |
750-1000 |
1000-6000 |
|
SO42- (mg/L) |
1-100 |
100-200 |
200-250 |
250-400 |
400-2000 |
Cations
The evolutions of sodium, magnesium and potassium concentrationsare presented in Figures 7, 8 and 9, respectively. So, the sodium concentration reaches very high values at different stations “vary between 200 mg/L and 1080 mg/L “, (Figure 7) they are classified as bad to very bad quality, while the magnesium concentration remains constant in all the stations, its origin is related to the dominance of the calc-dolomitic grounds of the region (EttazariniS. 2006; KetraneR. et al. 2010). Concerning potassium, the content is high in the P1 site, P6, P7, P3 and P8 with rates between 120 and 200 mg/l, against the well P2, P4 and P5 having a rate which does not exceed 50mg / l. This shows these waters are classified from good to average (Figure 9).
 |
Figure 7: Spatio-temporal variation of sodium in wells in January and July. |
 |
Figure 8: Spatio-temporal variation of the magnesium of the wells in January and July. |
 |
Figure 9: Spatio-temporal variation of potassium in wells in January and July. |
Chemical facies
Piper’s diagram
The representation on the diagram of Piper and Schoeller we allowed a rapid approach of analytical results with a view to characterize the waters (Figure 10 and 11) and to classify the anions and major cations for the aquifers (FoufouA. et al., 2017; BelkhiriL. et al., 2017).
 |
Figure 10: Piper diagram |
 |
Figure 11: Piper diagram for the different sites in for the different sites in january and july. |
According to Figure 11, we can deduce that the surface waters of the different stations of the region studied present two types of hydro-chemical facies and present:
Chlorinated and sulphated calcium and magnesium
Sodium and potassium chloride and sodium sulphate.
Study of the quality of groundwater for agricultural use.
The analysis of the Absorbed Sodium Rate (SAR) for all the samples analyzed shows that the quality of the groundwater remains generally stable during the two seasons,The SAR of most waters present medium to moderate risk for soil alkalinization, except for the two wells P1 and P4 which are characterized by high risk (Figure 12).
 |
Figure 12: Riverside diagram for the different sites in january and july. |
Principal component analysis and ascending hierarchical classification
Principal component analysis
Analysis of the PCA results of the space of the variables of the F1-F2 factorial plane (Figure 13) show that this F1-F2 factorial plane expresses 70.18 % of the expressed variance. Table 2 presents the eigenvalues, the variances expressed for each factor and their cumulation. Factor F1, with an expressed variance of 44.34%, is the most important factor, and factor F2 expresses 25.83% of the variance.
 |
Figure 13: Distribution of variables in the factorial plane formed by CP 1 and 2. |
The F1 axis is strongly correlated on the positive side with temperature, CE, NO3–, Cl–, HCO3–, SO42-, Ca2+, Mg2+, K+, Na+. This axis expresses the strong mineralization of water (AboulouafaM. et al. 2019). Conversely, axis 2 is strongly correlated on the negative side with temperature, sulphates, magnesium and correlated on the positive side with nitrates, sodium, chloride and bicarbonates.
Table 2: Eigenvalues and percentages calculate for the main axes.
| Appreciation |
F1 |
F2 |
|
Variability (%) |
44.344 |
25.835 |
|
Cumulative % |
44.344 |
70.178 |
Ascending hierarchical classification
The dendrogram representing the hierarchical classification of wells (Figure 14) obtained from the physicochemical data shows at a first level of partition two groups of stations:
Group 2: it groups together the wells P1, P2, P4 and P5
Group 3: it brings together wells P3, P6, P7 and P8
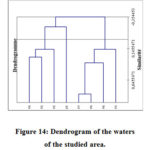 |
Figure 14: Dendrogram of the waters of the studied area. |
This distribution is based on mineralization and nitrogen pollution which indicate a contribution from human activities.
Conclusion
The hydrochemical study of the Doukkala water table shows a variability of the facies which subdivides into two types: a sodium and potassium chloride or calcium sulphatefacies,especially in the P1, P2, P4 wells and a calcium and magnesian chloride and sulphatefacies for the wells P5, P6, P7, P8.The conductivity of water is generally high and fluctuates between 1500 µS/cm and 2500 µS/cm. this mineralization would come from the dissolution of the aquifer rock.
The results of the physico-chemical analysis of the water from the Doukkala water table showed that the conductivity, sodium and chlorides generally testify that the quality of water from poor quality wells according to Moroccan standards (CNS, 1994) except for P2 and P8. Thus, the nitrate concentration in all the wells show values less than or equal to the standards for drinking water 50 mg/L according to the World Health Organization (WHO) except for the well P1, P3, P4, P5 which exceeds the standards, this confirms the impact of the intensification of agriculture and may be the discharge of domestic and industrial wastewater (Moustarhfer, K. 2016;Boualla,O. (2016) ; Hamdani, A (2001). In addition, the mineralogy, the chemical quality of this groundwater are variable. Some are salty; others have high levels of nitrates. The Principal component analysis and the ascending hierarchical classification show also that the water resources studied, “groundwater” are strongly influenced by water-rock interaction (very important mineralization) and human activities. The results obtained affirm that the quality of irrigation water is mediocre to bad.
References
- Aboulouafa, M.; Doubi, M.; Ibn Ahmed, S.; Nimour, A. (2019).Mapping, assessment and application of principal component analysis for study of physicochemical parameters and heavy metals in Berrechid ground water morocco, Indian j. Environmental protection,39(9):875-887.
- Aghzar, N.;Berdai, H.;Bellouti, A.;Soudi, B. (2002). Ground water nitrate pollution in Tadla (Morocco), J. Water Science,15 (2)
- Asfers,Y.;Taouil,H.; Amine,A.;Doubi,M.;Ibn Ahmed,S. (2017). Assessment of metal pollution in the waters of the Oulja wells, OumEr-Rbia watershed, Chem., Res. J., 2(5):186-191.
- Belkhiri,L.;Mouni,L.;Tiri,A.;Narany,T.S. (2017).Evaluation of groundwater quality and its suitability for drinking and agricultural purposes using self-organizing maps, World Academy of Science, Engineering and Technology International Journal of Geological and Environmental Engineering11, No:8.
- El Achheb,A.; Mania,J.; Mudry,J. (2000). Processus de salinisation des eaux souterraines dans le bassin Sahel Doukkala (Maroc occidental), Proc. TraM’2000, Liège Belgique.10-20.
- Ettazarini,S. (2006).Mapping of groundwater quality in the Turonian aquifer of OumEr-Rabia Basin, Morocco: a case study, Environ. Geol., 50: 919–929.
CrossRef - Foufou,A.;Djorfi,S.;Haied,N.;Kechiched,R.;Azlaoui,M.; Hani,A.(2017).Water pollution diagnosis and risk assessment of WadiZied plain aquifer caused by the leachates of Annaba landfill (N-E Algeria), Energy Procedia,119:393–406.
CrossRef - Ketrane,R.;Leleyter,L.;Baraud,F.;Jeannin,M.; Gil,O.;Saidani,B. (2010).Characterization of natural scale deposits formed in southern Algeria groundwater.Effect of its major ions on calcium carbonate precipitation, Desalination262:21–30.
CrossRef - Njimat, S.;Griou, H.;Doubi, M.;Aboulouafa, M.; Ibn Ahmed, S. (2019).Fertilizing power study of wastewater From Dar El Gueddari WWTP-Grain Corn Case, Indian j. Envir. Protec., 39(9):839-843.
- Rodier,J. (1996).Analysis of natural water, wastewater, sea water, 8 Edition Dénod Paris, p. 1383.
Moustarhfer, K.; Saber, N.; Mouhcine, H. (2016). Fertility of agricultural soils in the area of JorfLasfar (El Jadida-Morocco) International Journal of Environment, Agriculture and Biotechnology (IJEAB) 4: 2456-187 - Boualla,O.; Mehdi, K. ; Zourarah, B. (2016). Collapse dolines susceptibility mapping in DoukkalaAbda (Western Morocco) by using GIS matrix method (GMM).Model.Earth Syst. Environ. 2:9 DOI 10.1007/s40808-015-0064-8
CrossRef - Hamdani, A.; Assobhei, O.; Mountadar M. (2001).Caractérisation et essais de dénitrification biologique d’un effluent de laiterie située dans la ville d’El Jadida (Maroc). Eau Ind.Nuisances, 242: 50-54.


![]()


