Influence of Temperature on the Rheological Behavior of Orange Honey
Ioana Stanciu
Department of Physical Chemistry, University of Bucharest, Faculty of Chemistry, 4-12 Elisabeta Blvd, 030018, Bucharest, Romania.
Corresponding Author E-mail: Istanciu75@yahoo.com
DOI : http://dx.doi.org/10.13005/ojc/370225
Article Received on : 08-Feb-2021
Article Accepted on :
Article Published : 18 Mar 2021
The study was performed to determine the effect of the logarithm of the viscosity on the inverse of the absolute temperature for orange honey. Based on the studied rheograms, it turned out to be a non-Newtonian fluid. The shear range used did not significantly affect the absolute viscosities of orange honey at different temperatures. The absolute viscosities of orange honey have decreased with increasing temperature and can be equipped with an Arrhenius type relationship. The rheological behavior is influenced by both humidity and its composition.
KEYWORDS:Orange Honey; Rheology; Temperature
Download this article as:| Copy the following to cite this article: Stanciul I. Influence of Temperature on the Rheological Behavior of Orange Honey. Orient J Chem 2021;37(2). |
| Copy the following to cite this URL: Stanciul I. Influence of Temperature on the Rheological Behavior of Orange Honey. Orient J Chem 2021;37(2). Available from: https://bit.ly/3lsq9aa |
Introduction
Honey is a natural product, consumed as food since ancient times [1]. The special status of honey for consumers is due to its natural product image and health benefits [2,3]. After some scandals over honey, its quality by origin has become associated with consumer expectations. For example, in the European Community, counterfeit Chinese honey with high fructose corn syrup has been found, with other incidents involving the discovery of an excessive residue of antibiotic residue in honey from third world countries [4] . Therefore, quality standards emphasize the importance of honey quality by origin, and this is used in promoting sales through specific labeling. Labels such as monoflora or polyflora, organic, with a protected designation of origin, meet the requirements of the consumer, as well as those of the honey industry and control bodies. In addition, researchers are required to provide methods and markers that link honey to existing regulations.
The specifications of honey with geographical indication are generally based on physico-chemical parameters. These indicators have been shown to have limited potential in determining the origin of honey. Consequently, the discovery of chemical markers to help determine the quality of honey by origin, has been the subject of many studies in recent times. This includes studies dealing with volatile compounds [5], phenolic compounds [6] and the mineral content [7] of honey of different floral and geographical origins. The most recent and comprehensive study of this kind is the one written by Kaskoniene et al., 2010, [8] study that provides excellent results trying to define typical compounds that are best associated with the origin of honey. Within the Trace project, natural markers of honey, such as minerals [9], the ratio of (bio) isotopes and genetic markers were determined to determine the geographical, botanical and production origin [10-16]. This article presents ln n versus 1/T on the rheological behavior of orange honey. Honey was studied in the temperature range 25-450C and humidity of 16%, 17%, 19% and 21%.
Material and methods
The orange honey studied in this article comes from Greece. A study was performed to determine the effect of shear rates (3.3 to 120 s – 1) on shear stresses for orange honey at temperatures between (25 to 45°C). The absolute viscosities of the orange honey were determined using a Haake VT 550 viscometer, a rotary viscometer with coaxial cylinder HV1 [17].
Results and discussion
Often, in technological processes, in order to improve the flow characteristics so as to facilitate the pumping, mixing, filling of containers, higher temperatures are used for the processed fluids. In liquids, viscosity is controlled by molecular cohesion forces and therefore the mobility of molecules increases by reducing the intensity of intermolecular forces, which explains the decrease in viscosity as the temperature increases. Hence the importance of strict temperature control when measuring viscosity or dependence .

It is the viscosity dependent on temperature and can be substantial, the change being up to 10% /°C. The expression of Arrhenius equation:
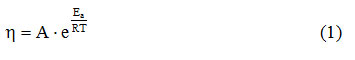
In this expression Ea (J. K-1mol-1) represents the activation energy for viscosity, A (Pa. S) is a proportionality factor, R – universal gas constant, T(K) – absolute temperature, η (Pa . s) – viscosity Newtonian fluid.
Because the activation energy, Ea, is the energy barrier that must be overcome for flow to occur, this parameter can be correlated with the association of liquid molecules. A high value for the activation energy suggests a strong association, as well as the fact that a large amount of energy is required to achieve the dissociation necessary to initiate the flow.
Parameter A having the unit of measurement of viscosity should represent a viscosity. Theoretically, it would be the viscosity reached by the product at infinite temperature. But as this is not feasible, it was agreed that A is only a factor of proportionality.
By logarithm, relation (1) can be linearized:
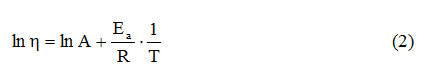
Written in this form, mathematically addictive In

is a right in which ln A is found at the intersection with the ordinate, and

it is the very slope of the right.
Therefore, the graphical representation of this dependence allows the graphical determination of the two parameters A and Ea, from the intersection with the ordinate, respectively from the slope of the line. Obviously, the two parameters ln A and

they can also be calculated by linear regression.
If a slight curvature (concavity) occurs near the ordinate, this suggests that there are strong secondary bonds in Newtonian fluid. In this situation, only the temperature range in which the curve is linear is chosen, and the value pairs A and Ea are associated with this temperature range. It is thus possible to predict the viscosity of a Newtonian fluid at any temperature in the linear range of the dependence In

.
If we write the equation (1) for two decks, one of reference, for which the values of viscosity nr at the reference temperature Tr are known, as well as for the unknown value of viscosity nx at temperature Tx, by dividing the two expressions we eliminate ln A, and by logarithm the expression is obtained that allows the calculation of the viscosity nx:
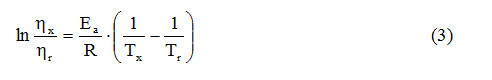
Using this relationship involves knowing the value of the activation energy for the Newtonian fluid studied.
The influence of temperature on an assortment of honey obtained from orange blossoms at different unit contents is presented in the following graphs [18]. For the calculation of the parameters A and Ea we graphically represented the logarithm of the viscosity values and the inverse of the temperatures (expressed as absolute temperatures) and we obtained the pairs of points that allowed the graphical representation of the dependence

 |
Figure 1: Linearization ln versus 1/T of an orange honey assortment, |
 |
Figure 2: Linearization ln versus 1/T of an assortment of honey from oranges, with a moisture content of 17% for the temperature. |
 |
Figure 3: Linearization ln versus 1/T of an assortment of honey from oranges, with a moisture content of 19% for the temperature range 25-45°C |
 |
Figure 4: Linearization ln versus 1/T of an assortment of honey from oranges, with a moisture content of 21% for the temperature range 25-45°C |
By the linear regression applied to the lines 1, 2, 3 and 4, it was possible to obtain the values for ln A at the intersection of the linear regression line with the ordinate,
respectively for

from the slope of the regression line. By cologaritmare the value of A is calculated, and from the product of the slope with the value of the universal gas constant (R) the value of the activation energy Ea is calculated. The obtained results are presented in table 1. It is observed from the table that the values of the two parameters A and Ea are influenced by the moisture content of the honey.
Table 1: Values obtained by nonlinear regression for parameters A and Ea in the case of an assortment of honey from potrocale at different moisture contents, for the temperature range 25-45°C
|
Moisture content (%) |
Ea (kJ . mol-1) |
A (Pa . s) |
R |
|
15.9 |
89.94 |
3.03 . 10-15 |
0.9992 |
|
17.0 |
84.76 |
1.42 . 10-14 |
0.9990 |
|
19.0 |
78.90 |
7.89 . 10-14 |
0.9988 |
|
21.0 |
73.17 |
4.56 . 10-13 |
0.9981 |
In the case of non-Newtonian fluids, temperature is expected to influence their flow behavior. In the case of pseudoplastic fluids, the temperature influences the value of the consistency coefficient K, but its influence on the behavior index n is insignificant. This means that by heating or cooling, if no fluid transformations occur, the pseudoplast character does not change.
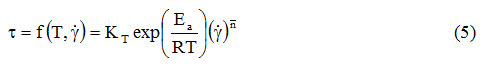
Because in non-Newtonian fluids the apparent viscosity is also influenced by the shear rate, the effects of temperature and shear rate have been combined in a single expression [17-24]:
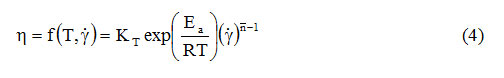
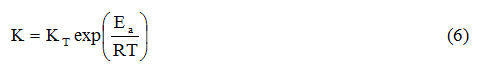
As in expression (1), and in expression (4) KT is a proportionality factor, even if it has the unit of measurement of the consistency coefficient (Pa. Sn). By amplifying the relation (4) with the shear speed, the influence of the temperature on the shear stress will be obtained:
From these two relations it can be seen that even in the case of the consistency coefficient the temperature has a logarithmic influence, of the form:
Conclusions
The effect of ln versus 1/T of honey showed that the viscosity of honey decreases with increasing temperature and best modeled with the Arrhenius equation. This article presents influence temperature on the rheological behavior of orange honey whose viscosity increases with increasing temperature. Honey was studied in the temperature range 25-450C and humidity of 16%, 17%, 19% and 21%.
The rheological behavior is influenced by both humidity and its composition. The activation energy decreases with increasing unity in a similar way to the correlation coefficient.
References
- Ransome, 2004. The sacred bee in ancient times and folklore. London: Courier Dover Publications, Dover Books on Antropology and Folklore
- Mărghitaş L., 2008. Albinele şi produsele lor, Editura Ceres, Bucureşti
- Bura M., Pătruică D., Bura V.A., 2005. Tehnologie apicolă, Editura Solness.
- Ochi T., 2005. American Bee Journal, 145(12), 937-938.
- Cuevas-Glory L.F., Pino J.A., Santiago L.S., Sauri-Duch E., 2007, Food Chemistry, 103(3), 1032-1043.
CrossRef - Pyrzynska I., Biesaga M., 2009, Trac-Trends in Analitical Chemistry, 28(7), 893-902.
CrossRef - Pohl P., 2009, Trac-Trends in Analitical Chemistry, 28(1), 117-128.
CrossRef - Kaskoniene V., Venskutonis P.R., 2010, Comprehensive Review of Food Science and Food Safety, 9(6), 620-634.
CrossRef - Vanhanen L.P., Emmertz A., Savage G.P., 2011, Food Chemistry, 128(1), 236-240.
CrossRef - Aliferis K.A., Tarantilis P.A., Harizanis P.C., Alissandrakis E., 2010, Food Chemistry, 121(3), 856-862.
CrossRef - Beretta G., Caneva E., Facino R.M., 2007, Planta Medica, 73(15), 1592-1595.
CrossRef - Terrab A., Pontes A., Heredia F.J., Diez M.J., 2004, Grana, 43, 116-121. CrossRef
- Tuberoso C.I.G., Bifulco E., Caboni P., Cottiglia F., Cabras P., Floris I., 2010,Journal of Agricultural and Food Chemistry, 58(1), 384-389.
CrossRef - Fernández Pierna J.A., Abbas O., Dardenne P., Baeten V., 2011, Biotechnological Agronomic Society, 15(1), 75-84.
- Woodcock T., Downey G., Kelly J.D., O’Donnell C., 2007, Journal of Agriculture and Food Chemistry, 55(22), 9128-9134.
CrossRef - Karoui R., Dufour E., Bosset J.O., De Baerdemaeker J., 2007, Food Chemistry, 101(1), 314-323.
CrossRef - Steffe, J.F. 1996. Rheological Methods in Food Process Engineering, Ediţia a 2-a, Freeman Press, 2807 Still Vallez Dr., East Lansing, MI 48823, USA
- Yanniotis S., Skaltsi S., Karaburnioti S. 2006, J. Food Engineering 72, 372–377
CrossRef - Stanciu I., 2015, Oriental Journal of Chemistry, 31(3), 1383-1387.
CrossRef - Stanciu I., 2015, Oriental Journal of Chemistry, 31(4), 2017-2023.
CrossRef - Stanciu I, Ouerfelli N., 2020, Journal of Biochemical Technology, 3(11), 52-57.
- Stanciu I., Messaâdi A., Díez-Sales O., Al-Jameel S.S., Mliki E., Herráez J.V., Ouerfelli N., 2020, Journal of Biochemical Technology, 3(11), 102-114.
- Stanciu I., Journal of Science and Arts, 2018, 2(43), pp. 453-458
- Stanciu I., 2012, Analele Universitatii “Ovidius” Constanta – Seria Chimie, 23(1), 27-30.
CrossRef

This work is licensed under a Creative Commons Attribution 4.0 International License.
About The Author
![]()
A New Edition of Web of Science
Journal Impact Factor
2022: 0.5
Five Year: 0.8
Journal is Indexed in

Cabells Whitelist
![]()


