Adsorption of N-Graphene from Coconut Shell
Minto Supeno , Agung Pratama*and Rista Haulian Purba
Department of Chemistry, Faculty of Mathematics and Natural Sciences, Universitas Sumatera Utara, Jl. Bioteknologi No.1, Kampus USU, Medan 20155, Indonesia
Corresponding Author E-mail: agungpratama@usu.ac.id
DOI : http://dx.doi.org/10.13005/ojc/360210
Article Received on : 11 Feb 2020
Article Accepted on : 05 Mar 2020
Article Published : 14 Apr 2020
Research on the adsorption of the N-Graphene from coconut shell has carried out. The purpose of this study was to determine the N-Graphene produced from coconut shell can be formed and to prepare an electrode in primary batteries. This study uses coconut shell charcoal to produce Graphene. N-Graphene is produced by the method of nitrogen dopant. XRD data indicate a change in the position of the diffraction peaks (Graphene with 2θ = 24.03o and 44.6o and N-Graphene 2θ= 26.11o), meaning that there is interaction with the nitrogen atoms of carbon. The presence of N atoms in the N-Graphene is shown by the data of the EDX, which is 0.49% of atoms, and at the peak of wave number 1396 cm-1 shows the interaction between C-N. Graphene by BET analysis results show the surface area of Graphene 1140.2 m2/g with pore volume and pore size is 0.06144 cc/g and 1.072 nm respectively. Determination of the energy gap by measuring the resistance R of semiconductor materials at various temperatures. The resistivity and conductivity affected by temperature, the higher the temperature, the smaller the resistivity whereas the greater conductivity. Graph ln σ versus 1/T is a linear curve with a slope for each b = 915.22, b = 1529, b = 2515.1 which is the value of Eg/(2kB) because it obtained Eg value of 0.15 eV, 0.26 eV , 0.43 eV. From the characterization showed that the results of N-Graphene coconut shell-based has generated.
KEYWORDS:Adsorption; Coconut Shell; Electrode; Graphene; N-Graphene
Download this article as:| Copy the following to cite this article: Supeno M, Pratama A and Purba R. H. Adsorption of N-Graphene from Coconut Shell. Orient J Chem 2020;36(2). |
| Copy the following to cite this URL: Supeno M, Pratama A and Purba R. H. Adsorption of N-Graphene from Coconut Shell. Orient J Chem 2020;36(2). Available from: https://bit.ly/2xrdz6p |
Introduction
Synthesis of graphene generally uses graphite as base material. The use of graphite as a basis for making graphene can be replaced with other materials containing high carbon, coconut shell one. Indonesia as a tropical country with a spread palm plant had almost the whole country, the production of coconut so abundant will require a blinking shell waste treatment in order to have economic value. Therefore, through this study used coconut shell as a carbon source in synthesizing graphene. Graphene be very interesting to study because it has electrical properties, thermal and mechanical outstanding 1. However Graphene does not have an energy gap so it is difficult to be applied as a semiconductor material and electrodes in batteries. Graphene can be modified by using nitrogen (N-doped carbon) for use in a primary battery electrode non-metallic 2. Synthesis of N-dopant Graphene can be done by: i) in-situ doped and ii) after treatment dopant. Dopant in-situ is synthesized through direct incorporation between N-C with combustion technique at high temperatures 3. Graphene without metal, has low catalyst activity. So it must be modified by decorating Graphene structure (N-doping Graphene). Nitrogen dopant into Graphene will modulate the properties of Graphene, the presence of ammonia as a nitrogen source, so as to improve the electronic activity of Graphene 4 .
This happens because the N-Graphene will add value to the electrical conductivity of Graphene. One way to determine the electrical properties is through the measurement of the value of the energy gap. Some research showed that Graphene is a semi-metal material that has a small energy gap, ranging from 0-0.34 eV 5. Results of these materials has been done to improve the conductivity of higher energy and greater capacity.
In this research, the characterization of N-Graphene from coconut shell aims to determine the energy gap value of the N-Graphene from the heating process by temperature variation. N-Graphene is synthesized aims to determine the electrical conductivity and a wide energy gap N-Graphene.
Materials and Methods
Materials and Instrumentations
Graphene powder from coconut shell, aquadest, ammonia, activated carbon.
FT-IR analysis using a Shimadzu IR Prestige-21. The surface morphology was determined by EPOMH 10 ZSS EDX SEM. The crystalline structure was determined by XRD Model Rigaku D/max 2500. BET instrumentation ModelMicromeritics Gemini 2375
Methods
Manufacturing Charcoal from Coconut Shell
Coconut shell is dried in the sun to dry. 1 kg of coconut shell is pyrolized inside the furnace in an oxygen-free state for 5 hours at 600oC to be charcoal, characterized by the absence of smoke. Charcoal is cooled and pulverized using a mortar. Sieved using a 100 mesh sieve. Charcoal powder is characterized by XRD and SEM-EDX.
Synthesis of Graphene
Charcoal from coconut shell was formed into chip shape, then 15 g is mixed with powder activated carbon. The mixture was furnaced at 600oC for 1 hour. Sieved using a 150 mesh size sieve to separate the coconut shell and activated carbon. The charcoal from coconut shells were washed with distilled water to clean and dried at 70oC. Graphene powder is characterized by XRD, FT-IR, SEM-EDX, BET.
Synthesis of N-Graphene
1 g graphene was stirred by 100 mL of distilled waterfor 1 hour. Then, the mixture was added 10 mL ammonia 10 M and stirred for 72 hours. The mixture was filtered and dried at 80oC for 24 hours. Then characterized using XRD, FT-IR and SEM-EDX 6.
Heating Process
In the heating process, 10 g graphene was heated at 150oC, 200oC, and 300oC. In hot condition, graphene waspoured into 50 mL ammonia 10 M and then filtered by using filter paper. The mixture was dried in the oven at 80oC.
Measuring Resistance at Various Temperatures
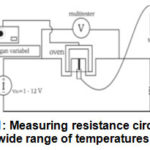 |
Figure 1: Measuring resistance circuit for a wide range of temperatures 7 |
AC current source, voltmeter and ammeter were suited as figure above. Inputvoltage (Vin) was setted 1.5 volts, the length of the semiconductor 1.2 x 10⁻² m to the surface area of 2.46 x 10⁻⁷ m2. Temperature observations began at room temperature and then started using the heater. Observations were made for an interval temperature of at least 5oC. So that the resistance can be calculated using the formula R = V/I. The conductivity of semiconductors can be determined at any temperature T to determine the resistance R. So the known value of conductivity is a measure of the ability of a material to deliver electric current and formulated with the equation:
![]()
Where :
σ = conductivity (1 / Ωm)
ρ = resistivity (Ωm)
L = Length of material (m)
I = Electric Current (Amperes)
A = Surface material (m2)
V = Voltage (volts)
R = Resistance (Ω)
The value of conductivity on the semiconductor material is a function of temperature and can be expressed in exponential function exp (-Eg / (2kBT):
![]()
with σo is a constant of proportionality. Capturing the natural logarithm value both sides of the equation 2, provides:
![]()
σ0 = 2.17391 / Ω𝑚, 𝑘 = 0.00008617 𝑒𝑉 / 𝑘
And to compare the value of the energy gap graph of conductivity against temperature graph, by using the equation:
𝑦 = 𝑎𝑥 + 𝑏
𝑏 = -𝐸𝑔 2𝑘𝑇
𝐸𝑔𝑔𝑟𝑎𝑓𝑖𝑘 = -𝑏. 2𝑘𝑇 (4)
Measurement of conductivity at various temperatures will produce a graph ln σ versus 1/T. Eg energy gap width can be determined from the slope of the graph. All common energy gap semiconductor material ranges from 0.2 eV to 2.5 eV 7.
Characterization Results Reaction
The crystal structure analysis by XRD
X-ray diffraction analysis (XRD) was conducted to determine the crystalline structure of charcoal, graphene and N-Graphene by using X-ray diffractometer Rigaku D / max 2500. Cu-Kα radiation is used (λ = 0154 nm) to observe samples from 5o to 30o with a scan speed of 2o min-1, the voltage is 40kV and the current is 200 mA. Data obtained using the software MDI / JADE6 package attached to a Rigaku XRD instrument.
Analysis of Functional Groups FT-IR
FT-IR analysis to determine the functional groups contained in Graphene, N-Graphene reduced NH3 10 M. Samples are prepared in liquid (colloidal suspension), and then the sample is dripped in between two KBr plates to create a thin film. Then the plate is placed on the sample point to be passed by infra red rays. FT-IR analysis using a Shimadzu IR Prestige-21 carried on the wave number range of 450-4500 cm-1
Analysis of scanning electron microscope SEM-EDX
SEM-EDX analysis is designed to observe the microscopic structures on the surface of the material. SEM consists of an electron gun which produces an electron beam at an accelerated voltage of 2-30 kV. The electron beam produces an image size of <10 nm in the samples is shown in the form of photographic film into the tube screen 8.
Analysis of Surface Area and Pore using the Brunauer Emmet Teller (BET)
BET analyzer for surface area and porosity are very important in a variety of materials. The method to determine the surface area through two stages: operation without the sample and with the sample. Determination of adsorption and desorption isotherms is a very important variable for determining pore structure and determine the total surface area of operations without the sample is empty burette operation to achieve saturation.
Results and Discussion
XRD Analysis
The XRD spectra of charcoal, graphene and N-Graphene can be seen below:
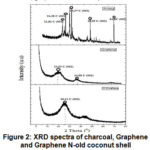 |
Figure 2: XRD spectra of charcoal, Graphene and Graphene N-old coconut shell |
At XRD analysis showed a sharp peak and tight in several regions 2θstarting from diffraction angles 21.8o, 24.3o, 29.37o, 45.1o,64,8o showed that the phase of charcoal is crystalline. Then, the carbon will tend to develop into graphite 9. Appeared two peaks of the resulting diffraction pattern illustrates that the graphenehas formed that has diffraction peaks at 24o and there are not too sharp peak at 2θ= 44.6o, Graphene nano-sized and stacked on the interlayer of Graphene. In the N-Graphene shows the peaks are at 26.11o corresponding diffraction line C (002). The results showed thatgraphene dominated in doping N of ammonia into graphene.
FT-IR Analysis The results of FT-IR characterization to identify the functional groups contained in the N-Graphene and Graphene.
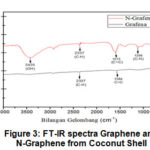 |
Figure 3: FT-IR spectra Graphene and N-Graphene from Coconut Shell |
The results of the analysis in Figure 3 showed that the FTIR spectra graphene have functional groups C-H, and C=C. While the N-Graphene, a nitrogen atom replaces a carbon atom in which the peaks at 3435, 2337, 1573 and 1396 cm-1 corresponds to the O-H bond, C-H, C=C and C-N.
Analysis of SEM-EDX
SEM-EDX of Charcoal
Results of analysis of surface morphology by Scanning Electron Microscope (SEM) with a magnification of 100 times, 1000 times and 4000 times in Fig. 3 and the EDX in Fig. 4
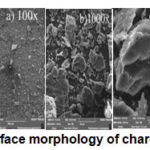 |
Figure 4: Surface morphology of charcoal by SEM |
The surface morphology of charcoal from coconut shellat a magnification of 100 times and 1000 times showing the surface of a thick and tight. As well as 4000 times magnification shaped pile of charcoal powder has a layered structure.
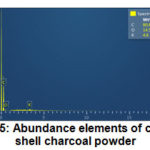 |
Figure 5: Abundance elements of coconut shell charcoal powder |
SEM-EDX of Graphene
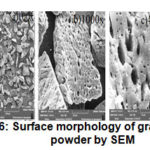 |
Figure 6: Surface morphology of graphene powder by SEM |
Surface morphology at 100 times magnification showed irregular surfaces and at 1000 times showed there are still more subtle buildup and surface are not the same. And at magnifications of 4000 times is no buildup of finer and the surface is not the same.
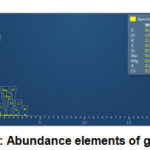 |
Figure 7: Abundance elements of graphene |
SEM-EDX of N-Graphene
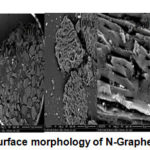 |
Figure 8: Surface morphology of N-Graphene by SEM |
Surface morphology N-Graphene at a magnification of 100 times, the surface wrinkled and irregular. At a magnification of 1000 times and 4000 times, the visible particles are arranged with a pile of disorganized that the less the aggregate are arranged to form a thin layer and small due to flaking of the structure and form a single layer.
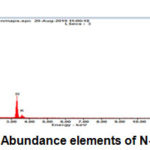 |
Figure 9: Abundance elements of N-Graphene |
Analysis of Isotherms Adsorption and Desorption N-Graphene Powder
To measure the mesoporous material graphene porosity and pore size distribution so that is carried out adsorption-desorption of the nitrogen isotherms. Adsorption-desorption curve graph of N-graphene powder with BJH method can be seen on the following figure:
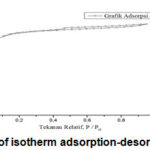 |
Figure 10: Graph of isotherm adsorption-desorption N-Graphene |
From the image above showed that adsorption isotherm type VI in accordance with IUPAC classification. Graphene’s surface is not uniform resulting type VI is a characteristic two-dimensional solids were very homogeneous and non-porous. To determine the pore size distribution graph adsorption and surface area used method of Barret-Joyner-Halenda (BJH) and can be seen below:
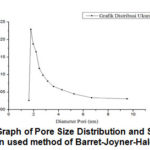 |
Figure 11: Graph of Pore Size Distribution and Surface Area Distribution used method of Barret-Joyner-Halenda (BJH) |
Graphene from coconut shell charcoal adsorbs nitrogen gas to the sample surface at low pressure. Further gas pressure will form the multilayer. Pores in Graphene will adsorb nitrogen gas.Adsorption pore size distribution graphs are dominant on the diameter of 1.83 nm which is microporous. Results of analysis of adsorption-desorption nitrogen gas graphene powder by BJH method produces surface area and pore size whisch is showed at the table 1:
Table 1: Results Analysis of Graphene Adsorption-Desorption
|
Parameter |
Value |
|
Surface area |
1140.2 m2/g |
|
Pore volume |
0.06114 cc/g |
|
Pore size |
1.072 nm |
Based on the table, obtained graphene pore size is 1.072 nm so classified in the size of the micropores.
Energy Gap Analysis
By measuring the resistance and conductivity can be known energy gap semiconductor materials. The following graph lnσ and 1/T N-Graphene against various temperature can be seen in the following figure:
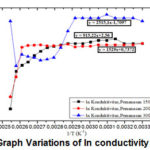 |
Figure 12: Graph Variations of ln conductivity against 1/T |
Ln graph σ versus 1/T is a linear curve with a slope of heating at 150oC, 200oC, 300oC which the valueof Eg/(2kB) are b = 915.22, b = 1529, b = 2515.1. In this experiment the values of energy gap obtained 0.15 eV, 0.26 eV, 0.43 eV. From the temperature variations that have been tested, obtained the best energy gap of 0.43 eV at a temperature of 300oC. With the higher temperature, resistivity smaller and greater conductivity, so energy gap generated is directly proportional 10.
Conclusion
Based on the results of research conducted can be summarized as follows
Preparation of N-Graphene from coconut shell charcoal be done by synthesizing graphene modified by conventional methods followed by nitrogen dopant to Graphene by using ammonia to produce N-Graphene. The success is evidenced by the data synthesis XRD, FT-IR and SEM-EDX.
Analysis of energy gap material N-Graphene at the various temperatures obtained energy gap 0.15 eV, 0.26 eV, 0.43 eV. Retrieved best energy gap is 0.43 eV at a 300oC. With the higher temperature, resistivity smaller and greater conductivity, so energy gap generated is directly proportional.
References
- Zhang, T., Xue, Q., Zhang, S., & Dong, M., Theoretical approaches to graphene and graphene-based materials. Nano Today., , 7(3), 180–200.
- Stein, A., Wang, Z., & Fierke, M. A., Functionalization of Porous Carbon Materials with Designed Pore Architecture. Advanced Materials.,, 21(3), 265–293.
- Sun, L., Wang, C., Zhou, Y., Zhang, X., Cai, B., & Qiu, J., Flowing nitrogen assisted-arc discharge synthesis of nitrogen-doped single-walled carbon nanohorns. Applied Surface Science.,, 277, 88–93.
- Nakamura, J., Siburian, R., & Kondo, T., Size Control to a Sub-Nanometer Scale in Platinum Catalysts on Graphene.The Journal of Physical Chemistry., 2013., 117(7), 3635–3645.
- Safitri, D., Susanti, D., Nurdiansyah, H., Analysis of Effect of Nitrogen Doping Against Nature Made Capacitive Graphene supercapacitor. ITS Engineering Journal, 2017., 6 (1)., 2337-3539.
- Siburian, R., Support Material Effect for Pt Catalytic Activity at Cathode., International Research Journal of Pure and Applied Chemistry., 2014., 4., 541-550.
- Bilya, M.A., Sani, M.H., Determination of the Band-Gap of a Semiconductor: Germanium Chip Using Four Probe Set-Up. International Journal of Science and Research., 2016., 5 (2)., 1137-1140.
- Tucker, M., 1988. Techniques in sedimentology. Blackwell Scientific Publications. Oxford / London. England.
- Liyanage, C., & Pieris, M., A Physico-Chemical Analysis of Coconut Shell Powder. Procedia Chemistry. 2015., 16., 222-228.
- Paek, E., Pak, A., Kweon, K., & Hwang, G.,. On the Origin of the Enhanced Supercapacitor Performance of Nitrogen-Doped Graphene. The Journal of Physical Chemistry C. 2013., 117. 5610-5616.

This work is licensed under a Creative Commons Attribution 4.0 International License.
About The Author
![]()
A New Edition of Web of Science
Journal Impact Factor
2022: 0.5
Five Year: 0.8
Journal is Indexed in

Cabells Whitelist
![]()


