Study of Isolation, Characterisation and Antimicrobial Activity of High Value Bioactive Compounds from Methanolic Extract of Leaves of Tilkor (Momordica Monadelpha)
Panshu Pratik and Prem Mohan Mishra
Department of Chemistry, M.L.S.M. College, L.N.M.U., Darbhanga, India.
Corresponding Author E-mail: mishrapm6@gmail.com
DOI : http://dx.doi.org/10.13005/ojc/340662
Article Received on : 09-10-2018
Article Accepted on : 12-12-2018
Article Published : 17 Dec 2018
In this paper an attempt has been made to highlight the physicochemical study of methnolic extract of leaves of Tilkor carried out by soxhlet extraction process, phytochemical analysis of the extract, separations, isolation of bioactive components through Thin Layer Chromatography (TLC) as well as column chromatography respectively and characterisation of isolated compound by the means of several spectral analysis such as 1H NMR, 13C NMR, IR, U.V. Mass spectroscopy. The methanolic extract of leaves of the plant (in tropical conditions of Mithilanchal, Bihar, India) reveal the presence of phytochemicals like alkaloids, flavanoids, tannins, saponins, cardiac glycosides, steroids, terpenoids etc. The secondary metaboilities showed antimicrobial activity. The two isolated compounds were characterised by spectroscopic techniques which revealed the structure of compound A as - stigmosterol and compound B as tritriaconatane and is also found to have antimicrobial activity.
KEYWORDS:Antimicrobial Study Etc; Characterisation; Isolation; Momordica Monadelpha; Phytochemical Analysis; Physicochemical Analysis; Stigmosterol; Tilkor; Tritriaconatane
Download this article as:| Copy the following to cite this article: Pratik P, Mishra P. M. Study of Isolation, Characterisation and Antimicrobial Activity of High Value Bioactive Compounds from Methanolic Extract of Leaves of Tilkor (Momordica Monadelpha). Orient J Chem 2018;34(6). |
| Copy the following to cite this URL: Pratik P, Mishra P. M. Study of Isolation, Characterisation and Antimicrobial Activity of High Value Bioactive Compounds from Methanolic Extract of Leaves of Tilkor (Momordica Monadelpha). Orient J Chem 2018;34(6). Available from: http://www.orientjchem.org/?p=53948 |
Introduction
Dependence on plants for the essential such as food, clothes & shelter has been of paramount importance in Man’s life since the human race began. And a time came when people learnt to use plants to cure diseases and relieve physical suffering. After that some plants were appreciated for the herbal treatment as well as major source of new medicine.1 These are called medicinal plants. Further various investigation have been carried out to identify and characterise the high value bioactive components present in medicinal plants.2-7
Monoradica monadelpha (Tilkor) is well known plant of Mithilanchal, Bihar (India) having high nutritive and medicinal value. In Mithila it is used for making several dishes. It grows in all parts of India, Tropical Australia, Fiji and throughout the oriental countries. All parts of this plant posses specific medicinal importance and therefore it must contain various high value bioactive components. Its leaves is considered to have antidiabatic character and its paste used in treatment of skin diseases, osteoarthritis and joint paints. Fruit is used for the treatment of liver problem and are anti anaphylactic. Flowers are good anti oxidant, stems are anti-hyperglycemic agent and roots are used as health tonic.
So Its chemical standarisation seems essential to identify the chemical constituents. The present Investigation was therefore taken up for the physico- chemical study of the methenolic extract of the leaves of this region, their phytochemical analysis, isolation of the components present using T.L.C. & column chromatography and their characterization using various spectroscopic method and study of antimicrobial activities.
Materials and Methods
Chemicals and Instruments
All Analytical grade solvents and chemicals were used without any purification (Methanol, Silica gel, Calcium sulphate, n- hexane, chloroform, ethyl acetate, petroleum ether, acetone, ethanol, Trimethyl silliane, Argon, D2O, Liquid Na, Chromium (III), acetyl acetone). A soxhelt Extractor is used for the extraction of plant material and separation of its components as well as their isolation were carried out by thin layer chromatography and column chromatography respectively. IR, UV, Mass, 1H NMR and 13C NMR Spectrometer were used for the characterization of chemical constitutents.
Plant Material
The leaves of plant momoradica monadelpha [Tilkor] were collected from medicinal plant garden of Shri Himanshu Shekhar Mallik (at Jale ) 40 km away from district Darbhanga, Bihar, India.
The leaves are authentified by the experts i) Professor Shashi Shekhar Narayan Sinha [International Scientist, Radiation Genetics, Eminent Botanist and Ex.H.O.D.BotanyBRABiharUniversity,] ii) Professor (Dr.) Sunil Kumar [Principal, Mahendra. AyurvedaCollege Tulsipur, Daug, Nepal.]
Preparation of Plant Extract (Soxhlet Extraction)
Fresh leaves of Tilkor [Momoradica monadelpha] were washed with distilled water. Then it was fully air dried and after it shade dried at room temperature. The dried leaves was then cut and grinded till it get powdered finely.
Now the powdered leaves were then subjected to Soxhlet extractor [914/7] with methanol for continuous hot extraction to get the methanolic extract of the leaves.
Determination of Physico Chemical Parameter
Determination of Physico chemical Parameter such as water and alcohol soluble extractive value, total ash content, acid insoluble ash content, moisture content etc. were determined as per guideline given by WHO.8
Phyto Chemical Screening
Preliminary Qualitative and quantative Phyto Chemical Screening for the presence of various Phyto chemicals such as alkaloid, glycoside, phenol flavanoid, saponins, tannins, reducing sugar etc. was carried out by the separated protocol.9-11
Separation and Isolation
Separation of components from the obtained extract of plant materials were done by “Thin layer Chromatography” (T.L.C.) and isolation of components was done by column chromotography. T.L.C. was performed on a glass plate of silica gel. This layer of absorbent used as stationary phase and solvent used is known as mobile phase.
Characterization
The isolated components have been characterised by several spectral analysis viz – UV, IR, Mass, 1H NMR and 13C NMR spectroscopy.
Antimicrobial Assay
Antimicrobial activity in Methanolic extract of plant sample was determined by agar well diffusion method (NCCL B, 1995). For the growth of bacterial strain natural agar was used while potato dextrose agar was used for the growth of fungi. In the process, plant extract disolved in DMSO at concentration of 15, 30, 60, 120 mg/ml.
The reference antibiotic 25 mg/ml concentrated solution of cephaximin were prepared for each bacterial & fungal strain.
Experimental
Physicochemical Parameter
Calibrated digital pH meter was used to determine the pH of 5% and 20% methanolic extract through standard method.14-15 Rest all the parameters are being calculated by standard method.
Phytochemical Screening
Phytochemical screening of the plant sample was done by the means of standard experimental tests.12
Extraction
The methanolic extract of fine by powdered dried leaf of Tilkor was prepared by soxhlet extractor using methanol as solvent (by standard method).
Separation and Isolation: Thin Layer Chromatography (TLC) and Column Chromatography
Methnolic plant extract was taken in a beaker (250 mL) and stirred well for 5 hours. Then the solution was filtered and evaporated using Rotory Evaporator. The residue was dissolved in 10 mL of methanol and the extract(10 μl) was spotted on TLC plate and the colour of spots were recorded. Silica gel – GF 024 391 was used as absorbent. T.L.C. fingerprint profile was developed by using methanol. The column was then eluted successfully with n – hexane and chloroform respectively through column chromatography and hence component were isolated.
Characterisation
Characterisation of isolated compound was done by using following spectroscopic techniques
U.V. Spectroscopy of sample was done by integrating an optical microscope with U.V. optics, monochromator, white light sources and a sensitive detector.
I R spectrum of sample was recorded by passing a beam of infrared light. The amount of light absorbed at each frequency or wave length was measured by the examination of the transmitted light.
The mass fragmentation of the sample was examined by a mass analyzer and detector. The value of indicator quantity was measured by detector and thus provides the necessary data for the calculation of each quantity present.
1H NMR spectra of sample was recorded in methanol solution and D2O solvent. TMS was used as reference and chemical shift value for different H – atom was determined.
1 ml plant sample was taken in longer sample tubes (10 nm long in diameter) under high field magnets. Chromium (III) acetyl acetone was taken as relaxation agent and 13C NMR spectrum of sample was recorded.
Pharmacological Activity
Anitmicrobial Assay
The pure culture of pathogenic bacteria & fungi were obtained from department of Microbiology, Darbhanga Medical College & Hospital.
Viz. aggregate bactor actinomycet emcouitians ATCC (12745), Staphylococcus aureas ATCC(10835), Prevotella intermedia [ATCC (225)], Shigella shigella [ATCC (94295)] and Porphyromonas giugiralis ATCC [33658] organism were tested on slant of medium containing 3 mg of nutrient agar / 150 ml. The slant were incubated at temp. 450C for 37 hour and were stored at 50C. The inoculum adjusted at 500 μm leading to transmission equivalent to 1 x 10 cell /m. The plant dissolved in DMSO and reference antibiotic cephaxium was prepared. Each plate was incubated with 20μ/ml microbial suspension having concentration of 1 x 10⁸ cells. The organisms were tested.
Results and Discussion
Result
The Physico-chemical analysis’s of sample of leaves of Momoradica Monadelpha is given in table no.1.
Table 1: Results of various physicochemical parameters of sample of leaves of plant.
| Parameter | Result |
| pH of 5% solution of Methanolic plant extract | 7.27 |
| pH of 20% solution of Methanolic plant extract | 6.95 |
| Moisture content | 1.23% |
| Total ash | 11.71% of dry wt. |
| Acid insoluble ash | 1.05% of total ash |
| Water soluble ash | 4.95% of total ash |
| Water soluble extractive | 6.70% of dry wt. |
| Alcohol soluble extractive | 7.5% of dry wt. |
Phytochemical Screening
Phytochemical screening of methanolic extract of leaf of the plant is given in table no. 2.
Table 2: Results of various phytochemical parameters of sample of leaves of plant.
| Phytochemicals | Test’s Name | Result |
| Alkaloid | Wagner’s Test | +++ |
| Saponins | Foam Test | ++ |
| Tannin | Lead acetate Test | ++ |
| Steroids | Liebermann-burchard’s test | ++ |
| Cardiac glycoside | Legal Test | + |
| Terpenoid | Salkowski test | ++ |
| Flavonoids | 1. Shinoda test2. Alkaline Reagent Test | ++++++ |
Thin Layer Chromatography (TLC) and Column Chromatography
TLC finger print profile was developed by using methanol chloroform & n – hexane solvent in the ratio 0.5:3:4.5 (v/v/v). Six spots were observed (Fig.1) under UV (of 366nm) light when visualized by using vanillin sulphuric acid. Out of the six, two compounds were isolated successfully through the elution with n – hexane and chloroform through column chromatography and were named as compound (A) & compound (B) respectively.
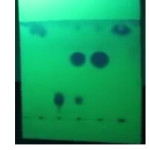 |
Figure 1:T.L.C. of sample. |
Spectroscopic Analysis (characterisation) of compound A
Mass Spectroscopy
Mass spectrum of compound A showed parent molecular ion [M+] peak at m/z 412 which corresponds to molecular formulae C29H48O.
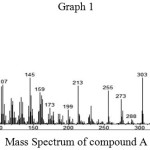 |
Graph 1 |
U.V. Spectroscopy
In U.V. spectral analysis max value of compound A was 255μm
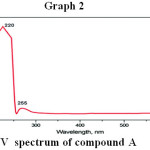 |
Graph 2 |
I R Spectroscopy
The observed absorption bands of compound A on subjection to IR spectroscopic analysis are given in the table no. 3.
Table 3: IR Spectral Data of compound A.
| S. No. | Observed absorption bands in cm-1 | Inference |
| 1. | 3545.38 cm-1 | – OH stretching |
| 2. | 3228.68 cm-1 | Cyclic olefinic – HC = CH – |
| 3. | 3023 cm-1 | = CH – |
| 4. | 2852.73 cm-1 | C – H |
| 5. | 1635.81 cm-1 | C = C |
| 6. | 1460 cm-1 | Cyclic (CH2) |
| 7. | 1378 cm-1 | – CH3 |
| 8. | 1070.26 cm-1 | Cycloalkane |
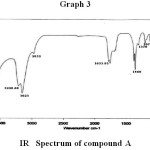 |
Graph 3 |
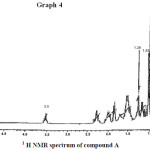
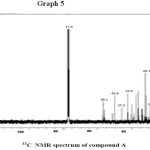
1H NMR & 13C NMR spectroscopy : 1H and 13C NMR chemical shift value for compound A are recorded in CDCl3 on the pairs of COSY, HMQC and HNBC correlations [chemical shift values are in (ppm) and computing constants are in Hz] are given in table no. 4.
Table 4: 1H NMR & 13C NMR spectral data of Compound A.
|
Position |
1H |
13C |
Nature of carbon |
| C1 | 37.2 |
CH2 |
|
| C2 | 31.5 |
CH2 |
|
| C3 | 3.50(+dd, 1H, J = 4.0, 39Hz) | 71.5 |
CH |
| C4 | 42.3 |
CH2 |
|
| C5 | 5.34 (+, 1H, J=6.4 Hz) | 140.5 |
C=C |
| C6 | 5.38 (S, 1H) | 121.5 |
C=CH |
| C7 | 32.0 |
CH2 |
|
| C8 | 32.2 |
CH |
|
| C9 | 50.1 |
CH |
|
| C10 | 36.5 |
C |
|
| C11 | 21.2 |
CH2 |
|
| C12 | 39.5 |
CH2 |
|
| C13 | 42.3 |
C |
|
| C14 | 56.5 |
CH |
|
| C15 | 26.1 |
CH2 |
|
| C16 | 28.3 |
CH2 |
|
| C17 | 56.0 |
CH |
|
| C18 | 1.29 (d,3H) | 36.1 |
CH3 |
| C19 | 0.91 (d, 3H, J = 6.1 Hz) | 19.0 |
CH3 |
| C20 | 33.9 |
CH |
|
| C21 | 1.21 (d(3H)) | 26.1 |
CH3 |
| C22 | 5.08 (m,1H) | 45.9 |
C=C |
| C23 | 5.21 (m,1H) | 23.1 |
C=C |
| C24 | 0.81 (+, 3H J = 7.1Hz) | 12.0 |
CH |
| C25 | 29.1 |
CH |
|
| C26 | 0.81 (d 3H = 6.5 Hz) | 19.9 |
CH3 |
| C27 | 0.82 (d, 3H J = 6.5 Hz) | 19.2 |
CH3 |
| C28 | 0.65 (S, 3H) | 18.9 |
CH2 |
| C29 | 1.02 (S, 3H) | 12.2 |
CH3 |
 |
Graph 4 |
 |
Graph 5 |
Spectroscopic Analysis (Characterisation) of compound B
UV Spectroscopy
In v.v. spectroscopy the max value of compound (B) is found to be negligible i.e. it showed no absorption.
Mass Spectroscopy
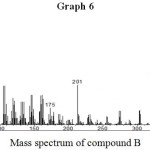
Mass spectrum of compound B showed parent molecular ion [M+] peak at m/z 464 which corresponds to the molecular formulae C33H68.
m/z relative intensity are 435 (12,93), 414(11,98) 444(33,72), 408 (22,96), 38(82,03), 352 (100), 330 (53,29), 201(31,33), 175 (18,35) (Graph No. 6).
 |
Graph 6 |
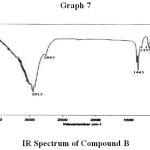
IR. Spectroscopy
The absorbed absorption band of compound (B) upon subjection to IR spectrometer are given IR (KBR) vmax (cm-1) : 720 cm-1, 802 cm-1, 865 cm-1, 1025 cm-1, 1095 cm-1, 1260 cm-1, 1375 cm-1, 1465 cm-1, 2845 cm-1, 2915 cm-1 (Graph No. – 7).
 |
Graph 7 |
1H NMR Spectroscopy
1H NMR spectroscopic analysis of compound (B) is as.
Table 5: 1H NMR spectral data of compound B.
| Sl. No. | 1H NMR (, CDCl3) | Nature of carbon |
| 1. | 1.11 – 1.38 (62H, br, 31 X) | – CH2 – |
| 2. | 0.81 (6H, + , J 7.4 Hz, 2X) | – CH3 – |
Pharmacological Activity
Table 6: Antimicrobial Activity / Assay of leaves extract of plant.
|
Sl. No. |
Organism |
Zone of inhibition (nm) in Conc. mg/ml |
Refrence antibiotic |
|||
|
15.0 |
30.0 |
60.0 |
120.0 |
20 /ml |
||
| 1. | aggregatibacter actinomycetemcomitans |
— |
—- |
— |
9.5 |
14.0 |
| 2. | Staphylococcus aureus |
—- |
—- |
8.2 |
10.3 |
15.0 |
| 3. | Prevotella intermedia |
—- |
—- |
—- |
8.1 |
10.0 |
| 4. | Shigella shigella |
— |
—- |
—- |
8.2 |
11.0 |
| 5. | Porphyromonas gingivalis |
—- |
—- |
13.2 |
15.3 |
13.0 |
The pictures of incubated palates and micro-organism are given (Fig – 2)
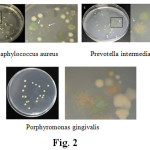 |
Figure 2 |
Discussion
Results obtain from of Physico – chemical studies of leave sample of plant to determine the moisture content total ash, acid insoluble ash, water soluble ash water soluble extractives and alcohol soluble extractives along with pH of 5% & 20% solution of methanolic extract of plant leaves were given in Table no. – 1. The pH of 5% solution is greater (7.27) in comparison to pH of 20% solution (6.95). However the % of water soluble ash is greater (4.95) in comparision to acid insoluble ash (1.05%). Among water and alcohol soluble extractives alcohol soluble extractive is greater (75%) than water soluble extractive (6.70%) Phytochemical screening of plant extract carried out with the help of several chemical tests to determine the phytochemicals present in the extract, shows the presence of alkaloids saponins tannins, steroid, cardiac glycosides, terpenoids and flavonoids. Out of which alkaloids and flavonoid showed higher degree of precipitation (+++), saponins, tannins, steroid & Terpenoid showed moderate degree of precipitation (++) and cardiac glycoside showed lesser degree of precipitation (+)
Separation & isolation of the plant extract using thin layer chromatography by described method and visualised under U.V. showed six spots out of which two are successfully eluted by n –hexane and chloroform and isolated through column chromatography which are named as compound (A) & (B) and are subjected to several spectroscopic analysis for their characterisation.
Compound (A) was also isolated as white powder whose mass spectral data. Corresponds to its molecular formulae C29H50O
UV band λ max = 25.5 nm revels the – OH chromophoric group. As it give positive test for steroid, so compound must containing sterol nucleus. The IR absorption bands observed at 35A (5.38 cm-1) that is characteristics of – OH stretching, 3228.68 cm-1 (cyclic olefinic – CH = CH3) 3023 cm-1 ( = CH – ), 2852.73 cm-1(C – H), 1635.81 cm-1 (C=C), 1460cm-1 cyclic (CH2), 1378 cm-1 (CH3) and 1070.26 cm-1(cycloalkane).
The 1H NMR showed the proton of H – 3 shows multiplet at 3.50 and indicates the existence of signals for olefinic proton at 5.38, 5.08, 5.21 & 5.34. The angular methyl proton at 1.29 & 0.91 correspondence to G8 & C19.
13C NMR at 140.5 & 121.5 which are assigned C5 & C6 double bonds respectively. It shows value at 19.0, 33.9 & 26.1. For C19 , C20 & C26 corresponds to angular carbon. Four alkenes carbon were appeared at 140.5 , 121.5, 45.9 & 23.1 spectra showed twenty nine carbon signal including six methyl, nine methylenes, 11 methanes and three quaternary carbon.
The spectroscopic data corresponds to the structure of compound A as.
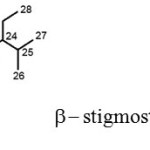 |
Scheme 1 |
Compound (B) was isolated as waxy solid mpt(710C). From IR absorption band data the functional group such as CO & OH are absent. As it showed no absorption in UV spectrum hence the compound is fully saturated.
The mass spectroscopy of compound at 464 corresponds to molecular formula C33H68. The 1H NMR spectral data of compound showed a triplet at 0.81 integrating to 6 proton which may be two (CH3) at terminals. A multiplate was observed at 1.11 – 1.38 corresponds 62 proton which represent 31 (CH2) methylene. On the basis of these spectral data the structure of compound (B) is
![]()
Tritriacontane Compound (B)
Antimicrobial assay of methanolic extract of leaves of the plant exhibit higher antimicrobial activities at 120 mg/ml conc. extract against p. gingiralis (15.3 nm) as compared to reference antibiotic. Antimicrobial activities against other test organism is very less in comparision to reference antibiotic.
Conclusion
The methanolic extract of leave of the plant (in tropical conditions of Mithilanchal, Bihar, India) reveal the presence of phytochemicals like alkaloids, flavonoids, tannins, saponins, cardiac glycosides, steroids, terpenoids etc.
The secondary metabolites shows pharmacological activity such as Antimicrobial.
The two isolated compounds were characterised by spectroscopic techniques which revealed the structure of compound A as – stigmosterol and compound B as Tritriacontane
Acknowledgments
Authors are thankful to Sri Himanshu Shekhar Malik for providing the plant sample,
Dr. Sunil Kumar and Prof. S.S.N. Sinha for identification of plant leaves, Honourable Vice Chanceller, RajendraAgricultureUniversity, Pusa, Samastipur and PrincipalMLSMCollege, LalitNarayanMithilaUniversity, Darbhanga for providing necessary equipments required for my study.
References
- WHO, general guidelines for methodology on research and evaluation of traditional medicines. HO/EDM/TRM/2000. I Geneva 2000.74.
- Lee K. W., Molecular targets of phytochemicals for cancer prevention. Nat Rev. Cancer. 2011, 11 (3): 211 – 8. doi: 10.1038/nrc3017.
CrossRef - Kumar G.P.; Khanum, F., Nuro protective potential of phytochemicals. Pharmacogn Rev., 2012, 6 (12) : 81-90. doi : 10.4103/0973-7847.99898.
CrossRef - Chaudhary N; Sekhon BS. An overview of advance in standardization of herbal drugs. Journal of Pharmaceutical Education and Research 2011, 2(2) 55 – 70.
- Shinde V.M.; Dhalwal K.; Potdar M.; Mahadik K.R., Application of quality control principles to herbal drugs. International Journal of Phytomedicine. 2009., 1, 4–8.
CrossRef - Mukherjee P.K., Quality control of herbal Drugs, 1st Edn Bussiness Horizons Pharmaceuticals Publishers. New Delhi, 2002. 131 – 219.
- Chandrasekaran M.; Venkatesalu V. Antibacterial and antifungal activity of Syzygium jambolanum seeds. J Ethnopharmacol, 2004, 91, 105-108.
CrossRef - World Health Organisation, General guidelines for methodology medicines. World Health Organisation, Geneva 2011.
- Singleton, V.L.; Orthofer, R.; Lamuela-Raventos, R.M. Analysis of Total Phenols and Other Oxidation Substrates and Antioxidants by Means of Folin-Ciocalteu Reagent. Methods in Enzymology, 1999, 29, 152-178.
CrossRef - Horborne, J.B., Phytochemical Method. A guide to modern techniques of plant analysis. 3rd edition, Springer (India) Pvt Ltd., New Delhi, 1998,. 5-12.
- Khandelwal K.R., Practical Pharmacognosy techniques and experiments. Nirali Prakashan, Delhi, 19th Edition, Appendix 1, 2008,. 182.
- S. Sashidharan; Y. Chein; D. Saravanan; K. M. Sundaram; L. Yoga Latha, Extraction Isolation and characterisation of bioactive compounds from plant extract. African Journal of complement altern. med. 2011, 8 (1), 1 to 10.
- Justus G Kichan. Thin Layer Chromatography, 2nd Edition Willey. (1978).
- Johansen D.A., Plant – Modern Techniques. 1st Edn. (MC Graw – Hill Book company New York & London) 1940, 182 – 203.
- Harbone J.B., Methods of Extraction & isolation, In phytochemical Methods. Chapman & Hall, London 1998,. 60-66.

This work is licensed under a Creative Commons Attribution 4.0 International License.
![]()
A New Edition of Web of Science
Journal Impact Factor
2022: 0.5
Five Year: 0.8
Journal is Indexed in

Cabells Whitelist
![]()


