Quantitative Structure Activity Relationship (QSAR) Based on Electronic Descriptors and Docking Studies of Quinazoline Derivatives for Anticancer Activity
 , Bambang Purwono2 and Ria Armunanto1
1Austrian-Indonesian Centre (AIC) for Computational Chemistry, Department of Chemistry, Universitas Gadjah Mada.
2Laboratory of Organic Chemistry, Department of Chemistry, Universitas Gadjah Mada.
Corresponding Author E-mail: herlina.rasyid@mail.ugm.ac.id
DOI : http://dx.doi.org/10.13005/ojc/340517
Download this article as:
![]()
Quantitative structure-activity relationship (QSAR) based on electronic descriptors had been conducted on 2,3-dihydro-[1,4]dioxino[2,3-f]quinazoline analogues as anticancer using DFT/B3LYP method. The best QSAR equation described as follow: Log IC50 = -11.688 + (-35.522×qC6) + (-21.055×qC10) + (-85.682×qC12) + (-32.997×qO22) + (-85.129 EHOMO) + (19.724×ELUMO). Statistical value of R2 = 0.8732, rm2 = 0.7935, r2-r02/r2 = 0.0118, PRESS = 1.5727 and Fcalc/Ftable = 2.4067 used as external validation. Atomic net charge showed as the most important descriptor to predict activity and design new molecule. Following QSAR analysis, Lipinski rules was applied to filter the design compound due to physicochemical properties and resulted that all filtered compounds did not violate the rules. Docking analysis was conducted to determine interaction between proposed compounds and EGFR protein. Critical hydrogen bond was found in Met769 residue suggesting that proposed compounds could be used to inhibit EGFR protein.
KEYWORDS:Docking Molecule; Electronic Descriptor; QSAR; Quinazoline
Introduction
Cancer is a diseases which have an uncontrolled and abnormal growth. There were 1.688.780 new cancer cases diagnosed in 2017 and about 600.920 of Americans die or equally 1.650 people per day. Lung cancer was a second common cancer cases due to the high cigarette smoking activity both in men and women.1 One of protein receptor which plays an important role in the growth and survival of tumor is EGFR (Epidermal Growth Factor Receptor).2-3 EGFR is divided into three domain which are extracellular receptor domain, transmembrane region, and intracellular domain. Expression of EGFR range from 40.000 to 100.000 receptors per cell in normal cell. On the other side, some cancer will express until 2 × 10⁶ molecule EGFR per cell. This overexpression resulting more aggressive growth of cancer. One of approaches to inhibit the EGFR effect is using small molecule tyrosine kinase inhibitor. This molecule inhibitor was orally active and could be specific in EGFR protein.4
Quinazoline derivative compound had been the most extensively studied as anti-inflammatory5 and anticancer as EGFR inhibitor. Many of EGFR inhibitor from the first and second generation was derived from quinazoline core such as erlotinib,6–7 gefitinib as first generation,8-10 and afatinib as second generation of EGFR inhibitor. This type of inhibitor binding to the ATP binding site through hydrophobic interactions and formation of hydrogen bonds.11 However, EGFR inhibitor had been discovered and treated to the patient orally, some of resistance and mutation of drugs still reported.12 Gefitinib and erlotinib was reported having an oncogenic mutations, while afatinib has a limited efficacy because there is a clash with Met 790 side chain.13 This phenomenon makes researcher to develop new methods that are not time consuming and expensive to get a new compound that have a bio activity as anticancer.
Quantitative Structure Activity Relationship (QSAR) correlate the relationship between chemical structure and biological activity in mathematical equation. The advantage using QSAR technique is not require any information about binding site which describe the complexity of a biological system, this method only need specific activity of the drug such as inhibition concentration.14 Chemical structure of compound will be described as electronic descriptors such as atomic charge, HOMO and LUMO energy, dipole moment, etc. This electronic descriptors were obtained by calculation using quantum chemical method.13 Current researches focus in finding correlation between electronic descriptor and bioactivity15,16.17 study a correlation between electronic descriptor and antimalarial activity of chalcones and showing a good correlation between bond orders and atomic net charge with antimalarial activity which could be used in designing new molecules. There have been many investigations about quinazoline derivatives using 2D-QSAR18 or 3D-QSAR19 using electronic and molecular descriptors to build the QSAR model. Here, our study will be focused to examine the correlation between electronic descriptor and predicted anticancer activity of quinazoline derivatives. Furthermore, we will continue to observe interaction between newly designed compounds against EGFR protein to get explanation about molecular inhibition mechanism.
Material and Methods
Data Set
A data set comprised of 34 compounds from novel series of 2,3-dihydro-[1,4]dioxino[2,3-f]quinazoline derivatives with EGFR inhibitor activity (Table 1) was used in this study. All compounds and associated data were taken from20 to build QSAR model. All of data divided into two parts that are training set and test set data. Training set data including 29 compounds and remaining data belonging to test set data which are randomly selected until a good QSAR model was reached. Training set data was used to construct QSAR model and test set data to validate the QSAR model.
Structure Optimizing and Descriptors Calculation
Three-dimensional structure of all compounds was drawn and optimized using Gaussian 09 software package 21 supported by Gauss View 5.0.8.22 Structural energy optimization was performed using DFT/B3LYP method with 6-31G basis set of the studied molecule.23,24,25 All of electronic descriptors such as atomic net charge (C1 until O22), dipole moment, Highest Occupied Molecule Orbital (HOMO) energy, and Lowest Unoccupied Molecule Orbital (LUMO) energy were taken from data after optimizing of each compounds.
QSAR Model Development and Validation
The QSAR model was constructed using Multiple Linear Regression (MLR) backward method in SPSS program package. The linear equation had been made by setting up biological activity as dependent variable and electronic descriptors as independent variable. The QSAR model was chosen based on statistical parameters like R, R2 and PRESS. External validation of a good QSAR model was performed by using statistical parameters such as R2, rm2 , r2-r02/r2, and PRESS.26
Design new Molecules and Lipinski Rules Filter
The best QSAR model was applied to design new molecules. Then it will be chosen based on IC50 which is lower than b1 as the most active in data set. The chosen molecule will be evaluated by using Lipinski rules to obtain the molecule that is effective as drug.
Protein-Ligand Docking
Molecular docking were performed to confirm binding pose of inhibitor in active site of EGFR protein by using Autodock program with the help of Autodock Tools 27. Protein EGFR model was downloaded from PDB file (ID 1M17). Preparation of ligand and protein was done by using Chimera program.28 Redocking and docking analysis was utilized in grid maps size 40 40 40 Å with spacing 0.375 Å. Successful redocking analysis is considered to be successfull if the RMSD value less than 2 Å.29 Lamarckian Genetic Algorithm (LGA) was applied in searching the lowest energy for each docking conformations.30 The resulting conformation was analyzed to know binding energy, inhibition constant, and binding pose.
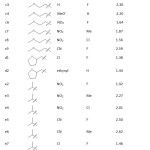 |
Table 1: Core structure and list of quinazoline derivative compounds. |
Result and Discussion
QSAR Model development and validation
There were ten QSAR models obtained from multiple linear regression by using training set data. All models were listed in Table 2. It could be seen that model A1 until model A4 did not show a good correlation (R2 < 0.6) between activity and electronic descriptors based on regression coefficient value. Therefore, only model A6 to A10 that can proceed to be validated using test set data. Statistical parameters in external validation was applied to obtain the best QSAR model. Four statistical parameters used in this validation which are regression coefficient (R2), external predictability (rm2), ratio of observed and predicted (r2-r02/r2) and PRESS. The QSAR model was considered to be valid if the conditions such as R2 higher than 0.6, rm2 more than or equal to 0.5, r2-r02/r2 lower than 0.1 and the lowest PRESS.
Table 3 showed the result of external validation of each model. It could be confirm that all models have a good external predictability based on rm2 which is higher than 0.5 and model A10 has the highest R2, lowest r2-r02/r2 and lowest PRESS indicating that this model produced a good similarity toward Log IC50 experimental. The Fcalc/Ftable of model A10 determined to be 2.4067 showed that correlation between independent and anticancer activity has the 95% significance of conviction level. Hence, model A10 was chosen as the best QSAR model and used to design new molecule that will have a better activity. The complete equation of model A10 was:
Log IC50 = -11.688 + (-35.522×qC6) + (-21.055×qC10) + (-85.682×qC12) + (-32.997×qO22) + (-85.129×EHOMO) + (19.724 ELUMO)
The value of R2 = 0.8732 indicated that model A10 could give a significant correlation between independent variables and dependent variable which is anticancer activity. Independent variables that are included in model A10 are atomic net charge (C6, C10, C12, O22), HOMO and LUMO energy. This model will be used to design new derivative compounds that have a better activity compared with gefitinib as standard. Previous study showed that small electron withdrawing substituent group as R2 and bulkier substituent group as R3 will increased the activity of compound. Both of substituent groups influenced net atomic charge of C6. Substituent group in R1 position was projected into the solvent to increase activity.11 The HOMO energy related to the ionization potential and characterize the ability of the molecule to be attacked by electrophile. On the other side, the LUMO energy related to electron affinity.31 Therefore, it could be apply as guidance in design new molecule.
Table 2: Electronic descriptors and statistical parameters of QSAR model.
| Model | Descriptors | R | R2 | PRESS |
| A1 | qC1,qC5,qC12,qO18,qO22,HOMO | 0.759 | 0.576 | 4.0864 |
| A2 | qC1,qC5,qC13,qC16,qC19,HOMO | 0.713 | 0.509 | 7.1655 |
| A3 | qC1,qC5,qC12,qC13,qC16,HOMO | 0.585 | 0.342 | 5.5107 |
| A4 | qC1,qC5,qC12,qC13,qC16,HOMO | 0.692 | 0.478 | 5.1478 |
| A5 | qC1,qC5,qC16,qC19,qC20,HOMO | 0.781 | 0.609 | 4.7681 |
| A6 | qC4,qC6,qC12,qO22,HOMO,LUMO | 0.781 | 0.61 | 12.153 |
| A7 | qC6,qC10,qC12,qO22,HOMO,LUMO | 0.801 | 0.642 | 4.6404 |
| A8 | qC6,qC10,qC12,qO22,HOMO,LUMO | 0.804 | 0.646 | 4.6736 |
| A9 | qC6,qC10,qC12,qO22,HOMO,LUMO | 0.811 | 0.658 | 4.4547 |
| A10 | qC6,qC10,qC12,qO22,HOMO,LUMO | 0.797 | 0.636 | 4.6782 |
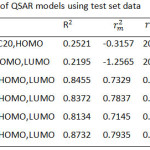 |
Table 3: External validation of QSAR models using test set data. |
Design New Compounds
Model A10 as the chosen QSAR model was utilized as reference in designing new compounds. It is shown in QSAR equation of model A10 that the more positive atomic charge (C6, C10, C12, O22) and HOMO energy made Log IC50 more negative. On the other hand, decreasing LUMO energy made anticancer activity increased. Therefore, recommendations to design new molecule were small electron withdrawing in position R2 and bulkier donating electron in position R3 to give a more positive net charge in atom C6. Electron donating group will increase the HOMO energy and decrease the LUMO energy to get the more negative Log IC50.
Table 4 showed list of newly designed molecules based on QSAR equation. It could be seen that hydrogen substituent in R1 position produced a better activity than the other substituent. It caused by hydrogen substituent that cause atomic net charge of O22 more positive than the other substituents. Only ten compounds that had Log IC50 predicted lower than b1 indicating that designed compounds had a potency as anticancer activity.
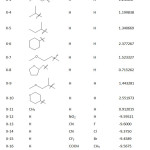 |
Table 4: List of newly designed compounds. |
Lipinski Rules Filter
Ten of designed compounds that had lower Log IC50 was continue to observe bioavailability properties including adsorption, distribution, metabolism, and excretion (ADME) using Lipinski rule of five. This rules are an approach to predict drug-likeness of the molecule that should require some parameters. There were four parameters, consist of molecular weight should lower than 500, Log P value no more than 5, hydrogen bond donors shouldn’t more than 5 and hydrogen bond acceptors didn’t more than 10. Table 5 displayed result of all designed compounds examined using Lipinski rule. Drug molecules should not have more than two violation in Lipinski rule.19 All the tested compounds in this study were not found to violate the rule indicating these compounds had drug like properties.
Table 5: Evaluation of Lipinski rule for all design compounds.
| Number of compounds | Lipinski rule of five | Log IC50 | |||
| Mass | Log P | H-bond donor | H-bond acceptor | ||
| <500 | <5 | <5 | <10 | ||
| X-1 | 295 | 2.85 | 2 | 6 | -10.076 |
| X-12 | 340 | 2.76 | 2 | 8 | -9.5952 |
| X-13 | 338 | 2.86 | 2 | 7 | -9.6 |
| X-14 | 334 | 2.31 | 2 | 7 | -9.375 |
| X-15 | 443 | 2.78 | 2 | 6 | -9.4589 |
| X-16 | 352 | 1.52 | 2 | 8 | -9.5675 |
| X-17 | 381 | 3.2 | 2 | 8 | -9.8814 |
| X-18 | 353 | 2.76 | 3 | 8 | -10.594 |
| X-19 | 353 | 2.67 | 2 | 8 | -10.882 |
| X-20 | 352 | 3.22 | 2 | 7 | -10.807 |
Docking Study
Following result from Lipinski rules filter, we analyze the binding site of EGFR firstly by redocking analysis of erlotinib. Then, we used that binding site to place the new compound. There were four compounds X-18, X-19, X-20 was chosen to proceed with docking analysis, shown in Figure 1. Those compounds had a better activity than the other compounds due to Log IC50 value. Redocking analysis of erlotinib resulted binding site which took place on amino acid residue of Met769. This binding site was applied to new compounds and exhibited similar interaction that occur in the binding site. All compounds showed a hydrogen bond with amino acid Met769. Additional interaction was observed on compound X-18 and X-19. There is π-cation interaction on compound X-18 between ligand and Lys721 residue in hydrophobic pocket of EGFR. One hydrogen bond additional also occurred between compound X-19 and Lys721 residue. Many researches had been reported that EGFR inhibitor should have an interaction with Met769 residue7,20,32 and additional interaction will make interaction between ligand and protein stronger that could inhibit the anticancer activity in the EGFR mutant strains such as T790M mutation.33
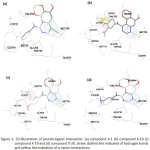 |
Figure 1: 2D-illustration of protein-ligand interaction: (a) compound X-1 (b) compound X-18 (c) compound X-19 and (d) compound X-20. |
Green dashed line indicated of hydrogen bonds and yellow line indication of π-cation interactions.
Conclusion
Quantitative structure activity relationship between quinazoline and anticancer activity had been studied using electronic descriptors. The best QSAR model show a linear relation between atomic net charge (C6, C10, C12, O12), HOMO energy and LUMO energy. Those relation was applied to design new derivative compounds and produced ten compounds which had a better predicted activity than b1 as the most active in the existing quinazoline derivatives. Lipinski rule of five used to filter the compounds based on their physicochemical properties and all compounds didn’t violate the rule. Docking studies was used to screen out compound X-1, X-18, X-19, and X-20 that had better activity and resulted hydrogen bond interaction in critical place which is Met769 amino acid residue. This finding indicated that all new design compound could be used as target synthesized molecule.
Acknowledgments
This work was supported by the scholarship Pendidikan Magister Menuju Doktor Untuk Sarjana Unggul (PMDSU) of Ministry of Research, Technology and higher Education of Indonesia. Gaussian 09 licenses were provided by Austrian-Indonesian Centre (AIC) for Computational program.
References
- American Cancer Society. Genes Dev. 2017, 21, 2525–2538.
- Baselga, Oncologist. 2002, 7, 2–8.
- Herbst, R. S.; Shin, D. M. Cancer, 2002, 94, 1593–1611.
CrossRef - Herbst, R. S. Int. J. Radiat. Oncol. Biol. Phys. 2004, 59, 21–26.
CrossRef - El-feky, S. A.; Imran, M.; Nayeem, N. Orient. J. Chem. 2017, 33, 707–716.
CrossRef - Chen, Y.; Luo, Y.; Wu, C.; Lee, Y.; Perng, R.; Whang-peng, J. J. Cancer Res. Pr. 2015, 2, 3–11.
- Stamos, J.; Sliwkowski, M. X.; Eigenbrot, C. J. Biol. Chem. 2002, 277, 46265–46272.
CrossRef - Kobayashi, S.; Boggon, T.J.; Dayaram, T.; Janne, P.A.; Kocher, O.; Meyerson, M.; Johnson, B. E.; Eck, M. J.; Tenen, D. G.; Halmos, B. N. Engl. J. Med. 2005, 352, 786–792.
CrossRef - Teraishi, F.; Kagawa, S.; Watanabe, T.; Tango, Y.; Kawashima, T.; Umeoka, T.; Nisizaki, M.; Tanaka, N.; Fujiwara, T. FEBS Lett. 2005, 579, 4069–4075.
CrossRef - Yin, K. H.; Hsieh, Y. H.; Sulake, R. S.; Wang, S. P.; Chao, J. I.; Chen, C. Bioorg. Med. Chem. Lett. 2014, 24, 5247–5250.
CrossRef - Ismail, R. S. M.; Ismail, N. S. M.; Abuserii, S.; Abou El Ella, D. A. Futur. J. Pharm. Sci. 2016, 2, 9–19.
- Pao, W.; Miller, V. A.; Politi, K. A.; Riely, G. J.; Somwar, R.; Zakowski, M. F.; Kris, M. G.; Varmus, H. PLoS Med. 2005, 2, 0225–0235.
- Singh, M.; Jadhav, H. R. Drug Discov. Today, 2018, 23, 745–753.
CrossRef - Young, D. C. Chemistry Computational Chemistry A Practical Guide for Applying Techniques to Real-World Problems. New York , 2001, 9.
- Nicoleti, N. H.; Batagin-Neto, A.; Lavarda, F. C. Med. Chem. Res. 2016, 25, 1630–1638.
CrossRef - Chtita, S.; Larif, M.; Ghamali, M.; Bouachrine, M. Orbital: The Journal of Chemistry, 2015, 7.
- Batagin-Neto, A.; Lavarda, F. C. Med. Chem. Res. 2014, 23, 580–586.
CrossRef - Smits, R. A.; Adami, M.; Istyastono, E.P.; Zuiderveld, O.P.; Van Dam, C.M.E.; De Kanter, F.J.J.; Jongejan, A.; Coruzzi, G.; Leurs, R.; De Esch, I.J.P. J. Med. Chem. 2010, 53, 2390–2400.
CrossRef - Verma, G.; Khan, M.F.; Akhtar, W.; Alam, M.M.; Akhter, M.; Alam, O.; Hasan, S.M.; Shaquiquzzaman, M. Arab. J. Chem. 2016.
- Qin, X.; Li, Z.; Yang, L.; Liu, P.; Hu, L.; Zeng, C.; Pan, Z. Bioorganic Med. Chem. 2016, 24, 2871–2881.
CrossRef - Frisch, M. J.; Trucks, G.W.; Schlegel, H.B.; Scuseria, G.E.; Robb, M.A.; Cheeseman, J.R.; Scalmani, G.; Barone, V.; Petersson, G.A.; Nakatsuji, H.; Li, X.; Caricato, M.; Marenich, A.; Bloino, J.; Janesko, B.G.; Gomperts, R.; Mennucci, B.; Hratchian, H.P.; Ortiz, J. V.; Izmaylov, A.F.; Sonnenberg, J.L.; WilliamsYoung, D.; Ding, F.; Lipparini, F.; Egidi, F.; Goings, J.; Peng, B.; Petrone, A.; Henderson, T.; Ranasinghe, D.; Zakrzewski, V.G.; Gao, J.; Rega, N.; Zheng, G.; Liang, W.; Hada, M.; Ehara, M.; Toyota, K.; Fukuda, R.; Hasegawa, J.; Ishida, M.; Nakajima, T.; Honda, Y.; Kitao, O.; Nakai, H.; Vreven, T.; Throssell, K.; Montgomery, J.A.; Jr.; Peralta, J.E.; Ogliaro, F.; Bearpark, M.; Heyd, J.J.; Brothers, E.; Kudin, K.N.; Staroverov, V.N.; Keith, T.; Kobayashi, R.; Normand, J.; Raghavachari, K.; Rendell, A.; Burant, J.C.; Iyengar, S.S.; Tomasi, J.; Cossi, M.; Millam, J.M.; Klene, M.; Adamo, C.; Cammi, R.; Ochterski, J.W.; Martin, R.L.; Morokuma, K.; Farkas, O.; Foresman, J.B.; Fox, D.J. Gaussian 09, Gaussian, Inc., Wallingford, CT, 2016.
- Dennington, R.; Keith, T.; Milliam, J. GaussView. 2009.
- Hou, T.; Zhu, L.; Chen, L.; Xu, X. J. Chem. Inf. Comput. Sci. 2003, 43, 273–283.
CrossRef - Szyszkowska, A.; Hęclik, K.; Trzybiński, D.; Woźniak, K.; Klasek, A.; Zarzyka, I. J. Mol. Struct. 2017, 1127, 708–715.
CrossRef - Lakshmanan, S.; Govindaraj, D.; Ramalakshmi, N.; Antony, S. A. J. Mol. Struct. 2017, 1150, 88–95.
CrossRef - Veerasamy, R.; Rajak, H.; Jain, A.; Sivadasan, S.; Varghese, C.P.; Agrawal, R.K. Int. J. Drug Des. Disocovery, 2011, 2, 511–519.
- Morris, G.; Huey, R. J. Comput. Chem, 2009, 30, 2785–2791.
CrossRef - Pettersen, E.; Goddard, T.; Huang, C.; Couch, G.; Greenblatt, D.; Meng, E.; TE, F. J Comput Chem. 2004, 25, 1605–12.
CrossRef - Huey, R.; Morris, G. M.; Olson, A. J.; Goodsell, D. S.; J. Comput. Chem. 2007, 28, 1145–1152.
CrossRef - Morris, G. M.; Goodsell, D.S.; Halliday, R.S.; Huey, R.; Hart, W.E.; Belew, R.K.; Olson, A.J. J. Comput. Chem. 1998, 19, 1639–1662.
CrossRef - Karelson, M.; Lobanov, V. S.; Katritzky, A. R. Chem. Rev. 1996, 96, 1027–1044.
CrossRef - Amin, K. M.; Georgey, H. H.; Awadallah, F. M. Med. Chem. Res. 2011, 20, 1042–1053.
CrossRef - Ahmed, M.; Sadek, M. M.; Abouzid, K. A.; Wang, F. J. Mol. Graph. Model. 2013, 44, 220–231.
CrossRef
Accepted on: 04-10-2018


ISSN Online: 2231-5039

![]()


