Effect of Shape and Size on Curie Temperature, Debye Frequency, Melting Entropy and Enthalpy of Nanosolids
Madan Singh1 , Benedict Molibeli Taele1 and Ghanshyam Patel2
1Department of Physics and Electronics, National University of Lesotho, P. O. Roma 180, Lesotho, Southern Africa.
2Department of Physics, Government Science College, Gandhinagar-382415, India.
Corresponding Author E-mail: m.singh@nul.ls
DOI : http://dx.doi.org/10.13005/ojc/340508
Article Received on : 25-09-2018
Article Accepted on : 11-10-2018
Article Published : 18 Oct 2018
The shape and size dependent melting thermodynamics of metallic nanoparticles are predicted by application of bond theory model, free of any adjustable parameter. Thermodynamic properties like Debye frequency, Curie temperature, melting entropy and enthalpy of Al, Sn, In, Cu, β-Fe and Fe3O4 for spherical and non spherical shapes nanoparticles with different size have been studied. In this model, the effects of relaxation factor for the low dimension solids are considered. The depression in Debye frequency, Curie temperature, melting entropy and enthalpy is predicted. The model predictions are supported by the available experimental and simulation results.
KEYWORDS:Bond Theory; Cohesive Energy; Curie Temperature; Melting Thermodynamics; Nanoparticles
Download this article as:| Copy the following to cite this article: Singh M, Taele B. M, Patel G. Effect of Shape and Size on Curie Temperature, Debye Frequency, Melting Entropy and Enthalpy of Nanosolids. Orient J Chem 2018;34(5). |
| Copy the following to cite this URL: Singh M, Taele B. M, Patel G. Effect of Shape and Size on Curie Temperature, Debye Frequency, Melting Entropy and Enthalpy of Nanosolids. Orient J Chem 2018;34(5). Available from: http://www.orientjchem.org/?p=51066 |
Introduction
The physico chemical properties of the nanosolids are a function of its shape and size. Nanoparticles with diameter varying from a few nanometers to several hundreds of nanometers are of great interest for many technological purposes and primary research due to their very special physical and chemical properties, which are unlike from its bulk counterparts.1-3 The surface energy of materials is a fundamentally important thermodynamic quantity to characterize the surface effect such as crystal growth, surface faceting, growth and stability of thin films, etc.,4 Thermodynamic properties such as melting, surface melting, superheating, cohesive energy, specific heat capacity of nanomaterials also differ from those of corresponding bulk materials due to surface effects.5-10 It is known that the melting temperature depression results from the high surface-to-volume ratio, and the surface substantially affects the interior bulk properties of these materials. Many theories have been discussed to explain the size dependent melting temperature like liquid drop model and Jiang’s model.11-12 The variation of cohesive energy, Debye temperature, specific heat and energy band gap is studied for the polyhedral shapes of nanosolids.13-14 The melting temperature, Debye temperature are found to decrease as the particle size is reduced, however the band gap and the specific heat capacity are found to increase with decrease in particle size.14 Neha et al., 15 derived a model to analyze the vacancy formation energy of size and shape dependent nanoparticle and predicted that as particle size reduces the vacancy formation energy increases. Experimental Research are carried out on size- and shape-dependent thermodynamic properties of the actual melting Process of Nanoparticles.16 By chemical reduction methods, Ag nanospheres, nanowires, and nanotubes with different sizes were prepared; and differential scanning calorimetry was employed to determine the melting temperature, the melting enthalpy and the melting entropy, and it is investigated that melting thermodynamic properties decrease with the particle size decrease.16 Guisbiers et al.,17 calculated the melting enthalpy by adopting top down approach using classical thermodynamics to study the size and shape effects of nanostructured materials. It is reported that, particularly for size lower than 10 nm, size and shape effect on melting entropy. Based on Mott’s equation a physical model for size dependent melting enthalpy and entropy of Sn and Al nanocrystals are developed,18 and shown the reduced entropy with size. A unified analytical model about the size dependent elastic modulus and vibration frequency of Cu, Ag, Si and TiO2 nanocrystalline metals, ceramics and nano scale semiconductors is explained based on the inherent strain and the binding energy change of nanocrystals.19 It has been registered that when the size reduces to nanoscale, ferromagnetic solids may exhibit lower Curie temperature.20 Based on cohesive energy, Fei et al.,20 reported the size and shape effects on Curie temperature of ferromagnetic nanoparticles.
In the latest decade, nanosolids have acknowledged more attention because of their special properties. All these developed theories and experimental facts are substantial to understand the nature of thermodynamic properties of nanosolids from several prospective. However, another important aspects of nanomaterials are shape and relaxation factor, which have not been enough attention to know the thermodynamic properties of nanomaterials. To understand the important role of shape, relaxation factor and bond energy, it is essential to study the bond energy model of nanomaterials.
In this paper, a qualitative unified model free from any adjustable parameter to study the Debye frequency, Curie temperature, melting entropy and enthalpy for the size and shape dependent of the low dimension nanosolids is established based on number of bonds, relaxation factor and bond energy. The predictions of the theory for the depression of the Debye frequency, Curie temperature, melting entropy and enthalpy agree well with the results of molecular dynamics simulations and the available experimental data.
Theoretical Formulation
It is registered21 that the distance between the surface atoms and the nearest interior atoms of solids is larger than the distance between the interior atoms. Meaning that, less than half of the volume of each surface atom is in the lattice, therefore more than half of the bonds of surface atoms are dangling bonds. The cohesive energy of the metallic nanoparticles is the sum of the bond energy of all the atoms. It is well known that the cohesive energy is an important factor to calculate the metallic bond, which equals to the energy that can divide the metal into isolated atoms by destroying all metallic bonds. The metallic bonds of each atom equal to the sum of interaction energies between the atom and the other atoms. In other words, each interior atom forms bonds with the surrounding atoms. The cohesive energy of a metallic crystal in any shape can be written as.22
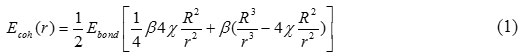
Where, Ebond is the bond energy and β is the number of bonds as every interior atom creates bonds with the surrounding atoms. The factor ½ is due to that each bond belongs to two atoms.
On simplification, Eq. (1) may be written as
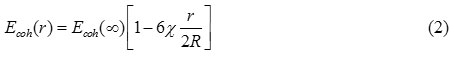
Where Ecoh (∞) = nβEbond /2 and χ is the shape factor, which is defined as the ratio of surface area of the particle in any shape to the surface area of spherical nanoparticle for the same volume.23
![]()
Where S is the surface area of the spherical nanoparticle with radius R and is given as S =4πR2. Here S1 is the surface area of the nanoparticle in any shape, whose volume is the same as the spherical nanoparticle.
Regarding the atoms of the nanoparticle are ideal spheres with radius r then the contribution to the particle surface area of each surface atom is πr2. The number of surface atom N is defined as the ratio of particle surface area to πr2. It is expressed as N = S1 / πr2
On substitution, it can be written as:
![]()
Since the volume of the nanoparticle is same as the volume of the spherical nanoparticle, therefore the number of total atoms n of the nanoparticle is the ratio of the particle volume to the atomic volume, which may be written as:
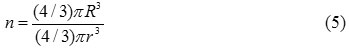
From Eqs. (4) and (5), it may be written as:
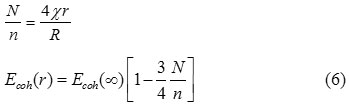
According to the bond energy model, the cohesive energy of nanoparticles is the summation of contribution of inner shell and outer shell atoms,24 which are defined as:
![]()
Where, γ is the relaxation factor and it is defined as the ratio between the dangling bonds and the total bond of the atoms. In the low dimension of nanosolids, the different position of atoms are discussed24-25; and reported the value of γ may have the following 0, ¼, ½, and ¾. Thus, the relaxation factor is in the range of 0 ≤ γ ˂ 1. Hence, Eq. (7) may be written as
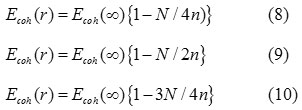
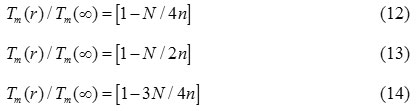
When, γ = 3/4, our Eq. (7) is same as the equation as Eq. ( 10) and for γ = 1/4, 1/2 we get the Eqs. (8) and (9). It is reported that the cohesive energy has a linear relation with the melting temperature of the solids,26 which is expressed as:
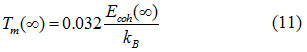
Therefore, the size and shape dependent melting temperature of nanomaterials should follow the similar relation given as
For ferromagnetic nanomaterials, the Curie temperature is the critical temperature, which is determine by the spin-spin exchange interaction.27 Based on a mean field approximation, the thermal vibration energy has a proportional relationship with temperature. The thermal vibration energy at curie temperature, required to disorder the exchange interaction is a measure of the atomic cohesive energy.27 As a first order approximation, the curie temperature can be regarded directly proportional to the cohesive energy, which is read as
Tcurie (∞)∞ Ecoh (∞) (15)
Thus, from Eq. (7) and (15), we may write Curie temperature of nanomaterials of different shapes as
Tcurie (r) = Tcurie (∞){1-γ N /n} (16)
According to the Lindemann’s melting criterion, which state that a crystal melts when the root mean square displacement of atoms exceeds a certain fraction of the interatomic distance in the crystal, is valid for small particles. The relationship between the melting temperature and the Debye temperature of the bulk material28 can be expressed as:
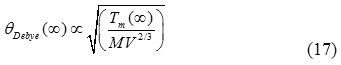
Where V is the volume per atom, and M is the molecular mass.
Since the Debye temperature is linearly related to the Debye frequency,29 thus from Eq. (7) and Eq. (17), the relationship for Debye frequency of nanomaterials with its corresponding bulk materials is derived as:
![]()
Now, we derive the size and shape dependent relationship of melting entropy of nanomaterials. The entropy of melting is due to vibration and electronic contribution.30 For nanoparticles the electronic contribution is very small. Thus the melting entropy is mainly due to vibrational in nature.18
The vibrational entropy of melting of solid is related to the melting temperature as follow.30
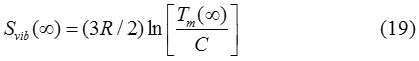
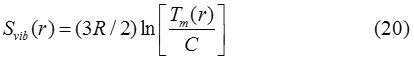
Where C is a constant and R is a gas constant. Similarly, for nanoparticles it may be written as:
From Eqs. (19) and (20), the relationship of melting entropy of nanoparticle and its bulk counterpart is
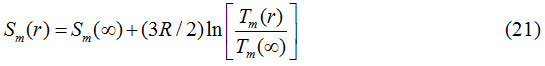
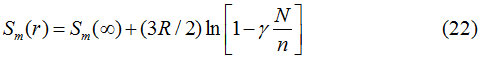
or,
The relation between melting entropy and melting enthalpy of solids.29 is given as
Hvib (∞) = Tm (∞) S vib (∞)
Likewise, for nanoparticle, we can write
Hvib (r) = Tm (r) Svib (r) (23)
Thus from Eqs. (22) and (23), we get the relationship of melting enthalpy of nanomaterials as:

Eqs. (22) and (24) are the more general relation for the size and shape dependent melting entropy and enthalpy of nanomaterials. The value of N/n depends upon the shape of the nanocrystal and can be determined by simple geometry as appeared in Table 1.31
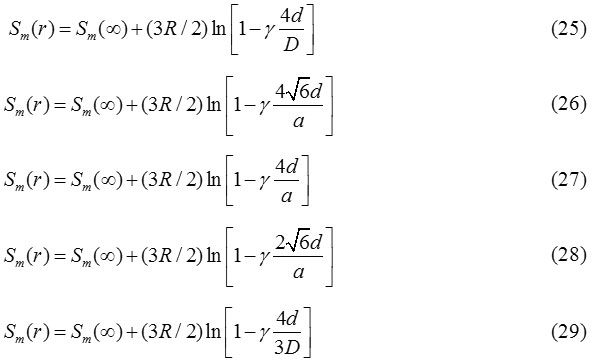
Thus, from Eq. (22) and the expressions of N/n, we obtain the expression for melting entropy in spherical, tetrahedral, hexahedral, octahedral and film shapes, respectively as follows:
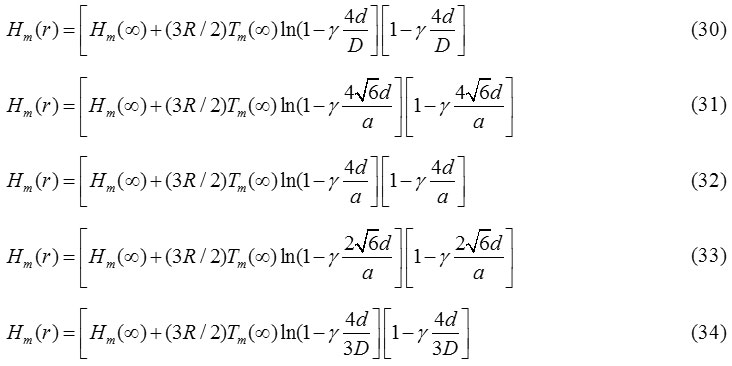
Also, from Eq. (24), we achieve the expression for melting enthalpy in spherical, tetrahedral, hexahedral, octahedral and film shapes respectively are as follows:
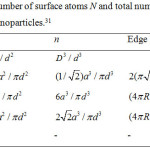 |
Table 1: N/n, Ratio of number of surface atoms N and total number of atoms n of polyhedron shapes of nanoparticles.31 |
Table 2: Input parameters used in the calculations.17,18,32-36
| Parameters | Al | Sn | In | Cu | Fe | Fe3O4 |
| d(nm) | 0.3164 | 0.3724 | 0.324 | 0.256 | 0.248 | 0.222 |
| S(∞)J/mol/K | 9.6 | 9.22 | 6.75 | 9.76 | 6.82 | – |
| H(∞)kJ/mol | 10.7 | 7.08 | 3.283 | 13.263 | – | – |
Results and Discussion
The calculated results for size and shape dependent Curie temperature, Debye frequency, melting entropy and melting enthalpy, using model Eqs. (16), (18), (25), (26), (28), (29,) (30), (31), (33) and (34) are reported in Figs 1-15. Input parameters required in calculations are given in Tables 1-2.17-18,31-36 To explain the phase stability of magnetic nanomaterials, Curie temperature is the most important physical property. Fig. 1 shows the findings of the of size and shape variation of the Curie temperature of Fe3O4 nanomaterial along with the experimental data.37 It is reported that when the particle size is above 12 nm, the effect of change in Curie temperature is moderate. However, when the size of the particle is less than 12 nm, the variation of the Curie temperature is significant. On decreasing the size, the Curie temperature keeps on increasing. When the particle size is around 4 nm, the Curie temperature reduces from 860 K to 500 k in tetrahedral shape; for the octahedral, spherical and film shapes the effect is relatively less. It is also interesting to know that the shape of the ferromagnetic nanoparticles plays an important role on the Curie temperature variations with size, especially below the size range of 12nm. Furthermore, it is observed that the available experiment data37 are well located near to our predicted results in spherical shape as shown in Fig.1. It is clear from our predictions that Curie temperature is inversely proportional to the size of nanoparticle. The consistency of our findings with the available experimental data validates the success of our theory. The decrement of Curie temperature is also supported by the theory that there exists the different degree of spin-spin interaction between the surface atoms and the inner atoms, which leads to the variation of the lattice vibration. As a result, it changes the Curie temperature of the ferromagnetic nanomaterials.38 But, in bulk materials, because of negligible fraction of surface atoms, the surface spin disorder is insignificant. On reducing the size, the ratio of surface atoms to the total atoms is increased; therefore, the effect of spin disorder becomes substantial and consequently decreases the Curie temperature of the ferromagnetic nanometals.
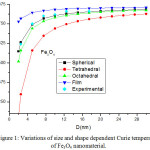 |
Figure 1: Variations of size and shape dependent Curie temperature of Fe3O4 nanomaterial. |
The lines are model predictions based on Eq. (16) and green diamond symbols ◊ are the experimental data.37 The Curie temperature for the bulk material, TCurie (∞) is 860 K.27
The variation of Debye frequency ratio with particle size is calculated using Eq. (18) for β-Fe nanocrystal. It is evident from Fig. 2, that on decreasing particle size, Debye frequency ratio decreases. The variation of Debye frequency in spherical, octahedral, tetrahedral and film shaped of Fe nanomaterial is depicted in Fig. 2. It is noted that when the size is less than 12 nm, the shape effect is dominant. When the particle size range is more than 12 nm, there is a slight change in Debye frequency. The graphical representation, which shows the decreasing behaviour of Debye frequency of nanoparticle depends upon the shape and size of the nanosoloids. The comparative variations of Debye frequency ratio of Fe nanosolids for the different values of γ (γ= 0.25, 0.5 and 0.75) are presented in Fig. 3. It is reported that when the relaxation factor increases, the decrease in Debye frequency ratio increases sharp on decreasing the particle size. It supports the fact that on increasing relaxation factor, surface area increases, as a result Debye frequency decreases.
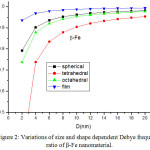 |
Figure 2: Variations of size and shape dependent Debye frequency ratio of β-Fe nanomaterial. |
The lines are model predictions based on Eq. (18).
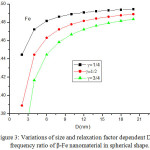 |
Figure 3: Variations of size and relaxation factor dependent Debye frequency ratio of β-Fe nanomaterial in spherical shape. |
The lines are model predictions based on Eq. (18).
We have extended the model theory to study the size and shape dependent melting entropy and enthalpy of Al, Sn, In and Cu, in the form of Eqs. (25), (26), (28), (29,) (30), (31), (33) and (34). Fig. 4 compares the model prediction with the available experimental data34 for melting entropy of Al nanosolid. The graphical representation shows that melting entropy decreases as the size decreases. The model projection is compared with the available experimental data in spherical shape and it is reported that our findings for spherical shape are consistent with the experimental observations.34 The variations of melting entropy with size in tetrahedral, octahedral and film shapes are plotted in same graph for comparison purpose, and it is observed that as shape changes melting entropy also varies appreciably. The effect of decrease in melting entropy in tetrahedral shape is sharp in comparison to octahedral, spherical and film shapes. It is clear from the Fig. 4, when the particle size is less than 15 nm, the melting entropy decreases rapidly with decrease in size of the nanocrystal. However, when the particle size is more than 15 nm, the effect is not noticeable. Fig. 5 shows the graphical depiction of melting entropy of Al nanomaterial in spherical shapes for the relaxation factor γ = 0.25, 0.5 and 0.75, and it is disclosed that on decreasing particle size, the melting entropy for γ = 0.75 decreased significantly around D < 10 nm in comparison to γ = .25 and 0.5.
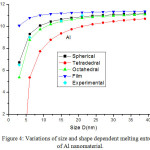 |
Figure 4: Variations of size and shape dependent melting entropyof Al nanomaterial. |
The lines are model predictions based on Eqs. (25), (26), (28) and (29); green diamond symbols ◊ are the experimental data.34
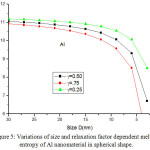 |
Figure 5: Variations of size and relaxation factor dependent melting entropy of Al nanomaterial in spherical shape. |
The lines are model predictions based on Eq. (25).
Melting entropy calculated by Eqs. (25), (26), (28) and (29) for Sn nanosolid is reported in Fig. 6 along with the available experimental data.33 It is obvious from the graph that the trend of melting entropy with size is reliable with the experimental observations. It is found that when the size D < 15 nm, the experimental values are in between of our findings for spherical and tetrahedral shapes. Above D >15 nm, there is small variation in entropy as size increases. It is also obvious that on changing shapes behaviour, the variation of entropy changes with size. The change in entropy is minimum for film shape and maximum for tetrahedral shape at a particular size of the Sn nanomaterial. Melting entropy of Sn nanosolid for different values of relaxation factor is shown in Fig. 7, and it is predicted that on decreasing particle size melting entropy decreases with the increase of relaxation factor.
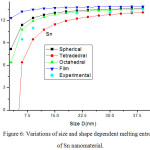 |
Figure 6: Variations of size and shape dependent melting entropy of Sn nanomaterial. |
The lines are model predictions based on Eqs. (25), (26), (28) and (29); green diamond symbols ◊ are the experimental data.33
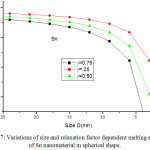 |
Figure 7: Variations of size and relaxation factor dependent melting entropy of Sn nanomaterial in spherical shape. |
The lines are model predictions based on Eq. (25).
Fig. 8 presents the model predictions of Eqs. (25), (26), (28) and (29) along with the available experimental data for melting entropy of In nanosolid as a function of size. As it is evident from the graph that when the size range is less than 12 nm, melting entropy shows a big change with size. On the other hand, when size is more than 12 nm, a very small change is observed. As we see for the spherical nanosolids, the experimental observations39 are very close to our model predictions. It is also observed that the change depends upon the shape of the nanoparticles; for tetrahedral shape change is maximum and for film it is minimum; and for the rest in between them. The decreasing nature of melting entropy of Cu nanosolid with size is projected, as seen in Fig.10 along with the experimental observations.40 It is very certain from our projections that the model predictions are consistent to the simulations results in case of spherical nanoparticles. The comparison behaviour of melting entropy in all shapes are shown in Fig. 10, it is noticed that when particle size less than 10 nm, more effects are observed in comparison to when size more than 10 nm.
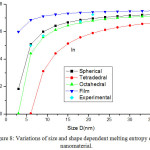 |
Figure 8: Variations of size and shape dependent melting entropy of in nanomaterial. |
The lines are model predictions based on Eqs. (25), (26), (28) and (29); green diamond symbols ◊ are the experimental data.39
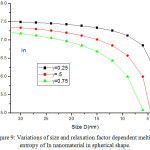 |
Figure 9: Variations of size and relaxation factor dependent melting entropy of In nanomaterial in spherical shape. Click here to View figure |
The lines are model predictions based on Eq. (25).
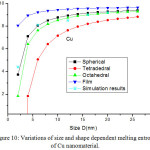 |
Figure 10: Variations of size and shape dependent melting entropy of Cu nanomaterial. |
The lines are model predictions based on Eqs. (25), (26), (28) and (29); Star symbols are the experimental data.40
Figures 11-14 show the predictions of melting enthalpy along with the experimental data33-34,39-40 with size and shape by using Eqs. (30), (31), (33) and (34). The melting enthalpy nature of Al nanosolid with decreasing size is projected in Fig 11. It is apparent that the calculated results from Eq. (30) for spherical nanosolid are very close to the available experimental data [34] in spherical shape; specially, when the size is close to 20 nm and little deviation to octahedral shape on reducing size. The size and shape dependence of melting entropy of Sn nanomaterial is shown in Fig. 12 along with the experimental data.33 However, we see the slight variation of enthalpy with the experimental values on lower size range, but the trend is more or less same. The variations of melting enthalpy of In and Cu nanosolids are projected in Figs 13-14 along with the available experimental data.39-40 It is certain that as we decrease the size the melting enthalpy decreases. One can observe that the shape influences a lot in calculation of melting enthalpy. In case of tetrahedral shape, the maximum deviation is observed in comparison to octahedral, spherical and film shapes. The competitive behaviour of melting enthalpy of Cu nanometal with relaxation factor γ = 0.25, 0.5 and 0.75 is shown in Fig. 15. It is observed that on increasing the relaxation factor, the melting enthalpy decreases sharply on reducing the size of the nanomaterials.
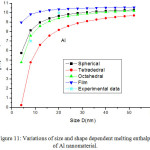 |
Figure 11: Variations of size and shape dependent melting enthalpy of Al nanomaterial. |
The lines are model predictions based on Eqs. (30), (31), (33) and (34); Star symbols are the experimental data.34
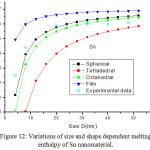 |
Figure 12: Variations of size and shape dependent melting enthalpy of Sn nanomaterial. |
The lines are model predictions based on Eqs. (30), (31), (33) and (34); Star symbols are the experimental data.33
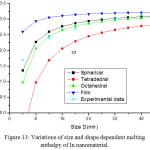 |
Figure 13: Variations of size and shape dependent melting enthalpy of In nanomaterial. |
The lines are model predictions based on Eqs. (30), (31), (33) and (34); Star symbols are the experimental data.39
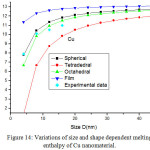 |
Figure 14: Variations of size and shape dependent melting enthalpy of Cu nanomaterial. |
The lines are model predictions based on Eqs. (30), (31), (33) and (34); green diamond symbols ◊ are the experimental data.40
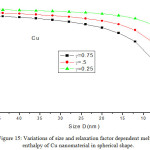 |
Figure 15: Variations of size and relaxation factor dependent melting enthalpy of Cu nanomaterial in spherical shape. |
The lines are model predictions based on Eq. (30).
Conclusion
We proposed a simple model free from any adjustable parameter based on bond energy theory. In low dimension nanoscale solids, the relaxation factor is incorporated in our theory to calculate the Curie temperature, Debye frequency, melting entropy and the melting enthalpy of the nanosolids in different shapes such as spherical, octahedral, tetrahedral and film shapes. It is observed that all these effects are more appreciable when the particle size is less than around 15 nm. Moreover, it is observed that the effects of shape influence more when the size less than 15 nm. Also, is verified that on increasing relaxation factor, all these properties increase appreciable on decreasing size. In general, we have seen that with decreasing size, the relative significance of all these effects increases. The reasonable agreement between the model predictions and the available experimental and simulation results are found. Our model theory has potential applications for the scholars who are engaged in experimental research.
Acknowledgement
The authors are thankful to the National University of Lesotho, Southern Africa, for providing the support to carry out the research work.
References
- Qu, Y.D.; Li, X.J.; Li, R.Y.; H. H. Yan, H.H.; Ouyang, X. and Wang, X.H. Mater. Res. Bull., 2008, 43, 97–103.
CrossRef - Krasnoperova, Yu.G.; Degtyarev, M.V.; Voronova, L.M. and T Chashchukhina, T.I. Phys. Met. Metallogr., 2016, 117, 267–274.
CrossRef - Singh, M. and Singh, M. J Pramana, 2015, 84, 609-619.
CrossRef - Bechstedt, F. Principles of Surface Physics, Fourth Edition, Springer, New York, 2003.
CrossRef - Samsonov, V. M.; Bazulev, A.N. and Sdobnyakov, N.Yu. Cent. Eur. J. Phys., 2003, 1, 474-484.
- Qi, W.H.; Wang, M.P. and Su, Y.C. J. Mater. Sci. Lett., 2002, 21, 877-878.
CrossRef - Barnard, A.S. and Zapol, P. J. Chem. Phys., 2004, 121, 4276-4283.
CrossRef - Shreiber, D. and Jesser, W.A. Surf. Sci., 2006, 600, 4584-4590.
CrossRef - Xing, Y. and Rosner, D.E. J. Nanoparticle Res., 1999, 1, 277-291.
CrossRef - Nanda, KK. Chem. Phys. Lett., 2006, 419,195-200.
CrossRef - Nanda, K.K.; Sahu, S.N. and Behera, S.N. Phys. Rev. A, 2002, 66,13208-8.
CrossRef - Jiang, Q.; Zhang, S. and Zhao, M. Mater. Chem. Phys., 2003, 82, 225-227.
CrossRef - Goyal, M. and Gupta, B.R.K. Chinese J. of Phys., 2018, 56, 282-291.
CrossRef - Singh M.; Goyal M. and Devlal, K. J. Taibah Univ. Sci., 2018, 12, 470-475.
CrossRef - Arora, N. and Joshi D.P. Indian J. Pure & App. Phys., 2017, 55, 284-292.
- Fu, Q.; Cui, Z,; Xue, Y. and Duan, H. J. Phys. Chem. C, 2018, 122, 15713–15722.
CrossRef - Guisbiers, G. and Buchaillot, L. J. Phys. Chem. C, 2009, 113, 3566-3568.
CrossRef - Zhang, Z.; Lu, X.X. and Jiang, Q. Physica B: Condens. Matter, 1999, 270, 249-254.
CrossRef - Liang, L.; Ma, H. and Wei, Y. J. Nanomaterials, 2011, 6 pages.
- Evans, R.; Nowak, U.; Dorfbaner, F.; Shrefl, T.; Mryasov, O.; Chantrell, R. W. and Grochola, G. J. Appl. Phys. 2006, 99, 08G703-1-3.
- Solliard, C. and Flueli, M. Surf. Sci., 1985, 156, 487-494.
CrossRef - Qi, W.H. and Wang, M.P. Mater. Chem. Phys., 2004, 88, 280–284.
CrossRef - Qi, W.H.; Wang, M.P. and Xu, G.Y. J. Mater. Sci. Lett., 2003, 22, 1333-1334.
CrossRef - Qi, W.H. Acc. Chem. Res., 2016, 49, 1587-1595.
CrossRef - Bhatt, S. and Kumar, M. J. Phys. Chem.Solids, 2017, 106, 112-117.
CrossRef - Dash, J.G. Rev Mod Phys., 1999, 71, 1737-1743.
CrossRef - Sun, C.Q.; Zhong, W.H.; Li, S.; Tay, B.K.; Bai, H.L. and Jiang, E.Y. J. Phys. Chem. B,2004, 108, 1080-1084.
CrossRef - Lindemann, F.A. Phys. Z, 1910, 11, 609-615.
- Kittles, C., Intro.Solid State Phys., Seventh Edition, John Wiley & Sons, New York, 1996, 59.
- Regel, A.R. and Glazov, V.M. Semiconductors, 1995, 29, 405-417.
- Qi, W.H.; Wang, M.P. and Liu, Q.H. J. Mater. Sci., 2005, 40, 2737–2739.
CrossRef - King, W.H. and Cahn, R.D. Physical Metallurgy, North Holland, Amsterdam, 1970, 33-68.
- Lai, S.L.; Guo, J.Y.; Petrova, V.; Ramanath, G. and Allen, L.H. Phys. Rev. Lett., 1996, 77, 99-102.
CrossRef - Eckert, J.; Holzer, J.C.; Ahn, C.C.; Fu, Z. and Johnson, W.L. Nanostruct. Mater., 1993, 2, 407-413.
CrossRef - Xiong, S.; Qi, W.; Cheng, Y.; Huang, B.; Wang, M. and Li, Y. Phys. Chem. Chem. Phys., 2011, 13, 10652-10660.
CrossRef - Shandiz, M.A. and Safaei, A. Mater.Lett., 2008, 62, 3954-3956.
CrossRef - Sadeh, B.; Doi, M.; Shimizu, T. and Matsui, M. J. Magnet. Soc. Japan, 2000, 24, 511-514.
CrossRef - Lang, X. Y.; Zheng, W. T. and Jiang, G. Q. Phys. Rev. B, 2006.73, 224444-8.
- Zhang, M.; Efremov, M.Y.U; Schiettekatte, F.; Olson, E.A.; Kwan, A.T.; Lai, S.L.; Wisleder, T.; Greene, J. E. and Allen, L. H. Phys. Rev. B, 2000, 62, 10548-57.
CrossRef - Delogu, F. Phys. Rev. B, 2005, 72, 205418-26.
CrossRef

This work is licensed under a Creative Commons Attribution 4.0 International License.
![]()
A New Edition of Web of Science
Journal Impact Factor
2022: 0.5
Five Year: 0.8
Journal is Indexed in

Cabells Whitelist
![]()


