Development and Validation of Rapid, Sensitive Rp-Uplc Method for Determination of Related Impurities in Dexrabeprazole Sodium
Santosh T. Khadangale1,2, Vitthal M. Dhalape1,2 and Rahul V. Pinjari1
1School of Chemical Sciences, Swami Ramanand Teerth Marathwada University, Nanded 431606, India.
2Analytical Research Centre, Emcure Pharmaceuticals Limited, Hinjawadi, Pune. 411057, India.
Corresponding Author E-mail: rvp.chem@srtmun.ac.in
DOI : http://dx.doi.org/10.13005/ojc/340526
Article Received on : 13-08-2018
Article Accepted on : 21-08-2018
Article Published : 26 Sep 2018
Dexrabeprazole sodium (DEX•Na) is an active pharmaceutical ingredient and used as proton pump inhibitor. A reverse phase (RP) ultra-performance liquid chromatographic (UPLC) method is developed for determination of related impurities in DEX•Na and this method is validated using ICH guideline. This method was developed using BEH C18 (2.1 X 50 mm) 1.7 µm column and gradient program for mobile phase. Mobile phase A contains 99% phosphate buffer of pH ~7.0 and 1% acetonitrile, whereas mobile phase B is the methanol and acetonitrile in 95:5 ratio. The 0.45 mL/min total flow rate, 3.0 µL injection volume, 40°C column oven temperature and 284 nm detection wavelength are used with sampling rate of 5 points per second. The DEX•Na peak is well separated from its known and unknown impurities. The run time of the method is reduced to 10 min, which is ~11 times smaller than methods reported in literature. The method is accurate and precise as well as linear in the range of LOQ to 150% level with respect to specification concentration limit of impurities. The stress conditions to DEX•Na revealed that drug is stable in alkaline medium, while it is sensitive to acidic and oxidative condition. The new method is sensitive, precise, accurate, and rapid; it also qualifies all the criteria of linearity, stability, as well as robustness.
KEYWORDS:Dexrabeprazole Sodium(DEX•Na); Lower Level Quantification and Detection; Rapid; RP-UPLC; Sensitive; Stability Indicating
Download this article as:| Copy the following to cite this article: Khadangale S. T, Dhalape V. M, Pinjari R. V. Development and Validation of Rapid, Sensitive Rp-Uplc Method for Determination of Related Impurities in Dexrabeprazole Sodium. Orient J Chem 2018;34(5). |
| Copy the following to cite this URL: Khadangale S. T, Dhalape V. M, Pinjari R. V. Development and Validation of Rapid, Sensitive Rp-Uplc Method for Determination of Related Impurities in Dexrabeprazole Sodium. Orient J Chem 2018;34(5). Available from: http://www.orientjchem.org/?p=49943 |
Introduction
Dexrabeprazole sodium (DEX•Na) is R (+)-isomer of Rabeprazole, (2- [[[4-(3-methoxy propoxy)-3-methyl-2pyridinyl]-methyl] sulfinyl]1H-benzimidazole).1,2,3 It belongs to a class of anti-secretory compounds that exhibit neither anti cholinergic nor histamine H2 receptor antagonist properties. However, DEX•Na suppresses gastric acid secretion by inhibiting the gastric H+/K+ATPase at the secretory surface gastric parietal cells.4 DEX•Na is thus a proton pump inhibitor and used to treat backward flow of acid from the stomach (gastroesophageal reflux disease), which causes heartburn and possible injury of the oesophagus.5,6 It heals oesophagus and prevent further damage. Several factors viz. the stability of the active ingredient, the manufacturing process, the environmental conditions (such as heat, light and moisture during storage) and chemical reactions (oxidation, reduction and hydrolysis) may affect the stability of a pharmaceutical product.7 Rabeprazole (RAB), conjugated acid of DEX•Na, has been reported as thermal, acidic and photo sensitive.8-11 Several HPLC methods using UV and PDA detectors are reported for these related substances in DEX•Na (see Table 1).[12,13] The reverse phase (RP) HPLC method developed by Kumar et al. has 85 min run time and LOQ for the related impurities between 0.020% to 0.036%.12 In another articles, the analytical method has achieved good sensitivity and relatively lower LOQ (0.005 – 0.014%), however with longer run time (90 min).13 The reverse phase (RP) HPLC assay and LOD,LOQ determination method of analyte developed by V. Asha Ranjani et al. with 5 min run time, however LOD and LOQ of the analyte quite high (0.23% and 0.70%).14 Thus the present article reports the development and validation of the RP-UPLC method for related substances of DEX•Na with higher sensitivity, lower levels of detection and quantification with considerably shorter run time.
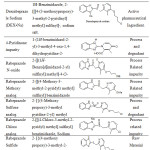 |
Table 1: Dexrabeprazole Sodium (DEX•NA) and its related impurities. |
Materials and Methods
The DEX•Na and its six impurities viz. 4-pyridinine (A), sulfone analog (B), sulphide analog (C), N-oxide (D), chloro analog (D) and methoxy analog (G) (see Table 1) were synthesized and characterized in Emcure Pharmaceutical Limited, Analytical Research Centre Hinjawadi, Pune. Purified milli-Q water and analytical grade acetonitrile, methanol, di-potassium hydrogen phosphate as well as potassium hydrogen phosphate are used throughout. The Waters Acquity UPLC (H Class) system with PDA/UV detector and Empower 2 software for data acquisition are used. All the instruments were calibrated during method development and validation. The buffer is prepared by dissolving 1.74 g of di-potassium hydrogen phosphate anhydrous and 1.36 g of potassium di-hydrogen phosphate in purified water and diluted to 1000 mL. The homogeneous mixture of 990 mL buffer and 10 mL acetonitrile are used as a mobile phase-A, while mobile phase B is a mixture of 950 mL methanol and 50 mL acetonitrile. The mixture of 900 mL of 0.01N sodium hydroxide and 100 mL methanol is used as a diluent for the sample and standard preparation. The 500 ppm solutions of DEX•Na both for system suitability test for peak identification and sample solution were prepared.
Analytical Method Development
The underlying principle of UPLC is based on van Deemter statement which describes the connection between linear velocity with plate height. UPLC contributes to the improvement of the three areas: speed, resolution, and sensitivity.15 The rapid method results can obtain within short time. Hence, the UPLC technique is proposed for development of analytical method of related substances of DEX•Na. The DEX•Na and its impurities are quite polar hence analytical method using reverse phase chromatography is development for their separation. Different combination of mobile phase parameters, pH and columns are considered during present RP-UPLC method. It is observed that, separations of all known and unknown impurities are very sensitive to aforementioned parameters. The DEX•Na and its impurities show maxima near to 284nm; therefore, this wavelength is chosen for analyte detection during method development. The UPLC columns having 2.1 X 100 mm dimensions and 1.9 µm stationary phase particle size with different carbon load (C8 and C18) are used, where late eluting peaks and their broad peaks are observed. When Acquity BEH C4 column (2.1 X 100 mm 1.7 µm) is used the known and unknown impurities are eluted in 10 mins with sharp peak shape, however the chloro analog impurity elute together with methoxy analog impurity. To separate the chloro and methoxy analogues impurities the carbon loading of Acquity BEH column is increased from C4 to C18. All known and unknown impurities are well resolved from each other and from analyte with proper peak shapes when Acquity BEH C18 (2.1 x 50 mm 1.7 mm) column is used. Among different column oven temperature (30, 35, 40 and 45˚C) better chromatograms is observed at 40˚C.The other parameter such as sampling rate (5 points/second), injection volume (3 mL) and flow rate (0.45 mL/min) are set by performing different experiment.
The method is established by using gradient program with combination of phosphate buffer (mobile phase A) and mixture of organic solvents (mobile phase B). Initially the composition of mobile phase A and B in 77:23 ratios have been used, which is then gradually changed to 55:45 up to 0.80 min and maintain till 2.00 min. Then mobile phase ratio is slowly changed to 50:50 up to 3.50 min and to 20:80 up to 5.50 min which is maintained till 7.50 min. Finally, composition is abruptly brought to initial values of 77:23 up to 7.60 min and maintained till 10 min.
Results and Discussion
The analytical method validation is carried out as per ICH guideline.16,17 All parameters in the method validation are discussed below.18
Specificity
Specificity is the ability of the method to measure the analyte response in the presence of its impurities. This can be done by spiking known impurities with its limit levels and demonstrate the results are unaffected by presence of known impurities. Selectivity chromatogram for blank, mix impurities standard, unspiked and spiked test are shown in Figure 1. Blank run does not show any interfering peak at the retention time of DEX•Na and its related impurities peak. The peak due to DEX•Na is well resolved from known impurities. The selectivity data for spiked test preparations are given in Table 2. Peak purity angle of DEX•Na and its known impurities are below peak purity threshold for all individual solutions of impurities, standard preparations, unspiked and spiked test preparations, thus these peaks are homogeneous and pure. The % relative standard deviation of six replicates of standard preparation with mixture of impurities (A-E and G) and DEX•Na at limit level are 0.26, 0.37, 0.22, 0.51,0.50, 0.15 and 0.59%, respectively. Tailing factor and theoretical plates in system suitability preparation of DEX•Na are 1.14 and 19347, respectively. The resolution between DEX•Na and closest eluting chloro analog is 2.69; the resolution values for all other impurities are even larger.
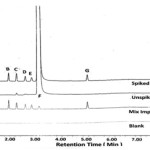 |
Figure 1: Selectivity chromatogram for blank, mix impurities standard, unspiked and spiked test.
|
Table 2: Selectivity data of spiked test preparation for DEX•Na.
|
Peak name |
Peak name (Impurity) |
RT (min.) |
RT Ratio |
Resolution |
Purity Angle |
Purity Threshold |
Peak Purity |
|
A |
4-Pyridinone |
0.553 |
0.18 |
NA |
1.462 |
1.572 |
Pass |
|
B |
N-oxide |
1.996 |
0.64 |
27.05 |
0.180 |
1.393 |
Pass |
|
C |
Methoxy Analog |
2.286 |
0.73 |
4.70 |
0.066 |
1.147 |
Pass |
|
D |
Sulfone Analog |
2.630 |
0.84 |
4.77 |
0.092 |
1.466 |
Pass |
|
E |
Chloro Analog |
2.883 |
0.92 |
3.04 |
0.196 |
2.623 |
Pass |
|
F |
DEX•Na |
3.139 |
1.00 |
2.69 |
0.419 |
2.325 |
Pass |
|
G |
Sulfide Analog |
4.986 |
1.59 |
24.62 |
0.272 |
1.397 |
Pass |
Limit of Detection and Limit of Quantitation
The limit of detection (LOD) is the point at which a measured value is larger than the uncertainty associated with it. It is the lowest concentration of analyte in a sample that can be detected, but not necessarily quantified. The limit of quantitation (LOQ) of an individual analytical procedure is the lowest amount of analyte in a sample which can be quantitatively determined with suitable precision and accuracy. The limit of detection and quantitation are determined from signal-to-noise ratios being 3:1 and 10:1, respectively and reported in the Table 3. The observed LOD and LOQ are in between 0.0015 to 0.0025% and 0.0046 to 0.0076%, respectively. The reported LOQ values are lower than the earlier methods in literature.12,13
Table 3: Limit of detection and limit of quantitation data of DEX•Na and its related impurities.
|
Peak Name |
Peak name |
LOD in % |
LOD in ppm |
LOQ in % |
LOQ in ppm |
|
w. r. t. test Conc.500 ppm |
|||||
|
A |
4-Pyridinone Impurity |
0.0024 |
0.012 |
0.0074 |
0.037 |
|
B |
N-oxide |
0.0022 |
0.011 |
0.0068 |
0.034 |
|
C |
Methoxy Analog |
0.0024 |
0.012 |
0.0074 |
0.037 |
|
D |
Sulfone Analog |
0.0022 |
0.011 |
0.0068 |
0.034 |
|
E |
Chloro Analog |
0.0022 |
0.011 |
0.0068 |
0.034 |
|
F |
DEX•Na |
0.0015 |
0.0075 |
0.0046 |
0.023 |
|
G |
Sulfide Analog |
0.0025 |
0.0125 |
0.0076 |
0.038 |
Linearity and Range
Linearity of method is the measure of the proximity of the straight line obtained from a calibration plot of response versus concentration. It is obtained by performing the experiments using different concentrations of the DEX•Na and its known impurities. Thus, the linearity of present UPLC method is determined from LOQ level to 150% of specification limit concentrations (0.50 ppm for DEX•Na and 0.75 ppm for each impurity). The typical chromatograms of blank, overlay linearity levels are shown in Figure 2. The peak area versus concentration data was treated by least squares linear regression analysis. All observed value (in Table 4) and graph plotted (see Figure 3) indicates that this method is linear for given range. The LOQ obtained from this data is precise with the values in the Table 3. The straight-line nature of graph shows that method is linear in the range from LOQ to 150% of known impurities and DEX•Na. The linearity was plotted in the range of LOQ to 150% of level concentrations. The correlation coefficient obtained for DEX•Na and its related impurities are greater than 0.9997.
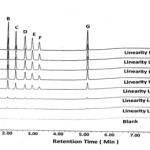 |
Figure 2: Linearity levels chromatograms blank, LOQ (5 %) to 150% level concentration. |
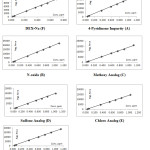 |
Figure 3: Linearity Graphs of DEX•Na and its (A-E and G) impurities with concentration range from the LOQ – 150% of concentration. |
Table 4: Linearity data for related impurities of DEX•Na from LOQ –150 % concentration range.
|
Impurities |
A |
B |
C |
D |
E |
G |
|
Correlation Coefficient |
0.9999 |
0.9999 |
0.9997 |
0.9999 |
0.9999 |
0.9999 |
|
Slope |
20531 |
19327 |
14284 |
14775 |
14407 |
16662 |
|
Intercept |
-49.70 |
-51.36 |
-19.37 |
-51.69 |
-61.36 |
5.06 |
Precision
System precision is performed with 6 replicates of standard solution of DEX•Na in presence of impurities. System suitability criteria such as tailing factor, theoretical plates, % RSD and resolution are calculated. % RSD results in system precision study for impurities (A-E and G) and DEX•Na are 0.22, 0.21, 0.19, 0.44, 0.52, 2.91 and 0.14%, respectively. Tailing factor and theoretical plates in system suitability preparation of DEX•Na are 1.31 and 19058, respectively. The method precision is performed by injecting six replicate of sample solutions after spiking of impurities at specification limit level. While an intermediate precision is evaluated by changing analyst, instrument and column on different day. For calculation of the % RSD for each method and intermediate precisions, six replicates of spiked impurities are considered. The comparison data of method precision and intermediate precision are presented in Table 5. Overall %RSD of twelve samples i.e. six from method precision and six from intermediate precision of impurities (A-E and G) as well as total Impurities are 2.00, 2.41, 3.89, 3.31, 3.13, 2.07 and 2.91% respectively. The resolution between peak of DEX•Na and chloro analog is 02.91.
Table 5: Comparative data of method precision and intermediate precision in spiked test.
|
Test |
% A |
% B |
% C |
% D |
% E |
% G |
% Total impurities |
||||||||
|
MP |
IP |
MP |
IP |
MP |
IP |
MP |
IP |
MP |
IP |
MP |
IP |
MP |
IP |
||
| Spiked test 1 |
0.146 |
0.145 |
0.136 |
0.139 |
0.147 |
0.152 |
0.135 |
0.139 |
0.134 |
0.136 |
0.151 |
0.153 |
0.881 |
0.904 |
|
| Spiked test 2 |
0.142 |
0.147 |
0.133 |
0.140 |
0.143 |
0.155 |
0.132 |
0.141 |
0.131 |
0.138 |
0.147 |
0.153 |
0.860 |
0.913 |
|
| Spiked test 3 |
0.146 |
0.146 |
0.137 |
0.140 |
0.148 |
0.155 |
0.135 |
0.140 |
0.134 |
0.137 |
0.151 |
0.155 |
0.884 |
0.911 |
|
| Spiked test4 |
0.143 |
0.147 |
0.134 |
0.139 |
0.144 |
0.152 |
0.133 |
0.140 |
0.132 |
0.136 |
0.149 |
0.153 |
0.867 |
0.905 |
|
| Spiked test 5 |
0.137 |
0.147 |
0.129 |
0.139 |
0.137 |
0.155 |
0.127 |
0.141 |
0.123 |
0.138 |
0.143 |
0.154 |
0.826 |
0.907 |
|
| Spiked test6 |
0.143 |
0.145 |
0.135 |
0.138 |
0.144 |
0.153 |
0.132 |
0.138 |
0.131 |
0.136 |
0.148 |
0.153 |
0.864 |
0.902 |
|
| Mean (n=6) |
0.143 |
0.146 |
0.134 |
0.139 |
0.144 |
0.154 |
0.132 |
0.140 |
0.131 |
0.137 |
0.148 |
0.154 |
0.864 |
0.907 |
|
| SD (n=6) |
0.003 |
0.001 |
0.003 |
0.001 |
0.004 |
0.002 |
0.003 |
0.001 |
0.004 |
0.001 |
0.003 |
0.001 |
0.021 |
0.006 |
|
| % RSD(n=6) |
2.31 |
0.68 |
2.09 |
0.58 |
2.71 |
0.97 |
2.20 |
0.86 |
3.13 |
0.73 |
2.03 |
0.52 |
2.41 |
0.71 |
|
| Mean (n=12) |
0.145 |
0.137 |
0.149 |
0.136 |
0.134 |
0.151 |
0.885 |
||||||||
| SD (n=12) |
0.003 |
0.003 |
0.006 |
0.005 |
0.004 |
0.004 |
0.027 |
||||||||
| %RSD(n=1 |
2.00 |
2.41 |
3.89 |
3.31 |
3.13 |
2.32 |
3.03 |
||||||||
Accuracy
Accuracy can also be described as the closeness of agreement between the value that is adopted, either as a conventional, true, or accepted reference value, and the value found. Accuracy study of all known impurities is carried out in triplicate at LOQ level, 50, 100 and 150% concentration. Observed % recoveries of all six known impurities are between 95.07 to 102.73%. Recovery data is given in Table 6 and typical chromatograms of different recovery levels are shown in Figure 4.
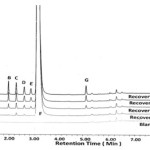 |
Figure 4: Chromatogram for blank, recovery levels from LOQ to 150% concentration. |
Table 6: % Recovery data of related impurities of DEX•Na impurities.
|
Impurities |
LOQ Level(n=3) |
50 % Level(n=3) |
100 % Level(n=3) |
150 % Level(n=3) |
|
A |
100.00±0.00 |
99.53±0.81 |
100.46±0.40 |
99.69±0.27 |
|
B |
95.07±3.69 |
100.00±0.00 |
94.79±0.67 |
99.50±0.00 |
|
C |
101.79±6.84 |
98.15±0.81 |
99.77±0.40 |
99.69±0.27 |
|
D |
99.02±6.62 |
100.00±0.00 |
99.26±0.01 |
99.34±0.29 |
|
E |
101.49±2.99 |
99.49±0.88 |
98.26±0.41 |
99.00±0.01 |
|
G |
100.91±3.38 |
102.73±0.02 |
100.90±0.38 |
101.35±0.00 |
Robustness
The robustness of analytical method is determined by purposeful alteration of experimental conditions such as flow rate (by ±10%) and column oven temperature (±5°C). Actual flow rate of 0.45 mL/min is altered to 0.40 mL/min and 0.50 mL/min. Similarly, the column oven temperature is changed from 40°C in original method to 35 and 45°C. In all above cases the retention times are varied by ±0.12 to ±0.6 minutes compared to actual retention times. System suitability parameter such as tailing factor, theoretical plates, resolution and % RSD are range from 1.26−1.31,15730−20735,2.89−3.04 and 0.05−4.04 respectively. The relative % impurities with reference to the corresponding values in method precision obtained for the altered method parameter are given in Table 7. In all deliberate varied chromatographic conditions (flow rate, column oven temperature and column) the values of system suitability criteria are almost similar- to that of method precision. The % deviation for these values compared to one in method precession are below 9.00%, which is within the limit (20%) prescribed by ICH guidelines.16
Table 7: Comparison data of method precision and robustness study of spiked impurities.
|
% Impurities relative to MP* |
|||||||
| Parameter |
Total |
A |
B |
C |
D |
E |
G |
| MP |
0.000 (0.864) |
0.000 (0.143) |
0.000 (0.134) |
0.000 (0.144) |
0.000 (0.132) |
0.000 (0.131) |
0.000 (0.148) |
| Temp. (35ºC) |
0.016 |
0.005 |
0.001 |
0.002 |
0.004 |
0.005 |
0.001 |
| Temp. (45ºC) |
0.015 |
0.004 |
0.001 |
0.003 |
0.004 |
0.002 |
0.001 |
| Flow (0.40 mL/min) |
0.006 |
0.005 |
0.001 |
0.002 |
0.004 |
0.002 |
0.000 |
| Flow (0.50 mL/min) |
0.007 |
0.005 |
0.000 |
0.002 |
0.005 |
0.002 |
0.014 |
* The % impurity values for MP are given in parenthesis.
Solution Stability
The solution stability of standard as well as sample solutions and solutions used for system suitability test is performed on 24 and 48h at the controlled room temperature (25°C). The % recovery for impurities (A-E and G) in standard solutions are 99.17 (101.57), 98.68 (99.48), 99.10 (99.13), 99.02 (100.03), 99.86 (100.35), 99.11 (100.58) and 101.55 (101.77) % for 24 (48) h, respectively. Cumulative % RSD of concentration of these impurities in % for is 0.42, 0.43, 0.00, 1.24, 0.44, and 0.78%. Also, there is insignificant change in tailing factor, theoretical plates and resolution up to 48 h. This indicates that the solutions are quite stable at least up to 48 h.
Mobile phase stability
The mobile phase stability at the controlled room temperature is performed on 24 and 48 h. Until 48 h for both A and B mobile phases the appearance is clear, and haziness is not observed. The observed % RSD of all the (A-E and G) impurities and DEX•Na in standard solutions on 48 h are 0.38,0.60,0.79,0.28,0.75,1.20 and 0.63%, respectively. Furthermore, system suitability parameters such as tailing factor, theoretical plates and resolution are comparable with initial data. Therefore, mobile phase is stable up to 48 h when stored at the controlled room temperature.
Forced degradation study
Forced degradation study gives a measure of specificity and it helps in selection of stability-indicating analytical procedures. The % degradation of analyte is determined by comparing chromatogram of untreated sample and samples maintained under (thermal, photolytic, humidity, aqueous, acidic, basic and oxidative) stress conditions. The degradation data of DEX•Na under such conditions are shown in Table 8. In thermal degradation sample was heated at 60°C for 24 h, humidity degradation carried out at 40°C with 75% relative humidity for 24 h and in photolytic degradation sample solution is treated with light energy of 1.2 x 10⁶ lux h using near-UV 200 Wh/m2 source. The colour of DEX•Na solid sample is changed from pale yellow to yellow due to these heat, humidity and photolytic condition, however the % impurities and peak area of the DEX•Naremained constant without any degradant peak. This indicates that DEX•Na molecule is stable for heat, humidity and photolytic stress conditions. The solution-A is prepared by dissolving 50.0 mg of DEX•Na in 5.0 mL of diluent, which is then exposed to the desired stress condition. The solution is then neutralized, and final volume is adjusted using diluent to 100 mL in volumetric flask. In acid degradation study, DEX•Na solution is exposed to 3.5 mL of 0.02N HCl at room temperature for 10 min and then neutralized with 0.02N NaOH. In alkali degradation, solution-A of DEX•Na is exposed to 5.0 mL of 0.5N NaOH at 60°C for 4 h in oil bath. After 4 h solution is cooled and neutralized with 0.5N HCl. In oxidation degradation, solution-A is exposed to 2.0 mL 30% H2O2 at room temp for 20 min. Final volume of solution-A after each stress treatment is made up to 100 mL in volumetric flask and chromatograms are recorded (see Figure 5–7). All degradant impurities are well separated from DEX•Na and its known impurities. Overall 11.90, 0.72 and 5.30 % degradation (see Table 8) are observed for acid, basic and oxidative stress, respectively. In acid degradation the sulphide analogue impurity (G)is the major degradant, while in oxidative degradation sulfone analog (D) as major degradant. Insignificant degradation of DEX•Na in alkaline condition renders its stability in basic medium.
Table 8: The stress conditions with % degradation of DEX•Na.
| ID | Form of sample | Degradation Condition |
Purity Angle (unit) |
Purity Threshold (unit) |
Peak purity (unit) |
% Degradation |
| Untreated Sample |
Solid |
– |
0.040 |
0.253 |
Pass |
— |
| Photolytic |
Solid |
Light energy of 1.2 million lux h. and near UV 200-watt h/m2 |
0.043 |
0.255 |
Pass |
— |
| Humidity |
Solid |
75% RH at 40°C for 24 h |
0.041 |
0.250 |
Pass |
— |
| Heat |
Solid |
24 h at 60°C |
0.038 |
0.254 |
Pass |
— |
| Aqueous |
Solution |
5 mL water at room temp. for 24 h |
0.041 |
0.254 |
Pass |
— |
| Peroxide |
Solution |
2 mL 30% H2O2 Kept at room temp for 20 min. |
0.036 |
0.242 |
Pass |
5.34 |
| Acid |
Solution |
3.5 mL of 0.02N HCL at room temp for 10 min |
0.046 |
0.252 |
Pass |
11.92 |
| Alkali |
Solution |
5 mL of 0.5N NaOH, heat the solution at 60°C on oil bath for 4 h |
0.033 |
0.253 |
Pass |
0.72 |
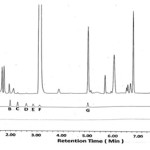 |
Figure 5: Chromatogram for the acid degradation studies of DEX•Na |
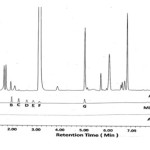 |
Figure 6: Chromatogram for the alkali degradation studies of DEX•Na |
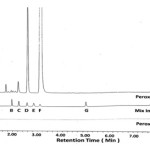 |
Figure 7: Chromatogram for the peroxide degradation studies of DEX•Na |
Conclusion
Dexrabeprazole sodium (DEX•Na) is an active pharmaceutical ingredient and used as proton pump inhibitor. A RP-UPLC method is developed for determination of related impurities in DEX•Na and it is validated using ICH guideline. This RP-UPLC method is developed using BEH C18 (2.1 X 50 mm) 1.7 µm column and gradient program for mobile phase. Mobile phase A contains 99% buffer of potassium di-hydrogen phosphate and di-potassium hydrogen phosphate with ~7.0 pH and 1% acetonitrile, whereas mobile phase B is the methanol and acetonitrile in 95:5 ratio. The 0.45 mL/min total flow rate, 3.0 µL injection volume,40°C column oven temperature and 284nm detection wavelength are used. The sampling rate is 5 points per second. Run time of the method is 10 min, which is much faster compared to the 85-90 min in reported methods. The DEX•Na peak is well separated from its known (A-E and G) and unknown impurities. Linearity and accuracy study of impurities was performed in the range of LOQ to 150% level with respect to specification concentration limit. Solution and mobile phase are stable up to 48 h and the method is robust also. The forced degradation study reveals that the DEX•Na is stable in the alkaline medium, while it significantly degrades in acidic and oxidative stress condition mainly to sulfide and sulfone analogues, respectively. The present RP-UPLC method is not only precise, accurate, linear and rapid but also qualifies all the stability and robustness criteria. This may be used for routine quality control analysis.
Acknowledgements
The Santosh Khadangale and Vitthal Dhalape thank to Dr. Mukund Gurjar, Emcure Pharmaceuticals Limited, Analytical Research Centre, Hinjawadi, Pune for his support, encouragement and permitting this work to communicate for publication.
Conflict of Interest
Conflict of interest declared none.
References
- Richardson, P.; Hawkey C.; Stack W. Drugs. 1998, 56, 307-35.
CrossRef - Feret B.; Quercia R.; Cappa J. Formulary. 1999, 34, 313-23.
- Reilly J. P.: Am. J. Health. Syst. Pharm. 1999,56, S11-7.
- Bodhankar S.L.; Jain B.B.; Ahire B.P.; Daude R.B.; Shitole P.P. Indian. J. Pharmacol. 2006, 38(5), 357-58.
CrossRef - Barth J.; Hahne W.Aliment. Pharmacol. Ther. 2002, 16, 31–33.
CrossRef - Scarpignato C.; Gatta L.; Zullo A.; Blandizzi C. BMC Medicine. 2016, 14,179.
CrossRef - Kommanaboyina B,; Rhodes C.T. Drug. Dev. Ind. Pharm. 1999, 25, 857–868.
CrossRef - Cassia V.G.; Norma S.N.; Martin S.; Elfrides E.S.S. J. Pharm. Biomed. Anal. 2008, 46, 88-93.
CrossRef - Mathew M.; Das Gupta V.; Bailey R.E. Drug. Dev. Ind. Pharm. 1995,21, 965–971.
CrossRef - Radi A. Microchem. J. 2002, 73, 349–354.
CrossRef - Qaisi A.; Tutunji M.; Tutunji L. J. Pharm. Sci. 2006, 95, 384–391.
CrossRef - Navneet K.; Dhanaraj S. Sci. Pharm. 2013, 8, 697–711.
- Raghavaraju T.V.; Raja kumar S.; Mrutyunjaya Rao I.; Someswara Rao N. Asian. J. Pharm.Clin. 2013, 6, 43-51.
- Asha Ranjani V.; Praveen Kumar J.; Bharath Kumar K.S. Ijppr.Human. 2016, 6,241-254.
- Chawla G.; Chanda R. Open Chemistry Journal. 2016, 3, 1-16.
CrossRef - ICH. Guideline. 2005, Q2 (R1).
- ICH. Guideline. 2003, Q1A (R2).
- USP 41-NF 36, Statistical Tools for Procedure Validation. 2018, 1210, 7622-7632.

This work is licensed under a Creative Commons Attribution 4.0 International License.
![]()
A New Edition of Web of Science
Journal Impact Factor
2022: 0.5
Five Year: 0.8
Journal is Indexed in

Cabells Whitelist
![]()


