Simple Potentiometric Strategy for the Detection of Levofloxacin Hydrochloride and Daclatasvir Dihydrochloride in Pure form and Pharmaceutical Preparations
 , Mona M. Abdel-Moety1, Aliaa S. M. El-Tantawy1, Abdalla Shalaby2 and Magda El-Maamly2
1Pharmaceutical Chemistry Department, National Organization for Drug Control and Research [NODCAR], 6th Abu Hazem Street, Pyramids Ave, P.O. Box 29, Giza, Egypt.
2Department of Analytical Chemistry, Faculty of Pharmacy, Zagazig University, P.C.44 519, Zagazig, Egypt.
Corresponding Author E-mail: amirasalah992@yahoo.com
DOI : http://dx.doi.org/10.13005/ojc/340240
Download this article as:
![]()
The present study aimed to suggest a sensitive, precise and selective electrochemical approach for the potentiometric detection of Levofloxacin hydrochloride (LVX) and Daclatasvir dihydrochloride (DAC). The suggested technique was conducted by the incorporation of LVX or DAC with precipitating agent to construct two active sensors. Different concentration ranges of the investigated drugs (1.0 10-5-1.0 10-2 and 1.0 10-6-1.0 10-3 mol L-1)were detected under optimum conditions and provided potentiometric responses of 58.7±0.2 and 28.7±0.5 mV decade-1 with detection limits 3.2 10-6 and 1.1 10-7 for the two fabricated sensors, respectively. The fabricated LVX-TPB and DAC-TPB were successfully used for excellent detection of pure form and tablets of LVX and DAC.
KEYWORDS:Levofloxacin Hydrochloride; Daclatasvir Dihydrochloride; Plastic Membrane Sensors; Potentiometric Approach; Pharmaceutical Dosage Forms
Introduction
The use of electrochemical sensors has explored as a new class of chemical read-outs for monitoring a variety of chemical species because of their unique physico- chemical features and sensing properties. Promising applications have been found by potentiometric approach in various pharmaceutical analysis 1-3, diverse chemicals of food quality 4, clinical and biological interest 5,6. Various analytical benefits of potentiometric sensors, including their high stability and electrical conductivity have been reported 7.
Levofloxacin hydrochloride (LVX) is a member of the family of medications known as broad spectrum antibiotics. It is commonly recommended in urinary tract infections, gastrointestinal tract. Also, it is prescribed to treat the respiratory tract infection and pelvic inflammatory diseases 8. LVX (Figure 1a) is a member of quinolones, and its literature survey addressed some analytical techniques for the determination of LVX in different matrices. Among these methods are spectroscopic methods such as spectrophotometry 9- 15. Furthermore, LVX was detected using high performance liquid chromatography 16-19.
Daclatasvir dihydrochloride (DAC) (Figure 1b), is recommended for the treatment of hepatitis C virus by inhibiting NS5A protein. It is a new oral antiviral medication which exhibits a potential pangenotypic activity 20, 21. Few chromatographic methods were reported, including high performance liquid chromatography 22-28. The investigated drug was detected using spectrophotometric method 29,30. A chitosan modified electrochemical electrode for the detection of DAC was also, reported 31.
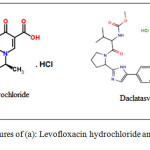 |
Figure 1: Chemical structures of (a): Levofloxacin hydrochloride and (b): Daclatasvir dihydrochloride |
The present study aimed to suggest two simple and accurate TBP-LVX and TPB-DAC plastic membrane sensors for LVX and DAC determination in their bulk powder and commercial formulations.
Experimental
Chemicals and Reagents
Pure grade LVX and DAC were provided by Pharmaceutical Co. (Memphise). Daclenza® (60 mg/tablet) and Unibiotic® (500 mg/tablet) were purchased drug local drug stores. Sodium tetraphenyl borate (TPB) purity of (99.5 %), dioctylphthalate (DOP, 98.0 %), Tetrahydrofuran (THF), hydrochloric acid 36%, methanol, Polyvinyl chloride (PVC), microcrystalline cellulose, L-histidine, L-cysteine, titanium dioxide, talc, starch, mannitol, lactose and magnesium stearate, were acquired from (Sigma-Aldrich, Hamburg, Germany). Sodium hydroxide, potassium chloride, sodium chloride, calcium carbonate, barium chloride and copper sulfate were supplied by (BDH laboratory supplies, Poole,UK).
Instrumentation
The potentiometric detections were performed under continuous magnetic stirring at 25±1°C with a Jenway pH-meter. A saturated standard electrode; silver/silver Cl– double junction electrode was used. The same model of pH meter was used for pH adjustment.
Preparation of Analytical Solutions
Stock LVX and DAC
A solution of each LVX and DAC was daily prepared by dissolving 1.98 g and 4.05 g in 50 mL water forming a concentration of 0.1 mol L-1. Modelling analytes in the range of 1.0 10-7-1.0 10-1 mol L-1 was daily obtained.
LVX and DAC Tablet Solutions
Not less than 10 tablets of each Daclenza® (60 mg/tablet) and Unibiotic® (500 mg/tablet) were finely agitated and 0.01 mol L-1 tablet solution was formed from each LVX and DAC into 10 mL methanol. A clear solution was taken and completed to volume using distilled water, after complete centrifugation and filtration. Two ranges of working solution 1.0χ10-5– 1.0χ10-2 and 1.0χ10-6-1.0χ10-3 mol L-1 were produced by dilutions using ultra pure water for LVX and DAC detection, respectively.
Preparation of LVX-TPB and DAC-TPB ion Pairs
The electroactive materials LVX-TPB and DAC-TPB of the developed sensors were prepared by the incorporation of equal volume of 0.01 mol L-1 of each LVX, DAC and TPB was mixed. Resulted precipitates were filtered and dried at room temperature overnight.
Sensor Construction
Preparation of LVX-TPB and DAC-TPB Plastic Membrane Sensors
The conventional PVC membrane sensors of LVX and DAC were fabricated by adding 190 mg PVC to 10.0 mg of each LVX-TPB or DAC-TPB ion pairs and 0.35 mL of DOP as plasticizer. Approximately, 5.0 mL of tetrahydrofuran (THF) was used. Membrane contents were poured into rounded glass dish and left aside for drying. The semi-transparent PVC membrane was obtained. The membrane is fitted with a polyethylene tube and the internal solution (1:1) 0.001mol L-1 sodium chloride solution and LVX or DAC solution was used. Then, they were preconditioned in 0.001 mol L-1 LVX or DAC solution for 1 hr 32-34.
Sensor Calibration
Calibration graphs of the developed LVX-TPB and DAC-TPB sensors were plotted using modelling solutions of 1.0χ10-7-1.0 10-1 mol L-1 LVX or DAC.
Standard Addition Method
The determination of each LVX and DAC in their commercial products was carried out using the standard addition method. It was conducted by dropping small additions to the analyte solution vs. the potential reading. The concentration of the test solution was obtained from(ΔE = E2-E1).
Results and Discussion
LVX and DAC sensors were fabricated using LVX-TPB or DAC-TPB electroactive materials. The sensitivity and selectivity of the constructed sensors were studied (Figure 2).
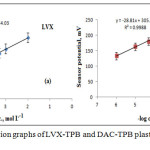 |
Figure 2: Typical calibration graphs of LVX-TPB and DAC-TPB plastic membrane sensors |
It was found that LVX-TPB and DAC-TPB sensors were displayed Nernstian responses (58.8±0.3 and 28.8±0.6 mV decade-1) covering 1.0 10-5-1.0χ10-2 and 1.0χ10-6-1.0χ10-3 mol L-1. The limits of detection 3.2χ10-6 and 1.1χ10-7 mol L-1 were recorded for LVX and DAC sensors. The quantification limits were also evaluated and was found to be 9.7χ10-6 and 3.4χ10-7 mol L-1 (Table 1).
Table 1: Critical analytical data of LVX-TPB and DAC-TPB PVCsensors
| LVX-TPB | DAC-TPB | |
| Slope (mV decade-1) | 58.8±0.3 | 28.8±0.6 |
| Correlation coefficient, r | 0.9989 | 0.9995 |
| Interccept | 434.03 | 305.88 |
| Linearity range (mol L-1) | 1.0χ10-5-1.0χ10-2 | 1.0χ10-6-1.0χ10-3 |
| LOD | 3.2χ10-6 | 1.1χ10-7 |
| LOQ | 9.7χ10-6 | 3.4χ10-7 |
| Response time/s | 30 | 40 |
| pH | 3.5-5.5 | 4.5-7 |
| Life time/day | 40 | 35 |
| Temperature˚C | 25˚C | 25˚C |
| Accuracy (%) | 99.7±0.7 | 99.2±0.4 |
| Robbustness | 99.2±0.4 | 99.7±0.3 |
| Raggedness | 98.6±0.7 | 99.4±0.1 |
The influence of three different kinds of plasticizers was carefully studied using DOS (ɛ = 4.0), DBS (ɛ = 4.5) and DOP (ɛ = 5.1). DOP was superior to other plasticizers in terms of sensor performance owing to higher (ɛ = 5.1) of DOP (Table 2).
Table 2: The resulted slopes of LVX-TPB and DAC-TBP PVS sensors using different plastecizers
| LVX-TPB | DAC-TPB | |
| DOS | 49.9 | 18.5 |
| DBS | 50.4 | 23.8 |
| DOP | 58.8* | 28.8* |
*The optimum slope of fabricated sensors
The investigated solutions in the range of 1.0χ10-7-1.0χ10-1 mol L-1 was used to calculate the response time. Response times for LVX-TPB and DAC-TPB were 30 & 40 s for lifetime 40 & 35 days (Figure 3).
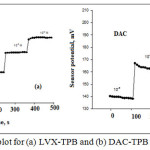 |
Figure 3: Response time plot for (a) LVX-TPB and (b) DAC-TPB membrane sensors |
pH values for LVX-TPB and DAC-TPB sensors were evaluated using 1.0χ10-3, 1.0χ10-4 mol L-1 and 1.0χ10-4, 1.0χ10-5 mol L-1 solutions. The pH of the analyte solution was adjusted using dil. HCl. Then, dil. NaOH was added to gradually increase pH. The potentials were derived against pH. The constructed LVX-TPB and DAC-TPB were safely active in pH 3.5-5.5 and 4.5-7 (Figure 4). The decrease in the pH below 3.5 and above 7 was attributed to the effect of H+ or OH–, respectively.
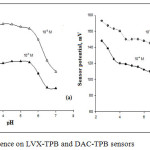 |
Figure 4: pH influence on LVX-TPB and DAC-TPB sensors |
For investigating LVX-TPB and DAC-TPB selectivity coefficients, prepared sensors were employed to measure 1.0χ10-3 mol L-1 of each drug in presence of different possible interfering species using SSM35. Fabricated sensors selectivity coefficients were calculated using the following equation.
Log Kpotdrug J z+= (E2 – E1) / S
No interference was noticed during the detection of LVX and DAC (Table 3).
Table 3: Selectivity coefficients (KPotDrug+) of LVX-TPB and DAC-TPB sensors
| KPotPLZ+ | ||
| Interferent | LVX-TPB plastic | DAC-TPB plastic |
| membrane sensor | membrane sensor | |
| Na+ | 7.4χ10-3 | 1.1χ10-3 |
| K+ | 6.8χ10-3 | 7.6χ10-4 |
| Ca2+ | 1.5χ10-4 | 2.6χ10-4 |
| Ba2+ | 2.3χ10-4 | 5.3χ10-4 |
| Cu2+ | 3.5χ10-4 | 3.9χ10-4 |
| Lactose | 7.1χ10-3 | 1.2χ10-3 |
| Talc | 7.1χ10-3 | 1.0χ10-3 |
| Starch | 9.0χ10-3 | 2.8χ10-3 |
| Mannitol | 6.3χ10-3 | 3.9χ10-3 |
| L. Histidine | 2.5χ10-3 | 1.7χ10-4 |
| L. cycteine | 6.6χ10-3 | 2.7χ10-4 |
| Magnesium stearate | 5.6χ10-3 | 2.3χ10-3 |
| Titanium dioxide | 5.3χ10-4 | 8.9 χ 10-5 |
| Microcrystalline cellulose | 3.6χ10-3 | 4.2χ10-4 |
Technique Validation
It was conducted by evaluating various parameters in accordance with ICH guidelines 36.
The linear relationship of the suggested potentiometric method was evaluated using LVX and DAC test solutions of concentrations 1.0χ10-7 to 1.0χ10-1 mol L-1. The two fabricated LVX-TPB and DAC-TPB sensors were employed for the detection of LVX and DAC test solutions. The results obtained revealed a concentration linearity of 1.0χ10-5-1.0χ10-2, 1.0χ10-6-1.0χ10-3 mol L-1 for LVX and DAC sensors, respectively.
Detection limits were evaluated when the slope was dropped by 17.9 mV. The results were 3.2χ10-6 & 1.1χ10-7 mol L-1, while, quantification limits were 9.7χ10-6 & 3.4χ10-7 mol L-1 for LVX-TPB and DAC-TPB, respectively.
Accuracy was examined in presenceof magnesium stearate using the standard addition method. The % recoveries were 99.7±0.7 & 99.2±0.4, for LVX-TPB and DAC-TPB sensors.
Precision was evaluated using intra-day and inter-day assay. RSD was less than 1% indicating good precision.
Table 4: Data obtained by investigating the precision of the fabricated LVX-TPB and DAC-TPB sensors
| Intra-day assay | Inter-day assay | ||||||
| LVX-TPB | DAC-TPB | LVX-TPB | DAC-TPB | ||||
| Taken* | % Recovery | Taken | % Recovery | Taken | % Recovery | Taken | % Recovery |
| 5 | 99.8±0.4 | 5 | 99.3±0.2 | 5 | 99.6±0.3 | 5 | 99.0±0.3 |
| 4 | 99.0±0.6 | 4 | 99.6±0.1 | 4 | 99.4±0.5 | 4 | 98.4±0.8 |
| 3.3 | 98.8±0.8 | 3.3 | 99.7±0.3 | 3.3 | 99.2±0.2 | 3.3 | 98.9±0.6 |
*- log concentration, mol L-1
Robustness was tested by minor changes in pH at 4.7±1. Resulted data were 99.2±0.4 & 99.7±0.3 for LVX-TPB and DAC-TPB. Ruggedness was examined using (HANNA 211 pH meter). The obtained data were 98.6±0.7 & 99.4±0.1 for LVX and DAC.
Analytical Applications
Quantification of LVX and DAC
LVX and DAC were quantified directly in bulk form using LVX-TPB or DAC-TPB sensors. The listed data were 99.3±0.4 and 99.5±0.5 for tested sensors (Table 5).
Furthermore, LVX and DAC were estimated in their tablets; they were recovered by 98.9±0.3% and 99.3±0.6% (Table 6).
Table 5: Data obtained by the detection of LVX and DAC in bulk drug using LVX-TPB and DAC-TPB sensors
| Sample | LVX-TPB PVC sensor | DAC-TPB PVC sensor | ||||
| Taken | Found | % | Taken | Found | % | |
| Pure drug | – | Recovery | Recovery | |||
| 5 | 4.99 | 99.8 | 6 | 5.97 | 99.5 | |
| 4.3 | 4.28 | 99.5 | 5 | 4.98 | 99.6 | |
| 4 | 3.97 | 99.3 | 4.3 | 4.24 | 98.6 | |
| 3.3 | 3.26 | 98.8 | 4 | 3.99 | 99.8 | |
| 3 | 2.98 | 99.3 | 3.3 | 3.29 | 99.7 | |
| 2 | 1.98 | 99 | 3 | 3 | 100 | |
| %Mean ±SD | 99.3±0.4 | 99.5±0.5 | ||||
| n | 6 | 6 | ||||
| Variance | 0.16 | 0.25 | ||||
| %SE | 0.16 | 0.2 | ||||
| % RSD | 0.4 | 0.5 |
Table 6: Data obtained by the detection of LVX and DAC in using LVX-TPB and DAC-TPB sensors using standard addition method
| Sample | LVX-TPB PVC sensor | DAC-TPB PVC sensor | |||||
| Taken | Found | % Recovery | Sample | Taken | Found | % Recovery | |
| Unibiotic® 500 mg /tablets | 5 | 4.97 | 99.4 | Daclenza® 60 mg/ tablet | 6 | 5.95 | 99.2 |
| 4.3 | 4.26 | 99.1 | 5 | 4.93 | 98.6 | ||
| 4 | 3.95 | 98.8 | 4.3 | 4.28 | 99.5 | ||
| 3.3 | 3.3 | 100 | 4 | 3.99 | 99.7 | ||
| 3 | 2.99 | 99.7 | 3.3 | 3.28 | 99.4 | ||
| 2 | 1.97 | 98.5 | 3 | 3 | 100 | ||
| % Mean ±SD | 99.3±0.6 | 99.4±0.5 | |||||
| n | 6 | 6 | |||||
| Variance | 0.36 | 0.25 | |||||
| % SE | 0.24 | 0.2 | |||||
| % RSD | 0.6 | 0.5 |
To evaluate the proposed method, the obtained results were statistically assessed using t- & F- tests at 95% confedence level 37. The obtained results for LVX detection using the fabricated LVX-TPB was compared with Maleque el al. (2012) method in which LVX was detected using water: methanol: acetonitrile (9.0:5.0:0.5 v/v/v) as solvent at 292 nm 11. Furthermore, the obtained results of DAC determination were compared with a simple spectrophotometric method which carried out by detecting the DAC drug in its bulk and pharmaceuticals, the detections were measured at 317 nm 30. The outcome results revealed an excellent agreement with the previously mentioned published methods (Table 7).
Table 7: Data obtained for the detection of LVX and DAC in their pharmaceutical formulations by the proposed and reported methods
|
Taken mol L-1 |
Mean%±SD |
n |
Variance |
%SE |
%RSD |
t-test |
F-test |
|
|
LVX-TPB |
1.0 χ 10-5-1.0χ10-2 |
99.3±0.6 |
6 |
0.36 |
0.24 |
0.6 |
0.830 (2.228)* |
1.78 (5.05)* |
| DAC-TPB |
1.0χ10-6-1.0χ10-3 |
99.4±0.5 |
6 |
0.25 |
0.20 |
0.5 |
0.581 (2.228)* |
1.96 (5.05)* |
|
Reported method of LVX 11 |
1-12 µg mL-1 |
99.7±0.8 |
6 |
0.64 |
0.32 |
0.8 |
||
|
Reported method of DAC 30 |
2-12 µg mL-1 |
99.6±0.7 |
6 |
0.49 |
0.28 |
0.7 |
* Ttabulted and Ftabulted37
Conclusion
This present study described a selective potentiometry approach for estimation of LVX and DAC in their bulk and pharmaceutical forms. Sensors were accurate and precise for the assay of LVX and DAC and displayed excellent detection of the investigated drugs with lower detection limits.
References
- Lenik, J. Cyclodextrins based electrochemical sensors for biomedical and pharmaceutical Analysis. Curr. Med. Chem. 2017, 24, 2359-2391.
CrossRef - Kanberoglu, G.S.; Coldur, F.; Topcu, C.; Cubuk, O. PVC-membrane potentiometric Sensor for the determination of tamoxifen in pharmaceutical formulations. IEEE Sensor J., 2015, 15, 6199-6207.
CrossRef - Yousry M.Issa, Y.M.; Khorshid, A.F. Using PVC ion-selective electrodes for the potentiometric flow injection analysis of distigmine in its pharmaceutical formulation and biological fluids. J. Advanced Res., 2011, 2, 25-34.
CrossRef - Rocha, R.A.; Rojas, D.; Clemente, M.J.; Ruiz, A.; Devesa, V.; Velez, D. Quantification of fluoride in food by microwave acid digestion and fluoride ion-selective electrode. Agric. Food Chem., 2013, 61, 10708-10713.
CrossRef - Santini, A.O.; Pezza, H.R.; de Oliveira, J.E.; Pezza, L. Development of a potentiometric flufenamate ISE and its application to pharmaceutical and clinical analyses. J. Braz. Chem. Soc., 2008, 19, 162-168.
CrossRef - Bliem, C.; Fruhmann, P.; Stoica, A-I.; Kleber, C. Development and optimization of an ion-selective electrode for serotonin detection. Electroanalysis, 2017, 29, 1635-1642.
CrossRef - Bobacka, J. Potential stability of all-solid-state ion-selective electrodes using conducting polymers as ion-to-electron transducers. Anal. Chem., 1999, 71, 4932-4937.
CrossRef - A.P. William, A.P. Antimicrobial agents Goodman & Gilman’s The Pharmacological Basis of Therapeutics (10th ed.), McGraw-Hill, New York, 2001, 1183.
- Kassab, N. M.; do Amaral M.S.; Singh, A.K.; Santoro, M.I.R.M.; Development and validation of the UV spectrophotometric method for determination of levofloxacin in pharmaceutical dosage forms. Quim. Nova, 2010, 33 (4), 968-971.
CrossRef - Sachan, N.; Chandra, P.; Yadav, M. Simple and validated UV-spectrophotometric method for the estimation of Levofloxacin in bulk and pharmaceutical dosage forms. Int. J. Pharm. Pharm. Sci., 2012; 4(5), 383-385.
- Maleque, M.; Hasan, R.; Hosan, R.; Hossen, F.; Safi, S.; Development and validation of a simple UV spectrophotometric method for the determination of levofloxacin both in bulk and marketed dosage formulations. J. Pharm. Anal.; 2012, 2 (6), 454-457.
CrossRef - Manimala, M.; Ravindra Reddy, K.; Hepcykala Rani, D. Development and validation of novel UV spectrophotometric determination of levofloxacin hemi hydrate in bulk and pharmaceutical dosage forms. Der. Pharm. Chem., 2013, 5(1),47-50.
- Pravallika, K.E. Bhavya, M.; Ravi, P.; Hemavathi, K.; Kumari, D.L. Quantitative determination of levofloxacin hemihydrate in bulk and tablets by UV spectrophotometry, zero and first order derivative methods. Asian J. Pharm. Anal. Med. Chem.2014, 2(3),176-182.
- Qassim, A.W.; Determination of levofloxacin in pharmaceutical formulation tavanic by Visible spectrophotometry of its chelating complex with aluminum ion (iii). Int. J. Dev. Res., 2015, 5 (6), 4702-4706.
- Lonikar, N. B.; Baby Sudha Lakshmi, P.; Mallikarjuna Gouda, M.A selective UV spectrophotometric analytical method to quantify the levofloxacin in bulk sample. ejpmr 2016, 3(9), 351-353.
- Naveed, S.; Sultana, N.; Saeed Arayne, M.; Dilshad, H. A new HPLC method for the assay of levofloxacin and its application in drug-metal interaction studies. J. Sci. and Inn. Res.2014,3(1), 91-96.
- Arayne, M.S; Sultana, N.; Siddiqui, F.A. Optimization of levofloxacin analysis by RP-HPLC using multivariate calibration technique. Pak J Pharm Sci. 2007, 20(2), 100.
- Manish kumara, T.; Gurrala, S.; Venkateshwar Rao, J.; Sambasiva Rao, K. Development and validation of HPLC UV method for the estimation of levofloxacin in human plasma. IJPPS. 2011, 3(2), 247-250.
- Czyrski, A.; Załek, S. An HPLC method for levofloxacin determination and its application in biomedical analysis. J. Anal. Chem., 2016,71(8), 840–843.
CrossRef - McCormack, P.L.; Daclatasvir: A review of its use in adult patients with chronic hepatitis c virus infection, Drugs, 2015, 75(5), 515-524.
CrossRef - Assessment Report of Daclatasvir from European Medicines Agency (EMA). Available from: http://www.ema.europa.eu/docs/en_GB/document_library/EPAR_Public_assessment_report/human/003768/ WC500172849.pdf.
- Sumathi, K.; Thamizhvanan, K.; Vijayraj, S. Development and validation of stability indicating RP-HPLC method for the estimation of daclatasvir in bulk and formulation. Der. Pharm. Lett. 2016, 8 (15),107-113.
- Chakravarthy, V.A.; Sailaja B.B.V. Method development and validation of assay and dissolution methods for the estimation of daclatasvir in tablet dosage forms by reverse phase HPLC. Eur. J. Pharm. Med. Res.2016, 3,356- 364.
- Srinivasu, G; Kumar, K.N.; Thirupathi, C.; Narayana, C.L.; Murthy, C.P. Development and validation of the chiral HPLC method for daclatasvir in gradient elution mode on amylose-based immobilized chiral stationary phase. Chromatographia.2016, 79, 1457-1467.
CrossRef - Nannetti, G.; Messa, L.; Celegato, M.; Pagni, S.; Basso, M.; Parisi, S.G.; Palù, G.; Loregian, A. Development and validation of a simple and robust HPLC method with UV detection for quantification of the hepatitis C virus inhibitor daclatasvir in human plasma. J. Pharm. Biomed. Anal.2017, 134,275-281.
CrossRef - Jiang, H.; Kandoussi, H.; Zeng, J.; Wang, J.; Demers, R.; Eley, T.; He, B.; Burrell, R.; Easter, J.; Kadiyala, P.; Pursley, J.; Cojocaru, L.; Baker, C.; Ryan, J.; Aubry, A.F.; Arnold, M.E. Multiplexed LC-MS/MS method for the simultaneous quantitation of three novel hepatitis C antivirals, daclatasvir, asunaprevir, and beclabuvir in human plasma. J. Pharm. Biomed. Anal.2015, 107,409-418.
CrossRef
- Ariaudo, A.; Favata, F.; De Nicolò, A.; Simiele, M.; Paglietti, L.; Boglione, L.;Cardellino C.; Carcieri, C.; Di Perri, G.; D’Avolio, A. A UHPLC–MS/MS method for the quantification of direct antiviral agents simeprevir, daclatasvir, ledipasvir, sofosbuvir/GS-331007, dasabuvir, ombitasvir and paritaprevir, together with ritonavir, in human plasma. J. Pharm. Biomed. Anal. 2016,125,369- 375.
CrossRef
- Rezk M.R.; Bendas, E.R.; Basalious, E.B.; Karim, I.A. Development and validation of sensitive and rapid UPLC– MS/MS method for quantitative determination of daclatasvir in human plasma: Application to a bioequivalence study. J. Pharm. Biomed. Anal.2016, 128,61-66.
CrossRef
- Shalaby, A.; El-Maamly, M.; Abdel-Gawad, F. M.; M. Aza S.M.; Eldin, A.S.; Spectrophotometric determination of daclatasvir dihydrochloride by ion-pair reaction with bromophenol blue, bromothymol blue and bromocresol green. Chem. Res. J., 2017, 2(6):,163-173.
- Kekan, V.; Gholve, S.; Bhusnure, O.; Development, validation and stability study of UV spectrophotometric method for determination of daclatasvir in bulk and pharmaceutical dosage forms. Int. J. ChemTech. Res., 2017, 10 (5), 281-287.
- Azab, S.M.; Fekry, A.M. Electrochemical design of a new nanosensor based on cobalt nanoparticles, chitosan and MWCNT for the determination of daclatasvir: a hepatitis C antiviral drug. RSC. Adv. 2017, 7,1118-1126.
CrossRef - Aboul-Enein, H. Y.; Sun, X. X.; Sun, C.J. Ion selective PVC membrane electrode for the determination of methacycline hydrochloride in pharmaceutical formulation. Sensors. 2002, 2(10), 424-431.
CrossRef
- Khalil, S.; EL-Ries, M. A. Ion – selective electrode for the determination of prenalterol. Talanta.2003, 59, 1259-1266.
CrossRef
- Hassan, S. S. M.; Abou-Sekkina, M. M.; El-Ries, M. A.; Wassel, A. A. Polymeric matrix membrane sensors for sensitive potentiometric determination of some β-blockers in pharmaceutical preparations. J. Pharm. Biomed. Anal.2003, 32, 175–180.
CrossRef - Ma, T.S.; Hassan, S.S.M. Organic analysis using ion selective electrodes, Vol. I and II, Academic Press, London, 1982.
- ICH Technical requirements for registration of pharmaceuticals for human use, Complementary Guidelines on Methodology. Washington, DC, 1996, 13.
- Miller JC, Miller JN. Statistics for Analytical Chemistry 3rd ed. Ellis Horwood-Prentice Hall, Chichester. 1993.
Accepted on: March 01, 2018


ISSN Online: 2231-5039

![]()


