Quantitative structure-property relationship modelling of distribution coefficients (logD7.4) of diverse drug by sub-structural molecular fragments method
DOI : http://dx.doi.org/10.13005/ojc/310414
Download this article as:
![]()
Quantitative structure-property relationship (QSPR) for estimating the distribution coefficients (logD7.4) of 300 diverse drugs developed using sub-structural molecular fragments (SMF) method. Forward and backwards stepwise regression variable selection and multi-linear regression (MLR) combined to describe the effect of molecular graph on the logD7.4 according to the QSPR method. Finally, a QSPR model is selected based on leave-one-out cross-validation and its prediction ability is further tested on 50 representative compounds excluded from model calibration. The prediction results from the MLR model are in good agreement with the experimental values. The predictive power and robustness of the QSPR model were characterized by the statistical validation.
KEYWORDS:Diverse drug; logD7.4; MLR; QSPR; SMF method
Introduction
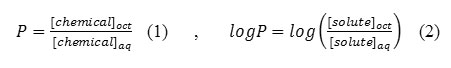
The most common physicochemical descriptor is the molecule’s partition coefficient in an octanol/water system. As emphasized previously, the drug will go through a series of partitioning steps: (a) leaving the aqueous extracellular fluids, (b) passing through lipid membranes, and (c) entering other aqueous environments before reaching the receptor. In this sense, a drug is undergoing the same partitioning phenomenon that happens to any chemical in a separatory funnel containing water and a nonpolar solvent such as hexane, chloroform, or ether. The partition coefficient (P) is the ratio of the molar concentration of chemical in the non-aqueous phase (usually 1-octanol) versus that in the aqueous phase (Eq. 1). For reasons already discussed, it is more common to use the logarithmic expression (Eq. 2).
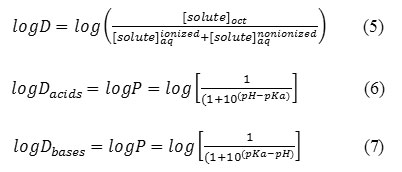
The difference between the separatory funnel model and what actually occurs in the body, is that the partitioning in the funnel will reach an equilibrium at which the rate of chemical leaving the aqueous phase and entering the organic phase will equal the rate of the chemical moving from the organic phase to the aqueous phase. This is not the physiological situation. The absorption of drugs is very important in rational drug design. Indeed, drugs have to cross a series of barriers either by a passive diffusion or by a carrier-mediated uptake. The 1-octanol/water partition coefficient, logP, is accepted as one of the principal parameters to evaluate lipophilicity of chemical compounds that, to a large degree, determines these pharmacokinetic properties of drugs. Note that dynamic changes are occurring to the drug, such as it being metabolized, bound to serum albumin, excreted from the body, and bound to receptors. The environment for the drug is not static. Upon administration, the drug will be pushed through the membranes because of the high concentration of drug in the extracellular fluids relative to the concentration in the intracellular compartments. In an attempt to maintain equilibrium ratios, the flow of the drug will be from systemic circulation through the membranes onto the receptors. As the drug is metabolized and excreted from the body, it will be pulled back across the membranes, and the concentration of drug at the receptors will decrease. Equations 1 and 2 assume that the drug is in the non-polar state. A large percentage of drugs are amines whose pKa is such that at physiological pH=7.4, a significant percentage of the drug will be in its protonated, ionized form. A similar statement can be made for the HA acids (carboxyl, sulfonamide, imide) in that at physiological pH, a significant percentage will be in their anionic forms. An assumption is made that the ionic form is water-soluble and will remain in the water phase of an octanol /water system. This reality has led to the use of log D, which is defined as the equilibrium ratio of both the ionized and un-ionized species of the molecule in an octanol/water system (Eq. 5). The percent ionization of a drug is calculated by using equation 3 for HA acids and equation 4 for BH+ acids.

The percent ionization of ionized HA acids and BH protonated amines can be estimated from Equations 3 and 4 and the logD from Equations 6 and 7, respectively.
Because much of the time the drug’s movement across membranes is a partitioning process, the partition coefficient has become the most common physicochemical property 1-3. It is now realized that the n-octanol/water system is an excellent estimator of drug partitioning in biological systems. The distribution coefficients of organic compounds calculated using ALOGPS program by Igor V. Tetko 4,5.
In this article, at first, a quantitative structure–property relationship model for estimation of distribution coefficients at pH=7.4 of diverse drug is developed. These quantitative structure property relationships (QSPR) are generally used to correlate the biological, chemical, or physical property of a compound with its physico-chemical characteristics 6,7.
In our previous papers, we reported on the application of QSPR techniques in to develop a new, simplified approach to prediction of compounds properties 8-13. For the first time, we applied the sub-structural molecular fragment (SMF) method for modeling the logD7.4 of diverse drug. The goal of this study is to develop a SMF method and the related software tools, to model relationships between the structure of 300 drugs and their distribution coefficients. This method is based on to represent a molecule by its fragments and on to calculate their contributions to a given property. It uses two types of fragments: (i) the sequences of atoms and/or bonds (atom and/or bond paths up to specified maximal length) and (ii) “augmented” represented by a selected atom and/or bonds with its environment. In fact, it represents an extension of empirical methods used to calculate physical or chemical properties of molecules using atomic or bond increments.
Data and methods
Experimental Data
All logD7.4 data for all 300 drugs were taken from the literature 14. The logD7.4 of these drugs are deposited in journal log as supplementary data. The values were used as dependent variable in the following analyses and the values ranged from -6 to 6.1.
Molecular modeling and fragment generation
All calculations were run on a Dell Inspiron N5010 laptop computer with Intel® Core™ i7 processor with Windows 7 operating system. The molecular structures of all compounds were drawn into the HyperChem 8.0 program and pre-optimized using MM+ molecular mechanics method. The final geometries of the minimum energy conformation were obtained by more precise optimization with the semi-empirical AM1 method, applying a root mean square gradient limit of 0.01 (Kcal.mol-1. Å-1). Then, the resulted geometries were put in to ISIDA/QSPR (version 5.76.003, 2010) to calculate sub-structural molecular fragments. The ISIDA/QSPR program realizes the sub-structural molecular fragments (SMF) method for QSPR/MLRA modeling. The SMF method is based on the splitting of molecular graph into fragments, and on the calculation of their contributions to a given property (logD7.4).
Computational procedure
Sub-structural molecular fragments
The ISIDA/QSPR program realizes the sub-structural molecular fragments (SMF) method15-21. which is based on the splitting of a molecular graph on fragments (sub-graphs), and on the calculation of their contributions to a given property Y. Two classes of fragments are used: “sequences” (I) and “augmented” (II). Three sub-types AB, A and B are defined for each class. For the fragments I, they represent sequences of atoms and bonds (AB), of atoms only (A), or of bonds only (B). Shortest or all paths from one atom to the other are used. For each type of sequences, the minimal (nmin) and maximal (nmax) number of constituted atoms must be defined. Thus, for the partitioning I(AB, nmin – nmax), I(A, nmin – nmax) and I(B, nmin – nmax), the program generates “intermediate” sequences involving n atoms (nmin ≤ n ≤ nmax). In the current version of ISIDA/QSPR, nmin ³ 2 and nmax ≤ 15. An “augmented” represents a selected atom with its environment including both neighboring atoms and bonds (AB), or atoms only (A, without taking hybridization of neighbors into account, or Hy, where hybridization of neighbors is accounted for), or bonds only (B).
Variable selection procedures
Generally, generated pool of descriptors is much larger than the number of compounds in the training set; therefore procedures for selecting variables should be applied to build statistically significant multi-linear regressions. In ISIDA, a combination of forward and backward stepwise variable selection procedures is used.
Filtering stage. The program eliminates variables Xi which have small correlation coefficient with the property, Ry,i < R0y,i, and those highly correlated with other variables Xj (Ri,j > R0i,j), which were already selected for the model. In this work, the values R0y,i = 0.001, … and R0i,j = 0.75, … were used.
Forward stepwise pre-selection stage. The suite of forward and backward stepwise algorithms has been used for variable pre-selection in ISIDA/QSPR studies by the variable selection suite (VSS) program. Three algorithms for forward stepwise variable selection are based on the calculations of correlation coefficients and subtractions. This is an iterative procedure, on each step of which the program selects one Xi (two Xi and Xj or three variables Xi , Xj and Xk) maximizing the correlation coefficient Ry,j (Ry,ij or Ry,ijk) between Xi (Xi and Xj or Xi , Xj and Xk) and dependent variable Y. At the first step (s = 1), the modeled property for each compound is taken as its experimental one Ys = Y. At each next step s, as the property value Ys is used residual Ys = Ys-1 – Ycalc, where Ycalc = c0 + ciXi (Ycalc = c0 + ciXi + cjXj or Ycalc = c0 + ciXi + cjXj + ckXk) is calculated property by the one-variable (two- or three-variables) model with selected variable Xi (variables Xi and Xj or Xi, Xj and Xk). This loop is repeated until the number of variables k reaches a user-defined value; in this work, k was analyzed from 0.1n to 0.9n, where n is the number of the molecules in the training set.
Backward stepwise selection stage. The final selection is performed using backward stepwise variable selection procedure based on the t statistic criterion. Here, the program eliminates the variables with low ti = ci/si values, where si is standard deviation for the coefficient ci at the i-th variable in the model. First, the program selects the variable with the smallest t < t0, then it performs a new fitting excluding that variable. This procedure is repeated until t ³ t0 for selected variables or if the number of variables reaches the user’s defined value. Here, t0, the tabulated value of Student’s criterion, is a function of the number of data points, the number of variables, and the significance level. Default value of the t0 is 1.96, it can be analyzed from 1.96 to 3.9.
Multi-linear regression model
The modeled physical or chemical property Y can be quantitatively calculated accounting for contributions of fragments using linear (3) fitting equations.
Y= Ao + Σi Ai x Ni +Γ, Additive Model (8)
where ai is a fragment contributions, Ni is the number of fragments of i type. The ao term is fragment independent and term is external descriptors (e.g., topological, electronic, etc.) by default . Contributions of ai are calculated by minimizing a functional
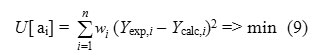
where n is the number of the compounds in the training set, wi the weight accounting for the accuracy of the experimental data, Yexp and Ycalc are, respectively, experimental and calculated according to (3) property values. The equation (3) represents calculation of property Y by using additive contributions of fragments. The coefficients of the equation (3) being optimized at the training stage are then used to estimate Y values of the compounds from the test set or to screen external databases of real or virtual compounds.
Validation of QSPR Models
In ISIDA/QSPR calculations, each initial data set was split into two sub-sets: training (250 compounds) and test (50 compounds) sets. The QSPR models were built on the training set followed by “prediction” calculations for the test set. Before a QSPR model is used to predict the properties for new compounds, it should be validated both internally and externally to ensure that the built model is robust, reliable, stable and predictive. In the current work, several statistic terms such as squared correlation coefficient R2 for the training set fitness and Q2ext for the external predictive ability, leave-one-out (LOO) cross-validated Q2LOO and root mean square error (RMSE) were used to assess the internal and external predictive ability of the proposed model. The corresponding statistical parameters were defined as:
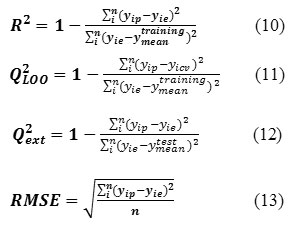
Where i represents ith molecule, yie is the desired output (experimental property),yip the actual output, yicv is the output of leave-one-out cross-validation, ytrainingmean and y test mean are the mean values of yip for the training and test sets, respectively. N is the number of compounds in the training or test set. In addition, the built model was also validated externally using the test set compounds due to the fact that the best way to evaluate the predictive ability of a QSPR model is its validation using compounds not included in the training set with known properties.
Results and Discussion
The octanol-water distribution coefficient is a physical property used extensively to describe a chemical’s lipophilic or hydrophobic properties. It is the ratio of a chemical’s concentration in the octanol-phase to its total concentration in the aqueous-phase of a two-phase system at equilibrium. The ISIDA program has been developed to establish structure-property relationships based on the SMF partitioning. The program inputs data in the SDF format containing structural and properties information22. The graphical interface of ISIDA allows to attribute data to the learning or to the validation sets and to set up the parameters of calculations (type of fragments, minimal and maximal number of atoms/bonds in the sequences, type of equation). A QSPR is a mathematical relationship between a property of a chemical, in this case logD7.4, and molecular fragments of the chemical. The fragments are obtained from the structure of the chemical structure. First, a training set of distribution data is used to statistically establish the relationship between logD7.4and the molecular fragments. The QSPR can then be used to predict the logD7.4 of untested chemicals for which the fragments are known. Thus, the fragments selected to describe this process in a QSPR should be able to describe the relative
affinities of drugs for distribution between n-octanol and water. To establish relationships between the structure of drugs and their distribution properties, we used the recently developed sub-structural molecular fragments (SMF) method, which is based on the representation of the molecular graph by fragments and on the calculation of their contributions to a given property. The sequences fragments represent sequences of atoms and bonds (AB), of atoms only (A), or of bonds only (B). The length of sequences varies from 2 to 15 atoms. For any sequence containing from nmin to nmax atoms, all fragments of nmax, nmax-1, nmax-2,…, nmin length are considered. In this work, the I(AB, 2-10) decomposition scheme corresponds to thirty sequences containing 10, 9, 8, 7, 6, 5, 4, 3 and 2 atoms and linking bonds are selected. To select the most relevant fragments to the distribution coefficients, 13139 fragments calculated by ISIDA for each compound were used as the inputs for stepwise regression. The 250 Drugs were selected for the training set and 50 drugs for the test set. The optimum subset size was reached when adding another fragment did not improve the performance of the model significantly. Through this procedure, the 30-parameter model was selected as the best model. It can be described at Table 1. The quality of a QSPR model is generally expressed by its fitting ability and prediction ability, and the latter one is more important. The statistical parameters for the test set were Q2ext of 0.9486 and root mean square error of prediction (RMSE) of 0.4716.
Table 1: Set of fragments, Coefficients (Ai) of the equation, standard deviations for coefficients and their t-Test for logD = Ao +Σ(Ai x Ni)
|
Variable[i] |
Contribution (Ai) |
Standard deviation (∆A) |
t-Test |
| A0 |
0.71699 |
0.103 |
6.91 |
| H-O-C=O |
-2.09574 |
0.0801 |
26.17 |
| C-C=C |
0.131227 |
0.00838 |
15.66 |
| C-C-C-H |
0.028944 |
0.00212 |
13.63 |
| H-C-O-H |
-0.637652 |
0.0382 |
16.68 |
| H-N |
-0.390651 |
0.0333 |
11.73 |
| H-O-C-C-C=C-O |
-1.864208 |
0.212 |
8.78 |
| H-C-C-N-C-H |
-0.038338 |
0.0039 |
9.83 |
| C=C-Cl |
0.589158 |
0.0648 |
9.1 |
| N-C-N-C=N |
-2.129112 |
0.221 |
9.62 |
| H-N-C-C-C-C=C-C-O |
-1.081628 |
0.174 |
6.23 |
| C-N-C-C-N-C-C-C-N |
1.371874 |
0.209 |
6.57 |
| H-C-C=C-C-N-N |
-0.987005 |
0.191 |
5.17 |
| C-C=N-C-N-C-C-H |
0.249995 |
0.048 |
5.2 |
| H-C=C-C-S-N-H |
-1.106389 |
0.198 |
5.6 |
| H-C-C=C-N-C-N-C-H |
-0.690742 |
0.129 |
5.34 |
| C=C-C-N-S=O |
-0.907277 |
0.147 |
6.19 |
| C-N=C-N |
0.395616 |
0.0745 |
5.31 |
| H-C-C-C-C-C-N-C=O |
0.687428 |
0.127 |
5.4 |
| C-C=C-C=C-C-N-C |
0.959077 |
0.171 |
5.6 |
| H-N-C=C-C-O |
0.716806 |
0.131 |
5.46 |
| H-O-C-C-C-C-C-C=O |
-0.952659 |
0.227 |
4.19 |
| H-C-N-C-C-C-C=C-H |
-0.065865 |
0.0199 |
3.31 |
| H-C-C-C-N-C-C-N=C-H |
-0.450089 |
0.0879 |
5.12 |
| C-C-N=N |
0.642752 |
0.139 |
4.63 |
| H-O-C-C-O-C=C-O |
-1.32722 |
0.302 |
4.39 |
| N=C-C=C-O |
-0.831721 |
0.294 |
2.83 |
| Cl-C=C-O |
-1.498618 |
0.363 |
4.13 |
| H-C-C-C-C=C-C=C-N |
0.636188 |
0.19 |
3.35 |
| C=C-N-C-C-C-O-H |
2.005056 |
0.352 |
5.7 |
| H-C-N-C-C=O |
-0.246307 |
0.0494 |
4.99 |
When a compound is split into constitutive fragments, the fragments contributions to the distribution coefficients (logD7.4) or to any other physical or chemical property are calculated using linear fitting equation:
logD = Ao +Σ(Ai x Ni) (14)
Table 2: Statistical parameters of QSPR-MLRA model
|
n |
R2 and Q2loo,ext |
SD |
RMSE |
F |
|
|
All data |
300 |
0.9359 |
0.475 |
0.4890 |
4348 |
|
train |
250 |
0.9329 |
0.492 |
0.4897 |
3450 |
|
test |
50 |
0.9486 |
0.481 |
0.4716 |
Here, Ai is contribution of fragment, and Ni is the number of fragments of i type. The Ao term is fragment independent. The fragments contributions as fitted coefficients in the equation (14) at the learning stage are used to predict logD7.4 for the compounds from the validation set. Set of fragments, coefficients of the equation, standard deviations for coefficients and their t-test for equation (14) are shown in Table 1. This shows that the logD7.4 increases with positive coefficients, and decreases logD7.4 with negative coefficients, respectively. On the other hand, the signs of the coefficients were used in order to determine the influence of each variable, positive or negative, on the logD7.4. The experimental, predicted and residuals data for training set (250 compounds) and test set (50 compounds) are shown in supplementary data (see Figure 1 and 2). The statistical results of training and external validation of model are shown in Table 2. In general, molecular fragments correlate well with physical properties that are dependent on molecular volume, shape and size as each index incorporates a summation of terms representing fragments of the molecules. Thus in the QSPR here, one sees a general increase in absorbability as molecular size increase, reflected in increases in fragments. Thus in a diverse drugs, distribution increases with increasing chain length data and Van der Waals forces. In molecular structures that have ionized functional groups distribution coefficients decreases, because concentration of drug increases in water and decreases in octanol.
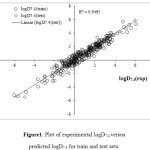 |
Figure 1: Plot of experimental logD7.4 versus predicted logD7.4 for train and test sets. |
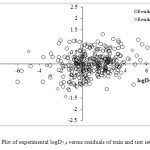 |
Figure 2: Plot of experimental logD7.4 versus residuals of train and test sets. |
Conclusion
The applicability of ISIDA-QSPR for developing a logD 7.4 was demonstrated using a set of sub-structural molecular fragments calculated from molecular structure. In this work, MLR modeling method was used to study the quantitative structure-property relationship of logD7.4 for drug set. We can conclude that: firstly, the prediction results indicate that the multi-linear regression modeling method can improve the prediction accuracy significantly for this large data set; secondly, the models developed in this work provide an accurate model that can be used to predict the logD7.4 from the molecular structure only. In this case the distribution occurs between water and n-octanol. Distribution of drug between polar and non-polar solvent mainly involves hydrophilic and hydrophobic interactions. In this paper, new QSPR model have been developed for predicting the logD7.4 of a diverse set of drugs from the molecular structure alone. The obtained results show that MLR method could model the relationship between logD7.4 and their sub-structural fragmental. By performing model validation, it can be concluded that the presented model is a valid model and can be effectively used to predict the logD7.4 of drugs with an accuracy approximating the accuracy of experimental logD7.4 determination. It can be reasonably concluded that the proposed model would be expected to predict logD7.4 for new drug for which experimental values are unknown. The main advantages of fragment descriptors lie in the simplicity of their computation, the easiness of their interpretation as well as in efficiency of their applications in similarity searches and SAR/QSAR/QSPR modeling.
Acknowledgement
We wish to thank Prof. V. P. Solovev and Prof A. Varnek, for their precious help in use of ISIDA-QSPR software.
Appendix A. Supplementary Data
Supplementary data related to this article can be found at …
References
- Grime, J. M. A.; Edwards, M. A.; Rudd, N. C.; Unwin, P.R. Proc. Nat. Acad. Sci. 2008, 105:14277- 14282.
- Benfenati, E.; Gini, G.; Piclin, N., Roncaglioni, A.; Vari, M.R. Chemosphere 2003, 53:1155-1164.
- Mannhold, R., Poda, G. I., Ostermann, C. E.; Tetko, I.V. J. Pharm. Sci. 2009, 98, 861-893.
- Tetko, I. V.; Bruneau, P. J. Pharm. Sci. 2004, 93(12), 3103-3110.
- Tetko, I. V.; Poda, G. I. J. Med. Chem. 2004, 47, 5601-5604.
- Kandakatla, N.; Ramakrishnan, G.; Karthikeyan, J.; Chekkara, R. Orient. J. Chem. 2014, 30(3), 1083-1098.
- Varma, R. G; Wagde, R. Orient. J. Chem., 2013, 29(4), 1621-1626.
- Ghasemi, J.; Saaidpour, S. Chem. Pharm. Bull. 2007, 55, 669-674.
- Ghasemi, J.; Saaidpour, S.; Brown, S. D. J. Mol. Struct. (Theochem) 2007, 805, 27-32.
- Ghasemi, J.; Saaidpour, S. Anal. Chim. Acta 2007, 604, 99–106.
- Ghasemi, J.; Saaidpour, S. J. Chromatogr. Sci. 2009, 47, 156-163.
- Ghasemi, J.; Saaidpour, S. QSAR Comb. Sci. 2009, 28,1245-1254.
- Saaidpour, S. Orient. J. Chem. 2014, 30(2), 793-802.
- Avdeef, A., Absorption and drug development: solubility, permeability, and charge state, 2nd ed. John Wiley & Sons, Inc., (2012).
- Solovev, V. P.; Varnek A.; Wipff, G. J. Chem. Inf. Comput. Sci. 2000, 40, 847-858.
- Varnek, A.; Wipff, G.; Solovev, V. P. Solvent Extr. Ion Exc. 2001, 19, 791-837.
- Varnek, A.; Wipff, G.; Solovev, V. P.; Solotnov, A. F. J. Chem. Inf. Comput. Sci. 2002, 42 (4) , 812-829.
- Solovev V. P.; Varnek, A. J. Chem. Inf. Comp. Sci. 2003, 43 (5) , 1703-1719.
- Solovev V. P.; Varnek, A. Russ. Chem. Bull. 2004, 53, 1434-1445.
- Varnek, A.; Solovev, V. P. Comb. Chem. High T. Scr. 2005, 8(5), 403-416.
- Varnek, A.; Fourches, D.; Hoonakker F.; Solovev, V. P. J. Comput. Aided Mol. Des. 2005, 19, 693-703.
- Dalby, A.; Nourse, J.G.; Hounshell, W.D.; Gushurst, A. K. I.; Grier, D. L.; Leland, B. A.; Laufer, J. J. Chem. Inf. Comput. Sci. 1992, 32, 244-255.


![]()


