Complex Permittivity and Permeability Measurements and Numerical Simulation of carbonyl iron rubber in X-Band frequency
DOI : http://dx.doi.org/10.13005/ojc/300203
Download this article as:
![]()
Recognizing the importance of an adequate characterization of radar absorbing materials (RAM), and consequently their development, the present study aims to contribute for the establishment and validation of experimental determination and numerical simulation of complex permittivity and permeability of electromagnetic materials, using for this a carbonyl iron was seventy percent of the mass concentration. The present work branches out into two related topics. The first one is concerned with the implementation of a computational modeling to predict the behavior of electromagnetic materials in confined environment by using electromagnetic three-dimensional simulation. The second topic re-examines the Nicolson-Ross-Weir mathematical model to retrieve the constitutive parameters (complex permittivity and permeability) of a homogeneous sample (carbonyl iron) from scattering coefficient measurements. The measured and calculated results show a good convergence that guarantees the application of the used methodologies for the characterization of carbonyl iron rubber in x-band frequency.
KEYWORDS:electric permittivity; magnetic permeability; iron carbonyl rubber; computational modeling
Introduction
Efficient and broadband measurements for complex permittivity, ε*, and permeability, μ*, of materials are of great interest in scientific and industrial applications. Measurement of ε*and μ* in the microwave frequency range finds direct application, for instance, in the study of biological effects of electromagnetic radiation, in ceramic sintering, plastic welding, communications systems, and remote sensing [1]. In this latter case, a good understanding of the dielectric properties of vegetation is vital for the extraction of useful information from the remotely sensed data for earth resources monitoring and management, because the dielectric constant of vegetation has a direct effect on radar backscattering measured by microwave sensors. Concerning sectors of electronic, telecommunication, aerospace industries, and in particular in the research and development of radar absorbing materials (RAM), the knowledge of e* and m* allows to predict the electromagnetic properties of materials via computer simulation. In this case, the simulation is useful for supporting studies related to the RAM processing optimization as well as its utilization for specific purposes.
Computational modeling becomes relevant as long as the simulated results reproduce and anticipate experimentally measured data. Strong interrelation between modeling and experimental contributes to ensure confidence in the computational tool developed for a given application. It is a purpose of computer modeling to reconstruct experimental measurements aiming at the understanding and evaluation of measured parameters, and also to obtain new parameters in different contexts but consistent with the experimental interpretation. In situations in which a modal analysis turns out too complex and difficult to solve, numerical methods are widely used, such as finite element method (FEM), finite difference method (FDM), and particularly specialist tools for three-dimensional electromagnetic simulation in both time and frequency domain on volume and surface meshes, such as the CST Microwave Studio. Particularly, this tool uses in simulations the perfect boundary approximation (PBA) and the thin sheet technique (TST) to increase the modeling precision in comparison with conventional software [2].
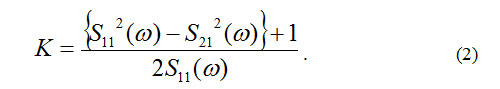
The electromagnetic parameters can be deduced from the scattering parameters [3-7]. For this, the boundaries of the material-under-test (MUT) are defined and afterwards the S parameters can be accurately known. The following equations relates the parameters S11 (scattering parameter related to the radiation emission from port 1 and collect in port 1) and S21 (scattering parameter related to the radiation emission from port 1 and collect in port 2) (Fig. 1) to the reflection and transmission coefficients Γ and Γ, respectively. This equations allow to solve the boundary-condition problem at e = O (e is the line of air) and e= d (d is the sample thickness) (Fig. 1), such that the reflection coefficient can be expressed as Equations 1 and 2 [4,5]:
where
The transmission coefficient is given by Equation 3
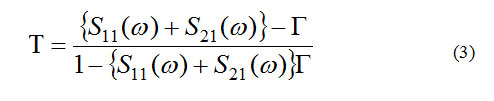
From Equations 1 and 3, auxiliary variables (x and y) are defined as follows (Equations 4 – 7) [4,5]
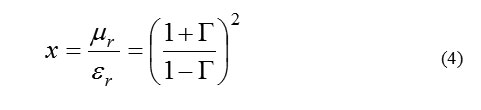
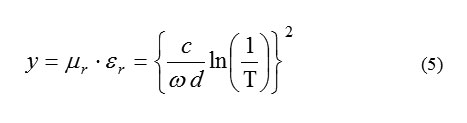
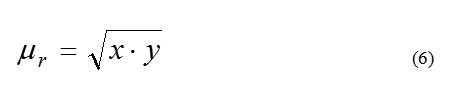
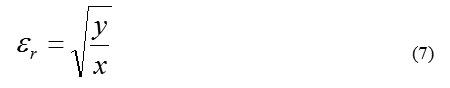
where c = velocity of the light in the free space; μ = relative permeability of material; εr = relative permittivity of material; ω = angular velocity.
For measurements using a rectangular waveguide sample holder, Equations 4 and 5 can be rewritten as Equations 8, 9 and 10 [4, 5]
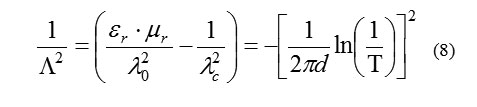
where: λ0 is the free space wavelength and λc the cutoff wavelength of the guide. Since the material is a passive medium the signal of the square root in Equation 1 is determined by the requirement Re(1/Δ)>O. It is also noted that Equations 9 and 10 can be applied for measurements using a coaxial sample holder, for which λc →∞.
![Fig. 1.Wave guide filled with material. (Z0 is the impedance of air, ZS is the impedance of the material, Vn (n= 1, 2, 3…) is the voltage, In (n= 1, 2, 3…) is the intensity, n is the interface between the means, d is the sample thickness and is the thickness of line of air [4,5].](https://www.orientjchem.org/wp-content/uploads/2014/06/Vol30_No2_Comp_Adriano_fig1-150x150.jpg) |
Fig 1: Wave guide filled with material. (Z0 is the impedance of air, ZS is the impedance of the material, Vn (n= 1, 2, 3…) is the voltage, In (n= 1, 2, 3…) is the intensity, n is the interface between the means, d is the sample thickness and is the thickness of line of air [4,5]. Click here to View Figure |
One methodology that makes use of the scattering parameters S11 and S21 to calculate the mentioned complex parameters of samples is named of Nicolson-Ross-Weir (NRW) [5, 6]. The NRW modeling is the most commonly used method to perform the calculation of complex permittivity and permeability of materials. This modeling has the advantage of being non-interactive (no interactive procedure is needed), as required in the Baker-Jarvis method [8], for example. Besides this, the NRW modeling is applicable for coaxial line and rectangular waveguide cells. On the other side, it is known that the NRW can diverge for low-loss materials at frequencies corresponding to integer multiples of one half wavelength in the sample [5, 6]. At this particular frequency, the magnitude of the measured S11 parameter is particularly smaller (thickness resonance) and the S11 phase uncertainty becomes larger. This behavior can lead to the appearance of inaccuracy peaks on the permittivity and permeability curves.
Considering the importance of knowledge of the complex permittivity and permeability of materials aiming the adequate characterization of them and new developments, the present work presents a study involving measured and simulated complex permittivity and permeability of a carbonyl iron was 70% of the mass concentration test sample 2mm. In this study the experimental complex parameters were retrieved using the NRW modified.
In order to design and synthesize a material that is absorber to a certain electromagnetic wave within a frequency range, it is necessary to arrange a process that controls the slab thickness and the material electrical and magnetic characteristics (permittivity and permeability, respectively). In a microscopic scale, for the microwave range, the incoming wave drives the material molecules into oscillation, generating in a net temperature gradient. This results into the power dissipation as heat.
Iron carbonyl and ferrite are some common materials used in composite absorbers. They are usually employed to control the magnetic characteristics of composites [8, 9, 10]. Ferrites are ceramic substances possessing iron as main element, and are the basis for the materials here analyzed.
Materials and Methods
The preparation of composites
Carbonyl iron powder was chosen as absorbing filler and silicon rubber was used as polymeric matrix. Both components are commercially available. The densities of the employed carbonyl iron and silicon matrix are 7.8 and 1.28 g/cm3, respectively. The carbonyl iron contents into the processed elastomeric RAM were 70% in mass concentration, with 2mm. The elastomeric RAM was prepared by conventional mechanical mixture of the two raw materials. The homogeneous mixtures were molded in a cavity of X-band waveguides. The polymer curing was performed at room temperature for about 24 hours.
Scanning electron microscopy (SEM) examinations were performed employing a DSM950 Zeiss, without special preparation of the samples, and X-ray diffraction (XRD) patterns of carbonyl iron powder were obtained using CuKα radiation from a PW1830 Philips X-ray diffractometer and the diffraction points were recorded from 10 to 90°.
Experimental Measurements
In this study the experimental methodology was performed according to the steps depicted in Fig. 2. For this, it was assembled a setup including an automatic vector network analyzer (VNA) HP8510C connected as a source and measurement equipment. During calibration, standard setup values must be stored, so as when making calibration the measured and reference values are compared to characterize measurement systematic errors [4]. The calibration also establishes the reference planes for the measurement test ports. In Fig. 2 is shown the calibration X-band kit used in this work.
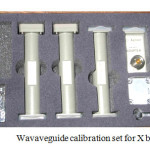 |
Fig 2: Wavaveguide calibration set for X band. Click here to View Figure |
To determine the complex permittivity and permeability, via S-parameters (S11 and S21), it was used the two-port transmission/reflection approach, with a material-under-test (RAM sample with 2mm in thick) of smooth flat faces and filling completely the fixture cross section, being placed inside a rectangular waveguide (Fig. 4). The sample holder (Figure 4) is a precision waveguide section of 5.5118 in thick length that is provided with the calibration kit. When measuring the scattering parameters, the off set, placed between ports 1 and 2, is closed with the sample holder. The adapter of port 1 is taken as the reference plane (Fig. 3).
After the S-parameters measurements, the complex parameters (ε* and μ *) were calculated according to the NRW modeling.
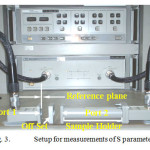 |
Figure: Setup for measurements of S parameters. Click here to View Figure |
Numerical Simulations
In this case, the electromagnetic parameters were deduced from a scattering matrix as shown in Figs 4 and 5. The used complex parameters for the RAM sample were calculated based on the NRW [4].
Afterwards, from the magnitude and phase values of the calculated parameters, the complex parameters were retrieved according to Equations 12 and 13.
Equally applied to rectangular and cylindrical waveguiding systems, the explicit NRW procedure is formulated by (1)-(10), through which ε* and μ* are extracted from the reflection and transmission coefficients, and , determined in turn from the measurable parameters S11 and S21 according to (2) and (3). This calculation, however, has two main problems. The first arises from the term (1+Γ)/(1-Γ) in the right-hand side in (9), which can be expressed as.
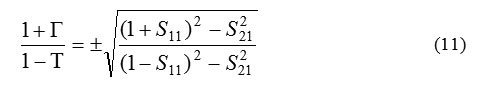
It is apparent that (11) is algebraically unstable when S11 approaches zero, and hence S21 goes to unity for low-loss samples. Also, the uncertainty in the phase of S11 greatly increases when |S11| →0. The ill-conditioned behavior of the scattering parameters manifests itself at frequencies corresponding to multiples of one-half wavelength in the sample. To see this, we rewrite S11 and |S21| in the form
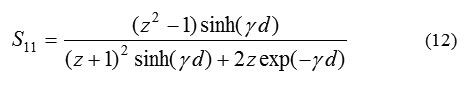
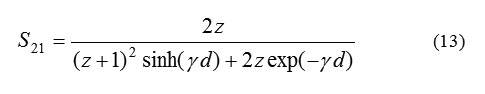
where z = (Z – Z0) / (z + Z0) is the normalized complex impedance of the sample. Writing the propagation factor as Y = a jβ , where a is the attenuation constant and β (= 2∏/ λg) the wavenumber of the incident wave, and allowing for d ≈ m (λg/2), m integer then βd ≈ m∏, yielding S11 ˜ sin (ad) with S21 ˜ exp (ad). if α→ 0, that is when εr” and μr” simultaneously vanish (a typical condition of low-loss materials), then |S11| → o and |S21|
RESULTS and DISCUSSION
Phase analysis and the SEM morphology
Fig. 4 shows the SEM images of the carbonyl iron. It could be found that the carbonyl iron is a spheric shape. The particle size of the carbonyl iron powder ranges from 1-10μm, most of the particles are in the range of 4-7μm. Fig. 5 shows the XRD patterns of the carbonyl iron, and it is confirmed that single cubic iron (identified by JCPDS 06-0696).
 |
Fig 4: The SEM photographs of carbonyl iron. |
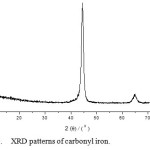 |
Fig 5: XRD patterns of carbonyl iron. |
The complex permeability and permittivity
It was utilized, a sample of carbonyl iron flat face with 2mm in thickness, is measured in an 8510C vector network analyzer and calibration kit illegal for WR-90 Agilent Technologies, completely filling your area transverse (0.40×0.90 in2) with the TE10 dominant mode of propagation of the left door. Used to retrieve the permittivity and permeability, the data measured scattering parameters (S11 and S21) are shown in Fig. 6. A waveguide simulation setup is used to validate the method NRW. To understand this difference is important to mention that the simulation configuration depicted in Fig. 6 takes place in an ideal environment, where temperature, humidity, misalignment and air gap effects are not taken into account. This behavior is attributed to the actual interaction of the electromagnetic wave with the material in phase (Fig. 7), considering that the simulation takes place in an ideal environment, as already mentioned. In the simulation, relative values of permittivity εr = 6.97 – j0.029 μr = 1.48 – j0.544 are assigned to the test sample, with the waveguide being excited by launching the TE10 dominant mode from the left port. Used to retrieve the permittivity and the permeability, the calculated scattering data are shown in Fig. 6.
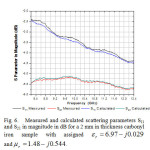 |
Fig 6: Measured and calculated scattering parameters S11 and S21 in magnitude in dB for a 2 mm in thickness carbonyl iron sample with assigned εr = 6.97 – j0.029 and μr = 1.48 – j0.544. Click here to View Figure |
When a phase inversion appears on low loss materials, dimensions are analyzed properties of the constituent materials. This resonance effect is also manifest in the phase plot (Fig. 7), where a pair of ant symmetric curves intercepts the horizontal axis at the resonance frequency.
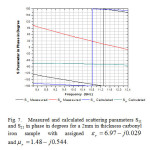 |
Fig 7: Measured and calculated scattering parameters S11 and S21 in phase in degrees for a 2mm in thickness carbonyl iron sample with assigned εr = 6.97 – j0.029 and μr = 1.48 – j0.544.Click here to View Figure |
Then, based on the NRW procedure, the S parameters were used to determine ε* and μ*, which are given in Figs. 8 and 9, respectively. In a general way, these figures show that the agreement between measured and simulated quantities is quite satisfactory, except for the calculated value of ε1.
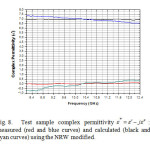 |
Fig 8:Test sample complex permittivity ε* = ε’ – jε”: measured (red and blue curves) and calculated (black and cyan curves) using the NRW modified. Click here to View Figure |
 |
Fig 9:Test sample complex permeabilityμ* = μ’ – jμ”: measured (red and blue curves) and calculated (black and cyan curves) using the NRW modified. Click here to View Figure |
CONCLUSION
The comparative study of the electromagnetic parameters of a carbonyl iron slab shows good agreement between measured and simulated complex permittivity and permeability, which were retrieved using the Nicolson-Ross-Weir modified. From these results it is possible to conclude that the used procedure guarantees an accuracy experimental characterization of materials and also their simulation. From the results obtained in the present study it is also observed that the tested procedure proved to be robust and no anomalies were noticed because resonance in phase for the 2 mm in thickness sample occurs above 10.5 and 11.3 GHz. The results overcome a possible disadvantage of using the NRW modeling, as cited previously in this text.
References
- B. K Chung, Dielectric constant measurement for thin material at microwave frequency, Prog. Electromagn. Res. PIER, vol., 75, pp. 239-252, 2007.
- CST M. S. Version 3 Getting Started, Jan.2001, CST Computer B.-K Chung, Dielectric constant measurement for thin material at microwave Simulation Technology.
- A. L. De Paula, M. C. Rezende, J. J. Barroso, J. J. Pereira and E. L. Nohara, Comparative Study of S parameters of the Teflon® obtained experimentally and by Electromagnetic Simulation. Symposium on Operating Systems Application Areas of Defense. São José dos Campos, Brazil, 2008.
- American Society for Testing and Materials. ASTM D5568-1: Standard Test Method for measuring Relative Complex permittivity and Relative Magnetic Permeability of Solid Materials at Microwave Frequencies. West Conshohoken, PA: ASTM, 2001.
- A. M. Nicolson and G. F. Ross, Measurement of the Intrinsic Properties of Materials by Time Domain Techniques. IEEE Trans. Instrum. Meas., Vol. IM 19, pp.377-382, Nov. 1970.
- W. B. Weir, Automatic Measurement of Complex Dielectric Constant and Permeability at Microwave Frequencies, IEEE Proceedings., vol. 62, pp. 33-36, Jan. 1974.
- Agilent Technologies. Measuring the dielectric constant of solids with the HP 8510 network analyzer. Technical Overview 5954-1535.USA, 10p., 1985.
- J. Baker-Jarvis, M. D. Janezic, J. H. Grasvenor Jr., and R. G. Geyer, Transmission/Reflection and Short-Circuit Line of Methods for Measuring Permittivity and Permeability. NIST Technical Note 1355-R. Colorado, 1993.
- Y. Konishi and H. Komori. The performance of absorbing materials with ferrite grains. In: Microwave Optical and Technology Letters., v.16, p. 156-159. 1997.
- E. P. Wohlfahrt. Ferromagnetic materials: a handbook on the properties of magnetically ordered substances. Ed. North-Holland., 1980.
- A. M. GAMA, M. C. REZENDE. Proceedings of the IEEE, v. 1, p. 322-325, 2005.
- A. M. GAMA, M. C. REZENDE. Journal of Aerospace Technology and Management v. 2, p. 59-62, 2010.
- A. M. GAMA, M. C. REZENDE,C. C. DANTAS. Journal of Magnetism and Magnetic Materials, v. 323, p. 2782-2785, 2011.


ISSN Online: 2231-5039

![]()


