Synthesis, Spectral Characterization and X-ray Diffraction Studies of Cerium Complex of Glipizide, An Oral Antidiabetic Drug
Om Prakash1*, Bal Krishan1 and George Jacob2
1Department of Chemistry, Saifia Science College, Bhopal - 462 001, India.
2Blyth Academy, Department of Science, Lawrence Park, 3284, Toronto, Ontario, Canada.
Corresponding author E-mail: omprakashchouhan84@gmail.com
Glipizide is a second generation sulphonylurea with promising hypoglycemic activity. It acts by stimulating the release of insulin from β-cells of pancreas. The present paper describes the synthesis and characterization of cerium complex with Glipizide. The conductometric titration using monovariation method reveal that complex is non-ionic and ML2 type which was further confirmed by Job’s method of continuous variation as modified by Turner and Anderson. The analytical data agree with the molecular formula (C21H26N5O4S)2Ce(OH2)2, that the structure of complex was assigned as octahedral in which ligand molecules lies horizontally joining the central cerium atom. IR, NMR confirms the co-ordination of sulphonyl oxygen on one side and enolic oxygen attached from other side with the metal ion. The structure of complex was proposed on the basis of analytical data, elemental analysis, IR, 1H NMR and X-ray Diffraction studies.
KEYWORDS:Synthesis; complex; IR; 1H NMR; X-ray Diffraction; Glipizide
Download this article as:| Copy the following to cite this article: Prakash O, Krishan B, Jacob G. Synthesis, Spectral Characterization and X-ray Diffraction Studies of Cerium Complex of Glipizide, An Oral Antidiabetic Drug. Orient J Chem 2013;29(2). |
| Copy the following to cite this URL: Prakash O, Krishan B, Jacob G. Synthesis, Spectral Characterization and X-ray Diffraction Studies of Cerium Complex of Glipizide, An Oral Antidiabetic Drug. Orient J Chem 2013;29(2). Available from: http://www.orientjchem.org/?p=22258 |
Introduction
Glipizide is one of the most commonly prescribed drugs for treatment of type 2 diabetes mellitus1. It is about 100 times more potent than tolbutamide in evoking pancreatic secretion of insulin2. It is absorbed rapidly, uniformly with good mean oral bioavailability. It offers several advantages such as swift and short action with a very high selectivity 3-4. It is a white or almost white crystalline, odourless powder, practically tasteless, insoluble in water and alcohols, but soluble in 0.1 N NaOH; it is freely soluble in dimethylformamide. It exhibits slow gastrointestinal absorption rate and inter individual variation of its bioavailability5. A survey of literature reveals that metal complexes of some drugs have been found to be more effective than the drug alone6-11 therefore, much attention is given to the use of sulphonylureas due to their high complexing nature with essential metals.
The complexation of sulphonyl-urea with metals has been studied in detail by Yoshinaga and Yamamotto12 and Iqbal et. al.13. A persual of available literature shows that systematic study on complexation of cerium with “glipizide” is relatively scanty. It is interesting to have an insight into the synthesis of cerium complex with glipizide and to diagnose various structural aspects of the isolated complex. Present study describes the synthesis and characterization of cerium with glipizide.
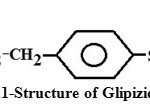 |
Figure 1: Structure of Glipizide. Click here to View figure |
Experimental
Ligand- Metal Ratio
Pure glipizide m.p. 208°C (Lit. 179-180), .005 M, were diluted to 100 ml as required and titrated conductometrically against cerium nitrate at 27ºC ±1. Results were plotted in the form of a graph which indicate ligand metal ratio as 2:1(L2M). This ratio was also confirmed by Job’s method 14 of continuous variation as modified by Turner and Anderson 15 The graphs were plotted which indicates 2:1 ligand metal ratio, Fig.2(a, b); from these curves the stability constant (Log k) and free energy (-ΔF) of the complex was also calculated 16-17 and reported in table 1
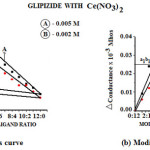 |
Figure 2: (a) Job’s curve (b) Modified Job’s curve. Click here to View figure |
Materials and Methods
Pure sample of glipizide with molecular formula (C21H27N5O4S) was received from M/s Zim Laboratories Limited Kalmeshwar (M.S.). Solvent and metal salt used were of the analytical grade (E-Merk). Melting point was determined by Perkin Elmer melting point apparatus and is uncorrected. The elemental analysis of the isolated complex was carried out using Coleman analyzer at the Departmental Micro analytical Laboratory CDRI Lucknow, India. From stochiometry and analytical data, the percentage of each element of complex has been given in table 2. IR spectra of Ligand and complex were recorded with Perkin Elemer Model 577 Spectrophotometer in the range of 4000-450 cm-1 as KBr pellets (CDRI Lucknow), while 1H-NMR spectra of the ligand and isolated complex were recorded on a Bruker DRX-300 Spectrophotometer and d6-DMSO was used as solvent (CDRI Lucknow), India. X–ray diffraction studies were carried out by X–ray diffractometer model with 45kV rotating anode and Cukα (1W=1.54060A°) radiation (Punjab University) Chandigarh, India.
Synthesis
A weighed quantity of Glipizide (2 mol) was dissolved in minimum quantity of 90 % DMF. The cerium nitrate solution was prepared by dissolving (1 mol) separately in ethanol. A few drops of phosphoric acid were added to metal solution for the solubility. Ligand solution was added slowly with stirring into the solution of metallic salt at room temperature maintaining the pH between 6.0 – 6.5 by adding dilute NaOH solution and refluxed for 3h. The solution was left for the crystallization at room temperature for 14 -16 h while pale yellow colored crystals of complex obtained which was filtered, washed well with ethanol, dried in vacuum and melting point was recorded.
Table. 1 Physico-chemical characteristics of Glipizide with Ce complex
|
Ligand/ complex |
Ligand Metal Ratio |
Color |
% Yield |
Melting Point (°C) |
Log K (L/mole) |
-ΔF (K cal/mole) |
|
Glipizide Ce Complex |
2:1 |
Pale Yellow |
57 |
212 |
11.72 |
-16.14 |
Table.2 Analytical data of Glipizide complex with Cerium.
|
Ligand/Complex |
Mol. wt (g/mole) |
Elemental analysis calculated (found) |
|||||||
|
|
|
C |
H |
N |
S |
Metal |
H2O |
|
|
|
C21H27N5O4S |
445.55 |
56.60 |
6.05 |
15.71 |
7.19 |
– |
– |
||
|
|
(56.45) |
(6.01) |
(15.65) |
(7.16) |
– |
– |
|||
|
(C21H26N5O4S)2 Ce(OH2)2 |
1067.22 |
47.08 |
4.87 |
13.11 |
6.00 |
13.13 |
3.37 |
||
|
(46.68) |
(4.52) |
(12.89) |
(5.80) |
(12.70) |
(4.52) |
||||
Results and Discussion
The synthesized complex is pale yellow and stable being soluble in DMSO, and insoluble in water, ethanol etc. Analytical data and conductometric studies suggest 2:1 (L: M) ratio.
IR absorption analysis
The IR spectra 18-21 of the ligand and the isolated complex was recorded on Perkin Elemer Spectrophotometer Model 577, range 4000-450 cm-1 and the probable assignments are given in table 3. The proposed structure for the isolated complex is supported by IR absorption bands and characterized by the prominent band in region of 3331±10 due to N-H stretching, a very sharp peak observed at 770 cm-1 due to –CH stretching of aromatic ring. The carbonyl group (C=O) band was observed at 1688cm-1 in ligand; but in complex this stretching frequency got shifted downward at 1664 cm-1 region. At 1222 cm-1 a strong absorption band was obtained in complex due to SO2-N frequency while the peak at 663 cm-1 arises due to metal oxygen bond. Also the absorption peak of S=O group is absorbed at 1029 cm -1 in ligand while at 1011cm-1 in the complex. The shift of C=O and S=O group by changing frequency in the complex indicate that these group are involved in the complexation (fig-3 a & b).
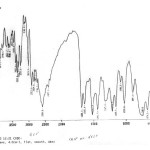 |
Figure 3(a): IR spectra of pure drug Glipizide. Click here to View figure |
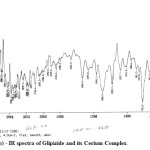 |
Figure 3(b): IR spectra of Glipizide and its Cerium Complex. Click here to View figure |
Table 3- IR absorption data of Ligand and Cerium complex in cm-1
| Ligand and complex | ν (N-H) | ν (C=O) | ν(SO2N) | ν(S=O) | ν(-CH2) | ν(M-O) | ν(H2O) | |
| Ligand (C21 H27 N5O4S) | 3352(m) | 1688(vs) | 1216(vs) | 1029(vs) | 748(vs) | ——- | ||
| Complex(C21H27N5O4S)2Ce(OH2)2 | 3331 (s) | 1664(s) | 1222(s) | 1011(m) | 770(vs) | 663(s) | 3640(vw) | |
vs- very strong, s-strong, m-medium, w-week, vw-very week
1H NMR Analysis
1H NMR data of complex is summarized in (Table-4), and their proposed structure is given in Fig. 4. It is observed that the singlet due to the (SO2NH) proton around (d 6.318) in the spectrum of the ligand present but disappeared in the complex due to formation of M-O band. This also confirms the deprotonation of amide NH group through enolization.Other features of NMR spectrum were the aromatic ring of unresolved multiplet suggestive protons. Slichter22, Akit 23, Siewers 24 and Afridi 25.
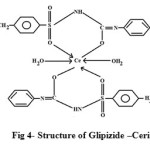 |
Figure 4: Structure of Glipizide –Cerium Complex. Click here to View figure |
Table 4- 1H NMR –Assignments of Glipizide and its Cerium complex.
|
Glipizide (C21H27N5O4S) |
Glipizide-Cerium complex (C21H26N5O4S)2Ce(OH2)4 |
| 8.59 (CH3 attached with pyrazine ring, J=1.00Hz), 7.78 (d, benzene, J=2.067Hz), 7.439 (d, benzene, J=2.101Hz) , 6.318 (s, SO2NH, J=0.928 Hz), 3.605 (q, CH3, J=2.035 Hz), 3.250 (t, CH2 attached with benzene ring, J=1.031 Hz), 2.98 (t, CH2 attached with carbonyl, J=2.078 Hz), 1.84 (m, CH3, J=5.286 Hz). | 8.59 (CH3 attached with pyrazine ring, J=0.5312Hz), 7.73 (d, benzene, J=1.883Hz), 7.429 (d, benzene, J=1.898Hz), 3.573 (q, CH3, J=5.955 Hz), 3.11 (t, CH2 attached with benzene ring, J=5.041 Hz), 2.96 (t, CH2 attached with carbonyl, J=21.33Hz), 1.605 (CH3, J=2.955 Hz). |
s- singlet, d- doublet, t-triplet, q-quartrate, m-multiplet.
X-ray diffraction studies
X-ray diffraction studies also confirm the complex formation due to new bonds26-33. The number of peaks in glipizide are 15 while (GLP)2Ce are 4 (fig 4.(a), (b)), thus indicating that complex formed is a well kit one. All the reflections present are new ones and the pattern are fairly strong. On comparing the pattern obtained with available literature, it is evident that their patterns is not in good agreement with available information and thus confirm the formation of totally new complex. The X-ray pattern have been indexed by using computer software (FPSUIT 2.0V) and applying interactive trial and error method keeping in mind the characteristics of the various symmetry system, till a good fit was obtained between the observed and the calculated Sin2 θ value. The unit cell parameters were calculated from the indexed data, from cell data and crystal lattice parameters of (GLP)2Ce, indicate complex attributed to Orthorhombic crystal system given in table 5.
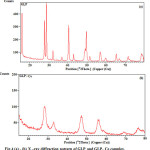 |
Figure 4 (a): (b) X –ray diffraction pattern of GLP and GLP- Ce complex. Click here to View figure |
Table 5. Cell data and crystal parameter of GLP-Ce complex.
a (A°) = 21.762 Volume (abcsinβ) = 13904.78 A°
b (A°) = 23.427 Density =0.079 gcm-3
c (A°) = 27.274 Space Group= Pmmm
α =90°, β= 90°, γ=90° Crystal System = Monoclinic
Dcal =3.1423, Dobs=3.1459 Porosity= 0.1141%
Standard Deviation=0.12% Particle size= 4.445 microns
|
2θ |
I/I0 |
Dobs |
Dcal |
h |
k |
l |
|
28.3708 |
100.00 |
3.1459 |
3.1423 |
3 |
3 |
7 |
|
32.9520 |
56.19 |
2.7182 |
2.7514 |
3 |
8 |
0 |
|
47.3375 |
78.64 |
1.9203 |
1.1919 |
6 |
1 |
12 |
|
45.8850 |
49.37 |
1.6452 |
1.6441 |
12 |
0 |
7 |
Conclusion
The proposed structure of glipizide-cerium complex, initially Job’s method of Continuous variation as modified by Turner and Anderson was conducted which indicate 2:1ligand metal ratio. Moreover, stability constant and free energy change were also calculated. Analytical data agree to the molecular formula (C21H26N5O4S)2Ce(OH2)4 (L2M). For supporting the proposed structure, given on the basis of stoichiometry and analysis of the complex, advance spectroscopic methods like IR, 1H NMR, were conducted which suggest the coordination of metal atom with enolic oxygen of the carbonyl group on one side and oxygen of the sulphonyl group from the other side .These observation were further supporting from the IR and NMR values of metal-oxygen linkage in IR and disappearance of N-H linkages in NMR. In complex a detailed study of X-Ray also supports the complex formation and the various values like particle size, porosity, volume of unit cell, density as well as crystal system was evaluated and discussed. Moreover, looking to the higher electronegativity of oxygen as compared to nitrogen, it appears that enolization will be through C=O group and not from NH group. Moreover, the enolization is possible from N2 nitrogen rather than N1 because the alkyl group of sulphonyl urea is electron releasing in which N2 is attached, while N1 is attached from one side of C=O group, while on other side from O=S=O group, both of which have high electronegativity and are proton attracting.
Acknowledgement
The authors are thankful to the Principal of Cresent College of Technology, Bhopal and Saifia Science College, Bhopal for providing all necessary facilities and CDRI Lucknow, P.U Chandigarh for providing IR, NMR and X-Ray data.
References
- Ammar, H. O., Salama, H. A., Ghorab, M., El-Nahhas, S. A., and Elmotasem, H., Curr. Drug Deliv., 3 (3), 333 (2006).
- Semalty, M., Semalty, A., and Kumar G., Indian J. Pharm. Sci., 70: 43 (2008).
- Dollery, C., Therapeutic Drugs, 2nd Ed., Churchill Livingstone., 1 : 56 (1999).
- Prabhakara, P., Nayari, M. H., Gulzar, A. M., Yadav, B., and Charyulu, R. N., Indian J. Pharm. Edu. Res., 42 (2): 174 (2008).
- Kouichi, Diab. Res. Clin. Pract.,68: 250-257 (2005).
- Scott, standard methods of chemical analysis (Von Nostrand)., pp 634. (1960).
- Weissberger, A., Chem. Application of spectroscopy”, Vol. XI Inter Science Publ., New York. (1956).
- Iqbal, S. A., Jacob, G., and Malik, S., Orient. J. Chem., 14, 116 (1998).
- Sharma, S., Iqbal, S. A., and Bhattacharya, M., Orient. J. Chem., 25 (4): 1101-1104 (2009).
- Afridi, F., Iqbal, S. A., and Jacob, G., Orient. J. Chem., 20 413 (2004).
- Siddiqui, A., Iqbal, S. A., and Qureshi, R., Orient. J. Chem., 20 (2004).
- Yoshinaga, I., Yamamotto., J. Osaka.,1: 3(1966).
- Iqbal, S. A., and Qureshi, R., Asian. J. Expt. Sci., 1 68-70 (1985).
- Job, P., Ann. Clim., 113 10 (1928).
- Turner, S. E., and Anderson, R. C., J. Am .Chem. Soc.,912:71 (1949).
- Irving, H., and Rossotti, H. S., J. Chem. Soc., 2904 (1954).
- Irving, H., and Rossotti, H. S., J. Chem. Soc., 1176 (1955).
- Dyer, J., “Application of Absorption Spectroscopy of Organic Compounds” Prentice Hall of India Pvt. Ltd. Fourth Printing., 36 (1978).
- Rao, C.N. R., Chemical Applications of Infrared spectroscopy, Academic press., NY 258 (1970).
- Chandran, A., Varghese, H. T., Yohannan, C. and Rajendran, G., Orient. J. Chem., 27 (2): 611-617 (2011).Tawkir, M., Iqbal, S.A., Krishan, B. and Zaafarany, I., Orient. J. Chem., 27 (2) : 603-609 (2011).
- Slichter, C. P., Principles of magnetic resonance, Harper and Row (1963).
- Akit, J.W., NMR and chemistry an introduction to nuclear magnetic resonance spectroscopy., Champan and Hall, (1973).
- Siewers, R.E., Nuclear magnetic resonance shift reagents academic., New York (1973).
- Farhana, A., Iqbal, S. A., and Javed, Hasan., Orient. J. Chem., 22(1): 195-197(2010).
- Panday, S. N., Sriram, D., Nath, G., and Clereq, E. De. Arzneim-forsch/Drug Res., 50:55(2000).
- Hollo, B. S., Poojary, K. A., and Kollurya, B., II, Farmaco., 51:793(1996).
- Kidwai, M., Sapra, P., Mishra, P., Saxena, R. K., and Sing, M., Bio org. Med. chem., 9:217(2001).
- Reddy, H. K., Seshaiah, D. P., and Reddy, A. V., Orient. J. Chem., 27(3):1125-1131(2011).
- Henry, N. F. M., Lipson, H., and Wooster, W. A., Interpretation of X-ray diffraction photograph.,81(1851).
- Chohan, Z., Praveen, M., and Ghaffer, A., Synth. React. Inorg. Met. Org. Chem., 28:1973(1998).
- Krishan, B. and Iqbal, S. A., Orient. J. Chem., 28(4):1883-1888 (2012).
- Altermatt, D., and Brown, I. D., Acta Cryst B., 41:244-247 (1985).

This work is licensed under a Creative Commons Attribution 4.0 International License.
![]()
A New Edition of Web of Science
Journal Impact Factor
2022: 0.5
Five Year: 0.8
Journal is Indexed in

Cabells Whitelist
![]()


