Studies on Application of Chemical Modified Epoxy Resin as A Coupling Agent in Polymeric Azo Dyes
Mahendrasinh Raj1* and Lataataata Raj2
1Institute of Science and Technology for Advanced Studies and Research (ISTAR), Vallabh Vidyanagar - 388120, India. 2C.N.P.F Arts and D. N Science College, Dabhoi - 338 625, India. CorrespondingAuthor Email: mahendramraj@yahoo.com
The present work aims application of modified epoxy resin as a coupling agent in polymeric azo dyes. Chemical modification of epoxy resin by polycondensation reaction of epoxy resin with two different phenols namely phenol and 2- hydroxyl napthelene in presence of basic medium. The resulting oligomers were characterized by elemental analysis, spectral studies (FTIR), number average molecular weight (Mn) and thermal stability by thermogravimetric analysis (TGA). Each of this resin was used as a coupling agent in the syntheses of polymeric azo dyes in presence of various aromatic amines viz. aniline, p-Cl–Aniline, p-NO2–Aniline, p-Amino–phenol, p–Toluidine, & p-Ansidine. The synthesized polymeric azo dyes were characterize by their physical properties, FTIR spectral studies and visible spectral studies view to explore their chemical structure and dyeing behavior on different fabric.
KEYWORDS:Azo dye; modified epoxy resin; oligomer; polymeric azo dye; coupling agent
Download this article as:| Copy the following to cite this article: Raj M, Raj L. Studies on Application of Chemical Modified Epoxy Resin as A Coupling Agent in Polymeric Azo Dyes. Orient J Chem 2013;29(2). |
| Copy the following to cite this URL: Raj M, Raj L. Studies on Application of Chemical Modified Epoxy Resin as A Coupling Agent in Polymeric Azo Dyes. Orient J Chem 2013;29(2). Available from: http://www.orientjchem.org/?p=22058 |
Introduction
Specialty material having number of advantages over their monomeric dyes.As a consequence in the last few decades, they have been documented well by many research scientists. It is important to note that polymeric dyes have shown the properties like fluorescence, phototropism, thermochromism, liquid crystallinity and non-linear optical property. Therefore they are finding very useful in textile dyeing as well as for various other applications. [1-4] In this context, perhaps the azo dyes constitute the largest and most versatile class of all dyes that have been so synthesized on a polymer back-bone. The reason for this is that polymeric azodyes containingazo benzene moiety have a tendency to undergo cis-trans isomerization of azo group yielding photoresponsive material to be useful in many areas of science viz. electronic communication, for storage devices, in photographic film forming material and for textile dyes. [5-9]
The different approaches are used in synthesis of polymeric azo dyes. To generate a dye structure on a polymer backbone chain containing reactive functional group.The use of homopolymer or copolymer containing electron rich aromatic moiety as a coupling component.The different couplers employed in the dye syntheses are phenolic resins especially of phenol formaldehyde, phenol–furfural and resorcinol-formaldehyde.Another multi component oligomeric system has also been used in which polymer backbone chain consisting of melamine and phenolic units. Such multi component systems are prepared by polycondensation of trimethylol melamine with a-nahthol. All of these polymeric azo dyes are characterized duly for their chemical structure determination and evaluated for their dyeing behavior on different textile fibres.[9,10] They revealed better compatibility with polymeric fibres like polyester nylon and wool with attractive hues of versatile color shades. Melatine-formaldehyde-a-naphthololigomeric couplers based azo dyes have high fixation and less exhaustion, which ultimately has alleviate the water effluent treatment problems for pollution control.Thus studies of probability of oligomers as a polymer precursor in synthesis of polymeric azo dyes prompted us to extend the work in this direction by using epoxy oligomeric systems. On the basis of this, present workhas been undertaken with a view to investigate systematically chemical modification of epoxy resin in the presence of two different phenols such as phenol and 2- hydroxyl napthelene and resulting in to oligomer. These oligomers are used as coupler for the syntheses of polymer backbone azo dyes.
Materials & Methods
Chemicals
All the chemicals used in the present work were of analytical grade and if required then purified them according to procedure given in literature.[11]Commercial epoxy resin used containing epoxy equivalent value 200, density at 250C is 1.16 – 1.70 g/cc and viscosity at 250C is 40 – 100 poise.
Synthesis of epoxy – phenolic oligomer:
In a stirred glass round bottom flask with condenser, take DGEBA (0.1 M) and phenol (0.12 M) in methanol (50 ml.) were mixed, followed by the addition of 1% sodium hydroxide (based on weight of DGEBA) as catalyst. The reaction mixture was allowed to reflux until the reaction mixture had indicated the negative test for epoxy group (Resin + 2-3 drops of formaldehyde + 1-2 drops of conc. H2SO4. Blue or green colored precipitates indicating the presence of epoxy group). The resins were obtained after continuous stirring for 8 to 10h. The residue was a highly viscous liquid and was abbreviated as EP. Similarly other oligomer was synthesized using 2-hydroxy naphthalene. It was abbreviated as EN. The yields of obtained oligomers were 80 – 85%. The general reaction protocol forepoxy – phenolic oligomers are shown in scheme-1.
Synthesis of Polymeric Disperse Azo Dyes
Diazotization of aromatic amines
A solution of 9.3 ml (0.1 M) aniline in 25 ml 2N HCl was cooled in ice-bath to a temperature of 0–2 0C. To this cooled solution of amine, 100 ml (lN) NaNO2 was added drop wise during half an hour such that the temperature of reaction mixture should not increase more than 2-3 0C. The test for completion of diazotization reaction was carried out by congo-red paper giving deep blue color. If the diazotization was not completed more nitrite solution was added until the positive test for completion of diazotization was obtained. The diazotized amine solution thus prepared was used immediately in coupling reaction of azo dye formation. All other amines such as p-Cl–Aniline, p-NO2–Aniline, p-Amino–phenol, p–Toluidine, p-Ansidinewere diazotized by the similar process.
Coupling of Epoxy base phenolic polymeric dye precursor (EP)
The general procedure used for coupling reaction of diazotized amine with polymeric dye precursor (EP) to synthesize polymeric disperse azo dyes is as follows. To a cooled alkaline solution of 10% NaOH (pH 10-10.5) of epoxy based phenolic resin (EP) (0.01M, 2.20g), the diazonium salt of aromatic amine was added drop wise with continuous stirring at 0–50C temperature then was allowed to stand for 1 hour and pH of the reaction mixture was adjusted to 7-7.5 using 5 % aq. hydrochloric acid. The dyes thus precipitated was filtered and washed with hot water till filtrate was colorless andfinally dried in air. The similar procedure was used in the preparation of six disperse dyes by using six different diazoneum salts. They are abbreviated as EP-ANL, EP-CAN, EP-NAN, EP-AMP, EP-TDS, and EP-ANS for EP resin and EN-ANL, EN-CAN, EN-NAN, EN-AMP, EN-TDS, and EN-ANS for EN resin respectively.
Construction of calibration curves
A dilute solution of a dye with composition similar to dye-bath solution used in dyeing was prepared as follows
The stock solution of dye was prepared by weighing 10 mg. of dye. It is then mulled, with dispersing agent and 2 drops of wetting agent. To this mixture 2-3 ml of DMF was added to dissolve it and was then transferred in to 100 ml volumetric flask and finally diluted up to mark with water. From this stock solution of dye, the standard solutions of four different concentration of dye were prepared by diluting 2, 4, 6, and 8 ml of stock solution to 50 ml with DMF. The concentrations of resulting standard solution were 4 x 10⁻³, 8 X 10⁻³, 12 X 10-3 and 16×10-3 mg/ml finally absorbance of these four solutions were measured at a pre-determined λmax. From the results, calibration curve was constructed by plotting absorbance versus concentration of standard solutions.
Sample treatment for absorption measurement
The general procedure followed for the percentage exhaustion and percentage fixation measurement of all the dyes on different fabrics are described here.
The combined solution of dye bath liquor after dyeing and washings of dyed pattern was diluted to 250 ml with distilled water. 5 ml of this solution was further diluted to 25 ml with DMF and its absorbance was measured at corresponding lmax. The concentration of this solution was read from the calibration plot at a corresponding absorption value. The amount dye remained in the dye bath and hence percentage of dye exhausted from dye-bath was calculated.
Fixation study
Construction of calibration curves
The stock solution of dye was prepared by dissolving 10 mg of dye in concentrated H2SO4 in a 100 ml volumetric flask and diluting to the mark. From this stock solution of dye the standard solution of four different concentrations of dye were prepared by diluting 2, 4, 6 and 8 ml of stock solution to 50 ml with conc. H2SO4. The concentration of resulting standard solutions in acid is 4 x 10⁻³, 8 X 10⁻³, 12 X 10-3 and 16×10-3 mg/ml. Finally the absorbances of these four solutions were measured at predetermined lmax. The results are reported intable. From these results the calibration .curve was constructed by plotting absorbance versus the concentration of standard solutions. The similar procedure was followed for all the disperse dyes.
Sample treatment for absorption measurement
For the fixation study, a sample of un-dyed fabric (0.1 gm.) was dissolved in 25 ml of concentrated sulphuric acid and this solution was used as a reference solution in colorimetric measurement. A dyed fabric (0.1 gm.) was dissolved in 15 ml conc. sulphuric acid. This required about 10-15 minute dissolving. The absorbance of this solution was measured at appropriate lmax. From the calibration curve the concentration of the dye solution was read and hence amount of dye fixed on the fabric was calculated. The similar process followed for all the polymeric dyes.
The percentage exhaustion and percentage fixation were estimated for all disperse azo dyes on nylon fabrics according to the method described earlier for polyester fabric. The results of exhaustion and fixation of all the disperse dyes on nylon are furnished in table.
Measurements
The elemental analysis of above mentioned EP & EN were performed on C, H, N Elemental analyzer (Heraeus Rapid Analyzer, Germany). Number average molecular weight of Epoxy based phenolic resins were measured by Knaller Germany K–7000 vapor pressure osmometer using DMF as solvent as per ASTM D 3592-77. The viscosity of polyester resin was measured by Brookfield RVF model viscometer as per ASTM D 1824.
The IR spectra were scanned in KBr on NICULET-400-DR FTIR spectrometer by using a thin layer of the sample on KBr cell. The TGA of epoxy based phenolic resin was carried out on a Dupont model 951 Thermal Analyzer Coupled with plug in module Model 990 Thermal analyzer in a slow stream of air with a heating rate of 100C/min. Visible spectra were recorded by preparing the solution (concentration 1.6 x 10⁻² mg/ml) of all the polymeric disperse azo dyes in 1:1 mixture of DMF: ethanol. All the spectra were recorded on Backmann UV-VIS spectrophotometer.
Results and discussion:
Characterization of EP & EN:
Both EP & EN obtained as viscous liquid having colour light brown and dark brown respectively. Both EP & EN are insoluble in common organic solvents viz; benzene, petroleum ether and dioxane but highly soluble in alcohol. On the other hand DGEBA was miscible with all organic solvents. The solubility of EP & EN in limited solvents indicated the reaction profile of DGEBA with phenols. The data of elemental analysis of C and H contents showed that they are in good agreement with the theoretical values and also results of viscosity and number average molecular weight () of epoxy modified phenolic resin were shown in Table 1.
Table 1: Characterization of EP & EN.
|
Polymer Sample |
Colour |
Elemental analysis |
|
Viscosity (cP) |
|||
|
% C |
% H |
||||||
|
Calcd. |
Found |
Calcd. |
Found |
||||
|
EP |
Light Brown |
65.50 |
64.90 |
6.55 |
6.00 |
1770 |
300 |
|
EN |
Dark Brown |
66.66 |
60.00 |
6.99 |
6.50 |
2330 |
345 |
Inspection of these IR spectrums reveals that they resemble each other in general appearance. However there is a noticeable difference in certain frequencies. All these aspects are discussed by assignment of group frequencies. It is usually found that the bands in the IR spectra of polymers are not so simple and distinct as compared to the bands in the IR spectra of organic and inorganic compounds. This presents a major difficulty in understanding and deriving crucial details about all the structural features of the polymer molecules. A strong and sharp band is observed at 1508 cm-1 for p-substituted derivative of bisphenol A. The other two strong bands observed around 1370 and 1380 cm-1 are assigned to two germinate methyl groups of bisphenol A. The two distinct vibrational frequencies are characteristic of aliphatic C–H stretching vibration of bridge methylene groups between bisphenol A and ester end group of resin are at 2970 and 2880 cm-1. The absence of a characteristic absorption frequency at 916 cm-1 of an epoxy end group in IR spectra of all resins indicated that the polycondensation of DGEBA with phenols involved the ring opening reaction and resulted in to formation of a secondary hydroxy group at less hindered C atom of epoxy group ring. The broad absorption band at 3400-3200 cm-1 is due to phenolic hydroxyl (-OH) stretching mode. The two peaks, one medium and sharp in the region of 1350-1330 cm-1 and the other medium peak near 770 cm-1 are due to O-H in plane bending vibration and O-H out of plane bending vibration respectively. The strong peak at 825 cm-1 indicates the possibilities of p-substitution product to some extent. The characteristic aromatic C=C stretching vibration peak is obtained as a medium and sharp peak near 1600 cm-1 in IR spectra of each of the EP & EN polymer. Thus, the examination of IR spectral data of EP & EN concludes that they are in good agreement with literature data reported about the combination bands of different phenolic resins.
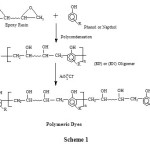 |
Scheme 1 |
The thermal analysis of epoxy based phenolic resin sample was kept in an oven at 35oC under vacuum overnight. The sample container i.e., boat prepared from aluminum foil which would hold the polymer sample for analysis was properly washed and dried. It was suspended on the quartz rod in the thermo balance of TG instrument. The sample (10-12 mg.) was placed in the boat and suspended on the quarts rod where an atmosphere of air was maintained. The weight of the sample was noted on the TGA balance. The whole assembly was brought into the furnace. EP & EN are quite stable almost up to 200oC temperature. However the temperature of thermal stability changed depending upon the structural variations of phenols used in resin synthesis. There thermogram of both the samples have almost identical in shape indicating that there is a similar degradation reactions pattern followed in degradation of both resins. Major part of decomposition occurs in the temperature range 250o–500oC. The degradation of both epoxy based phenolic resin was almost completed in the temperature range of 500-700oC.The results of thermogravimetric analysis of epoxy modified phenolic resin were shown in Table 2 and figure 1.
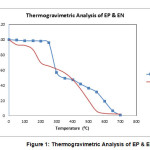 |
Figure 1
|
 
Table 2: TGA Data of Epoxy based Phenolic resin (EP & EN).
|
Polymer Sample |
Percentage weight loss at different Temperature (0C) |
|||||||||||||
|
50 |
100 |
150 |
200 |
250 |
300 |
350 |
400 |
450 |
500 |
550 |
600 |
650 |
700 |
|
|
MP |
0.58 |
1.47 |
1.50 |
1.78 |
4.03 |
43.28 |
50.49 |
52.31 |
58.19 |
63.46 |
68.66 |
80.77 |
93.14 |
99.07 |
|
MN |
6.64 |
7.46 |
12.7 |
30.07 |
34.52 |
38.44 |
43.5 |
52.3 |
64.85 |
79.69 |
93.7 |
96.7 |
97.34 |
97.6 |
Characterization of Polymeric Disperse Azo Dyes
The number of azo groups in each of the polymeric dye was estimated by the process reported in literature.[11] This method is very suitable for estimation of azo group in the dyestuff. Thorough inspection of IR spectra of four series of disperse dyes have shown the following distinguish features.
The characteristic intense band at 1600–1595 cm-1 indicating the characteristic azo group (-N=N-).The absorption peak at 830 cm-1 indicates C-H (out of plane) bending vibration of p-substituted benzene ring (2-adjacent, H-atoms), except those in IR spectra obtained from aniline.The two absorption bands at 770-730 cm-1 and 700 cm-1 indicating the mono substituted benzene ring (5-adjacent H-atoms) in the IR spectra of four dyes derived from aniline and corresponding four different phenols. The medium strong characteristic C-Cl stretching absorption peak(750–700 cm-1) is variable in position in the dye containing p-Cl substituent benzene ring of a diazonium component. In the IR spectra of EP-NAN the characteristic absorption bands due to O-H stretching and C-O stretching are disappeared and have shown a new medium intensity band at 1659 cm-1 may corresponds to C=O stretching vibration of quinone type structure formation in the dye, due to the presence of NO2 (nitro) group.
Visible spectra were recorded by preparing the solution (conc. 1.6 x 10⁻² mg/ml) of all the polymeric disperse azo dyes in 1:1 mixture of DMF: ethanol. All the spectra were recorded on Backmann UV-VIS spectrophotometer. The lmax, absorbance (A) and logarithm of molar extinction coefficient (log e) for all the polymeric disperse dyes are reported in table. The lmax values for polymeric disperse azo dyes are in the range of 350 to 575 nm corresponding to color light orange to brown. The molar coefficient (e) of all polymeric disperse dyes is of the order of 104–105.On the basis of Witt’s theory and resonance theory of color regarding relationship between the color and chemical constitution of dye molecule. [12, 13]
The variation of lmax and absorbance(A) of the polymeric dyes can be correlated in terms of substituents effect of the groups present in the diazo component of relevant dyes by comparison of their visible spectra with that of a dyes based on unsubstitueddiazo component. The log e value of dye containing p-NO2 substituent group has increased as compared to that of corresponding unsubstitued aniline dye in each of the four series of disperse azo dyes. A bathochromic shift has been observed in the polymeric disperse azo dyes consisting of p-OCH3 and p-NO2 groups in diazo component of the dyes in all the four series due to auxochromic effect of -OCH3 and –NO2 groups. However in case of the dyes derived from diazo component of p-amino phenol the bathochromic shift is not observed, this may be due to intramolecular H–bond formation between O–H groups. A lmax values of aniline dye with those of dyes having p-Cland p-CH3 group in the diazo component has revealed hypsochromic effect due to anti–auxochromic effect of these two substituents. The results of lmax and Log e Value of Polymeric Disperse Azo Dyes were shown in Table 3.The striking features of the dyeing behavior of these epoxy base phenolic disperse azo dyes, the percentage dye-bath exhaustion ranges from 60–95 %. Comparison of the data of % exhaustion with the data of % fixation reveals that almost the dye exhaustion from the dye-bath has fixed on the fabric and it ranges from55–95 % calculated on the basis of the dye exhausted. Thus these epoxy base phenolic disperse azo dyes are comparable with the commercial monomeric organic dyes.Exhaustion and Fixation Study of Polymeric Disperse Azo Dyes in presence of nylon and polyester were shown in Table 4 & 5.
Table 3: lmax and Log e Value of Polymeric Disperse Azo Dyes
|
Dyes |
lmax (nm) |
Absorbance |
Log e |
|
EP-ANL |
357 |
1.499 |
4.76 |
|
EP-CAN |
362 |
1.199 |
4.70 |
|
EP-NAN |
387 |
2.177 |
4.99 |
|
EP-AMP |
369 |
0.908 |
4.50 |
|
EP-TDN |
358 |
1.406 |
4.75 |
|
EP-ANS |
365 |
1.098 |
4.60 |
|
EN-ANL |
546 |
0.318 |
4.25 |
|
EN-CAN |
573 |
0.281 |
4.23 |
|
EN-NAN |
659 |
1.347 |
4.92 |
|
EN-AMP |
364 |
0.338 |
4.20 |
|
EN-TDN |
524 |
0.702 |
4.61 |
|
EN-ANS |
561 |
0.292 |
4.24 |
Table 4: Exhaustion and Fixation Study of Polymeric Disperse Azo Dyes (Nylon)
|
Dye Designation |
Amt. of dye left in dye bath a mg |
Amt. of dye Exhausted from dye bath b = (40-a) mg. |
% exhaustion of dye |
Amt. of dye present on dyed pattern C mg. |
% fixation dye |
|
EP-ANL |
11.5 |
28.5 |
71.25 |
22.30 |
78.28 |
|
EP-CAN |
5.87 |
34.12 |
85.31 |
28.93 |
84.78 |
|
EP-NAN |
5.96 |
34.03 |
85.09 |
27.56 |
80.98 |
|
EP-AMP |
5.37 |
34.62 |
86.56 |
19.12 |
55.22 |
|
EP-TDN |
13.625 |
26.37 |
65.93 |
20.10 |
76.22 |
|
EP-ANS |
8.75 |
31.25 |
78.12 |
23.34 |
74.68 |
|
EN-ANL |
13.87 |
26.12 |
65.31 |
22.60 |
86.52 |
|
EN-CAN |
16.5 |
23.5 |
58.75 |
19.80 |
84.25 |
|
EN-NAN |
21.75 |
18.25 |
45.62 |
15.24 |
83.56 |
|
EN-AMP |
19.5 |
20.5 |
51.25 |
16.07 |
78.39 |
|
EN-TDN |
23.5 |
16.5 |
41.25 |
13.75 |
83.33 |
|
EN-ANS |
4.75 |
35.25 |
88.12 |
30.65 |
86.95 |
Table 5: Exhaustion and Fixation Study of Polymeric Disperse AzoDyes (Polyester)
|
Dye Designation |
Amt. of dye left in dye bath a mg |
Amt. of dye Exhausted from dye bath b = (40-a) mg. |
% exhaustion of dye |
Amt. of dye present on dyed pattern C mg. |
% fixation dye |
|
EP-ANL |
15.87 |
24.12 |
60.31 |
17.66 |
73.21 |
|
EP-CAN |
4.33 |
35.66 |
89.15 |
25.36 |
71.11 |
|
EP-NAN |
6.75 |
33.26 |
83.12 |
22.62 |
68.00 |
|
EP-AMP |
8.37 |
31.62 |
79.06 |
20.48 |
65.88 |
|
EP-TDN |
10.87 |
29.12 |
72.81 |
21.13 |
72.56 |
|
EP-ANS |
7.25 |
32.75 |
81.87 |
24.67 |
75.32 |
|
EN-ANL |
9.62 |
30.37 |
75.93 |
23.79 |
78.33 |
|
EN-CAN |
13.5 |
26.50 |
66.25 |
21.65 |
81.69 |
|
EN-NAN |
11.00 |
29.00 |
72.50 |
24.00 |
82.73 |
|
EN-AMP |
4.875 |
35.12 |
87.81 |
28.63 |
81.52 |
|
EN-TDN |
8.50 |
31.50 |
78.75 |
26.12 |
82.92 |
|
EN-ANS |
6.30 |
33.70 |
84.25 |
28.09 |
83.35 |
Visual observation of the dyed patterns mounted in the shade cards no. 1-10 have shown a color gamut range from light yellow to violet and brown, There is more or less sharp color change with the different aromatic amines.
Conclusion
The fastness properties of epoxy base phenolic dyes are comparable to those of the commercial organic dyes. For all the polymeric disperse dyes, the light fastness and wash fastness are in the range of moderate to excellent grade.
On the basis of above observations, the presently reported azo dyes derived from epoxy base phenolic polymers may be useful in non-textile application of the dyes such as for biological as an antibacterial agent and in non-toxic food dyes. [14-17]
References
- Charles E. Carraher Jr., Richard A. Schwarz, Jack A. Schroeder&Macy Schwarz,J. Macromol. Sci. Chem., A-5, 773, 1981.
- Konstantinova, T.N., Meallier, P., Grabehav, I.,Dyes. Pigm. 22(3), 191-8, 1993.
- S. D. Alexandratos, S.D., Ind. Eng. Chem. Res.,48,388, 2009.
- Masram, D.T., Kariya, K.P., and Bhave, N.S., Der PharmaChemica, 3(3),124, 2011.
- Jadhao, M.M., Paliwal, L.J., Bhave, N.S., J. Appl. Polym. Sci., 96(5), 1605, 2005.
- Patel, J.R., Nimavat, K.S., and Vyas,K.B., J. Chem. Pharm. Res.,3(6),483, 2011.
- Lovrien, R.J., Waddington, C.B., Photoresponsive Systems. I., J. Am. Chem. Soc. 86 (12), 2315-2322, 1964.
- David, H.E.F., Blangy,L., Interscience Publishers. Inc., New York1949.
- Hugh J., CreechR., Norman Jones, J. Am. Chem. Soc., 62 (8), pp 1970–1975, 1940.
- May C.A, and Thnaka Y, Marcel Dekker, New York, 273, 1973.
- 11. Vogel A I, Longman, London, 1989.
- Daniel J.D, Richard, D.G., Robert, E.W.Jr., J. Am. Chem. Soc, 98, 5996, 1976.
- 13. Peter Fellgett, I., J. Phys. Radium, 19, 187-237, 1958.
- Edward W. Hughes, William N.Lipscomb, J. Am. Chem. Soc., 68 (10), 1970.
- Seishi Machida, Mikio Araki and Keizo Matsuo, J. Appl. Polym. Sci, 12 (2) 325-32, 1968.
- Zolliger,H., VCH Publishers, NewYork , 1987.
- Wheland, G.W., Wiley Pub., NewYork ,1944.

This work is licensed under a Creative Commons Attribution 4.0 International License.
![]()
A New Edition of Web of Science
Journal Impact Factor
2022: 0.5
Five Year: 0.8
Journal is Indexed in

Cabells Whitelist
![]()


