Removal of Copper (II) from Aqueous Solutions using Chalk Powder
S. Mumtaz Uddin*, A. K. Azad and Rahila Firdaus
Department of Chemistry, B. R. A. Bihar University, Muzaffarpur - 842 001, India.
Corresponding author E-mail: s_mumtazuddin@rediffmail.com
DOI : http://dx.doi.org/10.13005/ojc/290247
Adsorption of copper (II) from aqueous solutions on powdered chalk has been studied as a function of different parameters : contact time (t), mass of the adsorbent (w) and initial concentration (Ci) of the adsorbate. The amount of Cu (II) adsorbed increased with increased contact time and equilibrium reached at 60 minutes for powdered chalk. The minimum adsorbent dose for an optimal removal within the concentration range considered (7-30 ppm) was 1g. Maximum removal percentage was found to be 98.2. Adsorption isotherms observed were in agreement with the Langmuir adsorption isotherm. The adsorption kinetics data obtained fitted the pseudo-first order kinetics. These results showed that the powdered chalk can efficiently be used to remediate copper (II) from waste water.
KEYWORDS:Copper (II);l Adsorption; Chalk powder
Download this article as:| Copy the following to cite this article: Uddin S. M, Azad A. K, Firdaus R. Removal of Copper (II) from Aqueous Solutions using Chalk Powder. Orient J Chem 2013;29(2). |
| Copy the following to cite this URL: Uddin S. M, Azad A. K, Firdaus R. Removal of Copper (II) from Aqueous Solutions using Chalk Powder. Orient J Chem 2013;29(2). Available from: http://www.orientjchem.org/?p=22221 |
Introduction
Copper is a toxic heavy metal discharged into the environment due to various industrial operations1 and agricultural activities2. Anthropogenic sources of copper contamination include smelters, iron foundries, power plant stations and incinerators3. Copper has been found to cause stomach and intestinal distress, kidney damage and anaemia4 and prolonged inhalation of copper containing fumes has been linked to increase in lung cancer5. US EPA has regulated drinking water concentration not to exceed 1.3 ppm for copper6.
The coventional physico-chemical methods for the removal of toxic heavy metals from industrial waste water such as chemical precipitation, electroplating, membrane separation, evaporation or resin ion exchange are usually expensive and sometimes not effective. Therefore, there is a need for some alternative technique which is efficient and cost effective. The search for new technologies involving the removal of toxic metals from waste water has directed attention to biosorption and chemisorption.
In pursuit of low cost adsorbents for the removal of metal ions from aqueous solutions, our attention was drawn towards a readily available and commonly used amorphous solid material — class room chalk. We tried powdered chalk for the removal of arsenic, iron and copper from aqueous solutions for the reason that it has large surface area and microporous character. But we got encouraging results only for copper ions.
In the present work, adsorption of copper (II) from aqueous solutions on powdered chalk was studied as a function of different parameters : contact time (t), mass of the adsorbent (w) and initial concentration (Ci)of the adsorbate. Sorption isotherms were tested for Langmuir and Fruendlich as well as for first and second order kinetic equations.
Material and Methods
The adsorbent, powdered chalk, was primarily heated in an oven at 1050 C for 24 hours and cooled in a desiccator before use in the adsorption process.
Kinetics Batch Adsorption Experiments
Batch adsorption experiments were carried out at ambient temperature. The effects of contact time and mass of the adsorbents were studied by using some common kinetics and equilibrium models. The estimation of Cu (II) ion was carried out spectrophotometrically7.
Effect of agitation time
For the determination of the effect of the agitation time, 1 g of the adsorbent was stirred with a 25 mL solution of copper (II) ions of initial concentration 15 mg/L at specific time intervals. At the end of each time, the solution was filtered rapidly and the copper (II) ion content of the filtrate determined. The difference between the initial (Ci) and the final (equilibrium) (Ce) concentrations was used to calculate the percent removal (% R) of cupric ions using equation (1):
Effect of the amount of adsorbent:
In order to determine the effect of the amount of adsorbent, different masses of the adsorbents (0.5-3g) were treated with 25 ml solution of the copper (II) ion of initial concentration 15 mg/L.
Batch equilibrium experiments
For each run the adsorbent was mixed with 25 ml solution of cupric ion at different initial concentrations (7-30 mg/L). The suspensions were stirred for 60 minutes by using a magnetic stirrer. The amount of copper ions adsorbed per unit mass of the adsorbent at aquilibrium, qe (mg/g) was calculated using equation (2):
where, Ci and Ce are copper ion concentrations initially and at equilibrium respectively, V the volume of the solution (mL) and w (gm) the adsorbent mass. The equilibrium data were then fitted by using the Langmuir and the Freundlich adsorption isotherm models.
Langmuir adsorption isotherm
One of the most common isotherm equations for modelling equilibrium data in solid-liquid systems, the Langmuir adsorption equation, is valid for monolayer adsorption onto a surface with a finite number of identical sites which are homogeneously distributed over the adsorbent surface8.The general form of the Langmuir equation is :
where, Ce is the equilibrium concentration of Cu2+ ion (g/L), qe is the amount of Cu2+ ion adsorbed per unit mass of the adsorbent , b is the Langmuir adsorption constant (L/mg) and qm is the maximum amount of adsorbate per unit mass of adsorbent to form a complete monolayer on the surface (mg/g). The linear form of this equation is as follows :
ka = adsorption rate constant.
kb = desorption rate constant.
Freundlich Adsorption Isotherm
Freundlich equation is an empirical equation based on the adsorption on a heterogeneous surface.
qe = kfCe 1/n ………………………………………. (5)
where, Ce is the equilibrium concentration of copper ions (g/L) , qe is the amount of copper ions bound per gram of the adsorbent at equilibrium (mg/g) , kf and n are the Freundlich constants related to sorption capacity and sorption intensity of the sorbent, respectively . The linear form of the Freundlich isotherm equation is:
log qe = log kf + log Ce …………………………….. (6)
[ n= 1/nf : where , nf =Adsorption affinity (dimentionless)]
Kinetic adsorption experiments
Kinetic adsorption experiments were conducted using a series of 25 mL solutions containing fixed amounts of adsorbent and cupric ions. The solutions were vigorously agitated with a magnetic stirrer for increasing time intervals. At the end of each run, the solution was filtered and the Cu2+ ion concentration in the filtrate was determined. This study has been carried out for two different Cu2+ concentration. Following kinetics models have been used to fit experimental data.
The pseudo-first order model
The pseudo-first order equation of Lagergran is generally expressed as follows9:
where, qe and qt are the sorption capacities at equilibrium and at time, t respectively (mg.g-1) and k1 is the rate constant of pseudo-first order sorption (L.min-1). Equation (7), after integration and applying boundary conditions, t = 0 to t = t and qt = 0 to qt = qt, becomes :
The pseudo-second order model :
The pseudo-second order chemisorption kinetic rate equation is expressed as 10 :
where, k2 is the rate constant of pseudo-second order sorption (g.mg-1.min-1).
The integrated and rearranged form of equation (9) is :
Results and Discussion
Effect of agitation time
The plot of % removal of cupric ions against varying contact times are shown in figure 1. Cu2+ ion uptake increases with increasing agitation time within 60 minutes and then it becomes nearly constant.
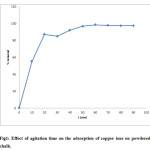 |
Figure 1: Effect of agitation time on the adsorption of copper ions on powdered chalk. Click here to View figure |
Effect of the amount of adsorbent
For this experiment, different masses of adsorbents were stirred with cupric ion solution for 60 minutes. The results are depicted in figure 2. Copper (II) ion adsorption percentage increases with adsorbent mass (m) significantly upto 1 g and then becomes constant. Increase in adsorption percentage is due to the increase in available number of binding sites when the amount of adsorbent mass increases11. Maximum adsorption percentage is 98.2% using powdered chalk at 1g sample weight.
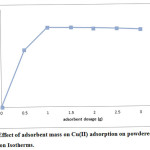 |
Figure 2: Effect of adsorbent mass on Cu(II) adsorption on powdered chalk. Click here to View figure |
Adsorption Isotherms.
Equilibrium studies were conducted with 1g of powdered chalk. These results are shown in figure 3.
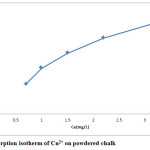 |
Figure 3: Adsorption isotherm of Cu2+ on powdered chalk. Click here to View figure |
Adsorption isotherm on powdered chalk is type I adsorption isotherm, characteristic of microporous adsorbent, chemical adsorption or physical adsorption limited to monolayer coverage.
Data obtained from these studies have been tested with the Langmuir and Freundlich linearized equations. These results are summarized in table 1. As these results show, adsorption isotherm is in agreement with the Langmuir adsorption isotherm. The higher is the b value, the stronger is the adsorbate-adsorbent interaction.
Table 1: Isotherm parameters for Cu2+ uptake from aqueous solutions.
| Adsorbent | Langmuir Parameters | Freundlich Parameters | ||||
| b | qm (mg/g) | r2 | kf | 1/n | r2 | |
| Powdered Chalk | 0.06 | 53.2 | 0.9724 | 0.33 | 0.88 | 0.9663 |
Kinetic modelling of Cu2+ ion adsorption
The kinetics of the adsorption of cupric ions has been studied using two kinetics models. In order to obtain parameters related to each kinetic model, experimental data have been tested with linear forms of these models. The straight-line plots are presented in figures 4 & 5. Parameters are given in table 2.
Table 2: Kinetic model parameters for Cu2+ adsorption on powdered chalk.
| Adsorbent | Powdered Chalk | ||
| Ci (mg.L-1) | 17 | 28.5 | |
| Pseudo-first order | k1/10-2 min-1 | 8.978 | 4.9 |
| qe (mg/g) | 3.9 | 6.1 | |
| r2 | 0.9949 | 0.9954 | |
| Pseudo-second order | k1/g.mg-1.min-1 | 7.843 x 10⁻³ | 1.083 x 10⁻³ |
| qe(mg/g) | – | – | |
| r2 | 0.9923 | 0.7614 | |
As evident from above results the adsorption of cupric ion on powdered chalk can be well described by the pseudo-first order kinetic model, with a correlation coefficient greater than 0.9900. The value of the rate constant decreases when initial Cu2+ ion concentration increases, suggesting that the adsorption mechanism of cupric ions on powdered chalk is the rate-limiting step12.
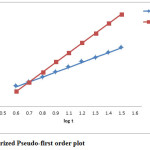 |
Figure 4 : Linearized Pseudo-first order plot. Click here to View figure |
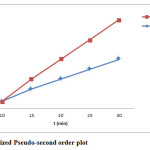 |
Figure 5: Linearized Pseudo-second order plot. Click here to View figure |
Conclusion
The present investigation reveals that powdered chalk is an efficient material for the remediation of copper (II) ion contamination. Maximum removal percentage of 98.2% can be achieved. Adsorption capacity is also quite high (qm =53.2 mg/g). Adsorbate-adsorbent interactions are also strong. Adsorption kinetics is pseudo- first order.
Acknowledgement
The authors are grateful to the University Grants Commission, New Delhi for providing financial assistance under Major Research Project Scheme.
References
- Klimmek S., Stan H. J., Wilke A., Bunke G. & Buchholz R., Environ. Sci. Technol., 35: 4283-4288 (2001).
- Hawari A. H. & Mulligan C. N., Bioresour Technol., 97: 692–700 (2006).
- Vilar V.J.P., Botelho C.M.S. & Boaventura A.A.R., Bioresour Technol., 99: 750-762 (2008).
- Yu B., Zhang Y.,Shukla A., Shukla S. S. & Dorris K. L., J. Hazard Mater., B 80: 33-42 (2000).
- Carson B. L., Ellis V. & McCann J. L., Toxicology and Biological Monitoring of Metals in Humans, 71, Lewis Publishers, Chelsa, Michigan, 133 (1986).
- Wang J., Process Biochem., 37: 847-850 (2002).
- APHA, Standard Methods of Examination of Water and Wastewater, 19th edition, American Public Health Association, Washington DC (1996).
- Langmuir I., J. Am. Chem. Soc., 40: 1361-1368 (1916).
- Lagergran S. & Kungliga S., Handlingar Band., 24(4): 1 (1898).
- Ho Y. S. & Mckay E., Can J. Chem. Eng., 76: 822-827 (1998).
- Krishnan K. A. & Anirudhan T.S., J. Hazard. Mater., 92: 161-183 (2002).
- Kushwaha Shilpi & Sodaye Srparna P., PETWAS., 33: 617 – 623 (2008).

This work is licensed under a Creative Commons Attribution 4.0 International License.
![]()
A New Edition of Web of Science
Journal Impact Factor
2022: 0.5
Five Year: 0.8
Journal is Indexed in

Cabells Whitelist
![]()


