Distribution of Silicon Compounds in Dungun River Basin, Southern South China Sea (Malaysia)
Yet Yin Hee1,2 and Suhaimi Suratman1,2*
1Institute of Oceanography and Environment, Department of Chemical Sciences, Faculty of Science and Technology, Universiti Malaysia Terengganu, 21030 Kuala Terengganu, Terengganu, Malaysia.
2Environmental Research Group, Department of Chemical Sciences, Faculty of Science and Technology, Universiti Malaysia Terengganu, 21030 Kuala Terengganu, Terengganu, Malaysia.
Corresponding Author E-mail: miman@umt.edu.my
DOI : http://dx.doi.org/10.13005/ojc/290217
A study was carried out in the Dungun River basin, Malaysia during the period of March-July 2003 to determine the distribution of silicon (Si) compounds such as dissolved inorganic silicon (DISi), total dissolved silicon (TDSi) and total particulate silicon (TPSi). The chlorophyll-a (chl-a) levels were also measured. Results showed that the concentration of DISi, TDSi, TPSi and chl-a were in the range of 1660-9084 μg/L Si, 1908-9294 μg/L Si, 34-564 μg/L Si and 0.46-5.26 mg/L, respectively. It was observed that the main source for Si in this study area probably contributed from the weathering of soils and rocks. Comparison between concentration of chl-a and Si compounds showed the phytoplankton related process only influenced the TPSi distribution in the water column. With respect to the Malaysian National Water Quality Standard (NWQS), the level of DISi is under natural level.
KEYWORDS:Surface water; dissolved and particulate silicon; NWQS, chl-a; Dungun River basin
Download this article as:| Copy the following to cite this article: Hee Y. Y, Suratman S. Distribution of Silicon Compounds in Dungun River Basin, Southern South China Sea (Malaysia). Orient J Chem 2013;29(2). |
| Copy the following to cite this URL: Hee Y. Y, Suratman S. Distribution of Silicon Compounds in Dungun River Basin, Southern South China Sea (Malaysia). Orient J Chem 2013;29(2). Available from: http://www.orientjchem.org/?p=22144 |
Introduction
Dungun River is situated in Dungun district facing the South China Sea at the east coast of Peninsular Malaysia. It is approximately 92 km and received runoff from its tributaries such as Telembuh, Lok, Loh and Perlis Rivers. From the initial survey, there are no major industrial activities except for the palm oil factory situated near Jerangau. Apparently, this river basin is important since it provides water for irrigation as well as for aquaculture, water supply and wastewater dilution for the surrounding areas. The population density within this river basin is concentrated at the towns of Dungun and Jerangau.
There is no published data on Si compounds in this study area. However, the quality of water in term of nutrients is important which would grant useful data on the subject of beneficial uses of the river water. It is well known that the presence of excess Si compound in water is an important issue related to the pollution to the environment, i.e. eutrophication phenomenon1,2. Si compound has been known in playing the important role in the primary productivity of the aquatic ecosystem such as diatoms3. However, large amount of algae caused by the excessive of nutrients could lead to oxygen-demanding material upon their death and lastly resulting in water pollution4. Therefore, it is necessary to establish the baseline record for future monitoring programme and also ensure the quality of the river water is suitable for the beneficial uses (Table 1). Determination of chl-a was carried out as an indicator of phytoplankton biomass in order to know the relationship between Si compounds and chl-a in the study area.
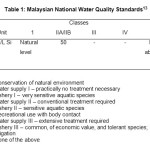 |
Table 1: Malaysian National Water Quality Standards13 |
Materials and Methods
Eight sampling stations i.e. D1, D2, D3, D4, D5, D6, D7 and D8 were identified and chosen along the Dungun River basin (Fig. 1). Surface water samples (~0.5m depth) were collected monthly from March until July 2003. All polyethylene bottles used for samples storage were acid-washed in 10% HCl, rinsed with deionized water and dried before used. Samples were immediately stored in icebox filled with ice after sampling and along the transportation process to the laboratory. After collection, filtration through 0.45 µm membrane filters was undertaken immediately and stored at -20 °C until analysis. Si compounds were analyzed based on standard colorimetric method5. In addition, the determination of chl-a was performed spectrophotometrically6.
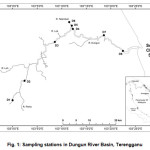 |
Figure 1: Sampling stations in Dungun River Basin, Terengganu |
Results and Discussion
DISi concentrations had significant variation in different stations (ANOVA test, p<0.05). DISi had shown clear differentiation for the concentrations among stations for 4 times sampling, ranging from 1660 to 9084 µg/L Si (Fig. 2). As mentioned by Wang et al.7, the main source of dissolved silicate to rivers is from the chemical weathering of soil and rocks. Station D1 in this study was located nearby to mountain and forest area, in which rocks is widely distributed. Therefore, it is unsurprising that upstream station recorded the highest DISi concentrations among 8 other stations. Moreover, a recent study done by Suratman & Tahir8 in Setiu Wetland presented the similar finding, in which weathering was the major sources of silicate. As can be seen, the presence of palm oil factory nearby station D5 had no obvious influence on DISi concentrations in study area, seeing that the DISi concentration of station D5 was the lowest among the 8 stations. This finding suggest that palm oil factory might not the main source in contribution of DISi in Dungun River basin, but natural sources such as weathering of soils and rock. According to the Malaysian NWQS classification, DISi was in Class I representing water body which is suitable for conservation of natural environment, protection of very sensitive aquatic species and for water supply with practically no treatment is necessary. However, no comparison could be made for TDSi and TPSi because these parameters are still not listed in NWQS for Malaysia.
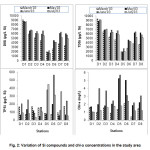 |
Figure 2: Variation of Si compounds and chl-a concentrations in the study area |
Similar to DISi, the distribution of TDSi concentration along the Dungun River basin showed the highest trend at station D1 (9294 µg/L Si) and the lowest at station D5 (1908 µg/L Si). Statistic analysis (ANOVA test) also displays that there was significant difference (p<0.05) between stations for TDSi study. Again, the finding suggests that weathering of rocks and soils at station D1 was most probably the main contributor for Si compounds in water column. In addition, there was strongly correlation (r2=0.9864) between DISi and TDSi in this study, suggests that DISi and TDSi were originated from the similar sources. In addition, living organisms also responsible to influence the TDSi concentration in the water column9. Carlisle10 has mentioned Si performs an important role by participating actively in metabolism and connective tissues in higher animals. Si compounds release back to water column as organic Si upon the death of these higher animals and rose up the concentration of TDSi. The forest-covered station i.e. station D1 appears to be the habitat for animals and thus, gave a significant effect on the concentration of TDSi in term of organic Si.
In contrast to DISi and TDSi, TPSi was generally higher at stations D5 and D6 in comparison to station D1. The TPSi concentrations were significant difference (ANOVA test, p<0.05) between sampling stations as the same with DISi and TDSi. The concentration of TPSi was in the range of 34 to 564 µg/L Si where highest concentration of TPP was observed at station D6. The result from correlation test between TPSi with DISi (r2=-0.1186) and TDSi (r2=-0.0732) indicate that the sources contributed to TPSi was different from DISi and TDSi in Dungun River basin. Tallberg et al.11 have suggested in their study that Si compounds uptake by algae or plants may be transformed into the water in particulate form upon their death. Generally, comparison between TPSi with chl-a shows that stations which exhibited higher chl-a concentration had higher TPSi concentration as the correlation test between TPSi with chl-a was positive (r2=0.3308). This finding suggests that TPSi concentration in Dungun River might received strong influence from algae or phytoplankton. The higher TPSi in water column might also result from the eroded rocks or soil, re-suspension of sediments, surface runoff and rivers discharges7,12, however this was not observed in this study as we suggest it might be from phytoplankton related process.
Previous studies have noted there were strong relationship between the distribution of chl-a and Si compounds in water column, where phytoplankton being the contributor for Si compounds in water column7,11. In this study, the concentration of chl-a is in the range between 0.46 to 5.26 mg/L. As can be seen from the histograms, there were not general trend of high concentration of chl-a during high concentrations of DISi and TDSi across the river (correlation test; DISi with chl-a, r2=-0.1061; TDSi with chl-a, r2=-0.1033). Conversely, as mentioned above, TPSi displayed higher concentration at the stations of higher chl-a concentration. This observation could suggest only chl-a in Dungun River influenced the distribution of TPSi.
Conclusion
In conclusion, DISi and TDSi concentrations in Dungun River basin primarily depend on the weathering of soils and rocks and therefore displayed higher concentrations at upstream station. The source of TPSi was varied with DISi and TDSi, in which phytoplankton and higher plants playing the role of contributor in distribution of TPSi. Based on the Malaysian NWQS, DISi was classified in the Class 1, which is under natural level.
Acknowledgement
The authors appreciated Department of Chemical Sciences, Faculty of Science and Technology, Universiti Malaysia Terengganu for the financial support in this project. The assistance of Ms. Yean Lai Yee in the sampling and analysis is kindly acknowledged.
References
- Presti, M., and Michalopoulos, P. Estimating the contribution of the authigenic mineral component to the long-term reactive silica accumulation on the Western Shelf of the Mississippi River Delta. Continental Shelf Research. 28: 823-838 (2008).
- Voss, M., Dippner, J. W., Humborg, C., Hurdler, J., Korth, F., Neumann, T., Schermewski, G., and Venohr, M. History and scenarios of future development of Baltic Sea eutrophication. Estuarine, Coastal and Shelf Science. 92:307-322 (2011).
- Li, M., Xu, K., Watanabe, M. and Chen, Z. Long-term variations in dissolved silicate, nitrogen, and phosphorus flux from the Yangtze River into the East China Sea and impacts on estuarine ecosystem. Estuarine, Coastal and Shelf Science. 71: 3-12 (2007).
- David, M. L. and Cornwell, D. A. Introduction to environment engineering. McGraw-Hill Inc., Boston Massacre (1998).
- Koroleff, F. Determination of silicon. In: Methods of seawater analysis, 2nd eds. Verlag Chemie, Weinheim, 419pp (1983).
- Parsons, T. R., Maita, Y. and Lalli, C. M. A manual of chemical and biological methods for seawater analysis. Pegamon International Library of Science, Technology, Engineering and Social Studies, Oxford, 173pp (1984).
- Wang, F., Yu, Y., Liu, C., Wang, B., Wang, Y., Guan, J. and Mei, H. Dissolved silicate retention and transport in cascade reservoirs in Karst area, Southwest China. Science of the Total Environment. 408: 1667-1675 (2010).
- Suratman, S. and Tahir, N. M. Concentrations of silicate compounds in surface water of Setiu Wetland: a preliminary study. Journal of Sustainability Science and Management. 7: 128-130 (2012).
- Ding, T.P., Gao, J.F., Tian, S.H., Wang, H.B. and Li, M. Silicon isotopic composition of dissolved silicon and suspended particulate matter in the Yellow River, China, with implications for the global silicon cycle. Geochimica et Cosmochimica Acta. 75: 6672-6689 (2011).
- Carlisle, E.M. Silicon as a trace nutrient. Science of the Total Environment. 73: 95-106 (1988).
- Tallberg, P., Lehtimäki, M. and Siipola, V. Distribution of silicon in soils and sediments of a small catchment area: similarities and differences. In 19th World Conress of Soil Science, Soil Solutions for a Changing World, 1-6 August 2010. 42-45 (2010).
- Dürr, H.H., Meybeck, M., Hartmann, J., Laruelle, G.G. and Roubeix, V. Global spatial distribution of natural riverine silica inputs to the coastal zone. Biogeosciences. 8: 597-620 (2011).
- DOE. Malaysia environmental quality report, 2001. Ministry of Natural Resources and Environment Malaysia, 86pp (2009).

This work is licensed under a Creative Commons Attribution 4.0 International License.
![]()
A New Edition of Web of Science
Journal Impact Factor
2022: 0.5
Five Year: 0.8
Journal is Indexed in

Cabells Whitelist
![]()


