Development and Validation of A UV Spectroscopic Method for Analysis of Paracetamol in Bulk Powder and Tablet
Suman Sharma1 , Ashutosh Pareek1 *, Richa Joshi1 , Yashumati R. Bhardwaj1 , Vivek Jain1 and Gunjan Jadon2
1Department of Pharmacy, Banasthali University, Banasthali - 304 022, India. 2Shrinathji Institute of Pharmacy, Nathdwara, Rajasthan - 313 001, India.
Article Received on :
Article Accepted on :
Article Published : 10 Jun 2013
The method has been developed and validated for the assay of Paracetamol using mixed solution of methanol and phosphate buffer 6.8 as a solvent in ratio of (1:3) (further diluted in phosphate buffer 6.8 only). The λ max (absorption maxima) of the drug was found to be 246 nm. Linear response was observed in the range of 2-24ìg/ml with a regression coefficient of 0.999. Furthermore various validation parameters as per ICH Q2B guideline were tested and found accordingly. The method and solution was significantly (P<0.05) stable for 15 days. The percent purity (99.09 %) and % Recovery at 80, 100 and 120 % were found to be 102.00±2.027, 102.10±4.913 and 100.00±4.819 respectively for marketed paracetamol tablets. Developed method was a less toxic, cheap, eco-friendly but equally sensitive spectroscopic method for quantitative determination of paracetamol for regular quality control purpose in laboratories.
KEYWORDS:Paracetamol; phosphate buffer 6.8; sandell's sensitivity; molar absorptivity
Download this article as:| Copy the following to cite this article: Sharma S, Pareek A, Joshi R, Bhardwaj Y. R, Jain V, Jadon G. Development and Validation of A UV Spectroscopic Method for Analysis of Paracetamol in Bulk Powder and Tablet. Orient J Chem 2013;29(2). |
| Copy the following to cite this URL: Sharma S, Pareek A, Joshi R, Bhardwaj Y. R, Jain V, Jadon G. Development and Validation of A UV Spectroscopic Method for Analysis of Paracetamol in Bulk Powder and Tablet. Available from: http://www.orientjchem.org/?p=11983 |
Introduction
Paracetamol or acetaminophen is active metabolites of phenacitin. It is a widely used over-the counter analgesic and antipyretic. Chemically, it is 4-hydroxy acetanilide (acetaminophen)[1]. Paracetamol and other NSAIDs all act by the same mechanism (inhibition of prostaglandin synthesis by inhibiting cyclooxygenase (COX)) and all show varying levels of analgesic, anti-inflammatory, antipyretic and anti-platelet actions [2-3]. Paracetamol is official in Indian Pharmacopoeia and British Pharmacopoeia. Both compendia suggest titrimetric and UV spectrophotometric assay method for paracetamol in bulk and tablet formulations. Numerous methods like titrimetry [4–5], voltammetry[6], fluorimetry [7] colorimetry[8], UV-spectrophotometry[9−10], quantitative thin-layer chromatography (TLC) [10], high-performance liquid chromatography (HPLC)[11−13]and gas chromatography (GC)[14] have been reported for the analysis of paracetamol alone and its combinations in pharmaceuticals. Method development is the setting up of an analytical procedure that will be appropriate for the analysis of a particular sample and makes the analysis simpler, sensitive and easier. Literature reveled that most of analytical work has been performed using H.P.L.C. method which is complex, time consuming and very costly. Besides in many official compendia organic solvents have been used for the analysis of Paracetamol which are toxic, and costly. For this reason, in present study we tried to develop a less toxic, cheap, eco-friendly but equally sensitive spectroscopic method for quantitative determination of paracetamol for regular quality control purpose in laboratories. In line to this we used solution of methanol and phosphate buffer 6.8 (in 1:3 ratio) for initial mixing, and further diluted with phosphate buffer 6.8 in place of pure methanol and compared this method with already existed method of pure methanol. So, based on our literature survey and need of today, we have tried to develop a new method which is easier, sensitive, cost effective and eco-friendly which can be easily performed in laboratory using simple instrument like UV-spectrophotometer.
Materials And Methos
Instruments
UV-Visible double beam spectrophotometer (3000, lab India) with spectral bandwidth of 0.1 nm and wavelength accuracy of 0.5 nm and a pair of 10 mm matched quartz cell was used.
Material
The Paracetamol (purity 99.99%) sample was purchased by S.D. Fine Chem. Limited, India and used as reference standard. The commercial fixed dose formulation containing paracetamol (Paracip: 500mg Cipla) was purchased from local pharmacy shop. Methanol (Merck, Germany) and phosphate buffer 6.8 was used as a solvent for the preparation of stock and working standard solution in the study. All the chemical and reagents were of analytical grade.
Preparation of standard stock solutions
The Standard stock solution of pure paracetamol (1mg/ml) was prepared by dissolving 100 mg paracetamol in 100 ml solution of methanol and phosphate buffer 6.8 (in 1:3 ratio) in 100 ml volumetric flask with vigorous shaking and further sonicated for about 10 minutes. From this solution 10 ml was taken and diluted to 100ml with phosphate buffer 6.8 to get a stock solution containing 100 µg/ml of drug. The stock solution was filtered through Whatmann filter paper No.41. The above process is repeated by using methanol to prepare same concentration of paracetamol in methanol also. Then solution was further diluted with phosphate buffer 6.8 to get various working solutions.
Determination of absorption maxima
A UV absorption maximum was determined by scanning 10µg/ml solution of paracetamol in phosphate buffer 6.8, in between 200-400 nm by using UV-visible spectrophotometer. Further a representative spectrum was drawn of paracetamol in phosphate buffer 6.8. The same procedure was repeated using methanol.
Preparation of Calibration curve
The standard solutions for the drug having concentration 2, 4, 6, 8, 10, 12, 14, 16, 18, 20 and 24μg/ml was prepared with phosphate buffer 6.8 from the stock solution. The absorbance of solutions of pure paracetamol drug were measured at 246 λ max and a calibration curve was plotted between absorbance v/s concentration to get the linearity and regression equation which has shown in figure 2.
Preparation of Sample solutions for assay
For quantification of drugs from the commercial formulation, 10 tablets of paracip, containing 500 mg paracetamol each were weighed and crushed into powder. A weighed quantity of tablet powder equivalent to 100 mg of paracetamol was transferred into a 100 ml volumetric flask, diluted with methanol: phosphate buffer 6.8 (in 1:3 ratio) and further sonicated for 10 min. Then the resulting solution as allowed to stand for some time, filtered through Whatman filter paper No.41 and the filtrate as suitably diluted to produce the desired concentration using phosphate buffer 6.8. The absorbance of the solution was measured at 246nm.
Recovery studies
The uniform powder of twenty tablets with average weight equivalent to amount of 100mg paracetamol was transferred into 100ml volumetric flask. Approximately 25 ml of methanol was added. Then add phosphate buffer 6.8 up to 100ml with continuously shaking in vortex mixer until uniform mixture was not formed. Appropriate aliquots of paracetamol within the beer’s law limit were taken and samples were tested for percentage purity and recovery test at three different levels (80%, 100 %and 120%).
Stability Testing
The sample was subjected for stability studies under room temperature. Stabilities were studied by performing experiment to check the changes the absorbance with the freshly prepared standard solution. [15] The calibration curve was plotted on 1, 3, 7, and 15th day using the stock solution. Data were subjected for ANOVA post hoc dunnett’s testing using P<0.05 as significance level.
Statistics
All the data were tested by ANOVA followed by post hoc dunnett’s test using statistical software Graph pad prism 5. The level of significance was considered P<0.05.
Results and Discussion
The absorption maximum of paracetamol was found to be 246 nm in hydro alcoholic solution (3:1) further diluted with phosphate buffer 6.8 and was 243 in pure methanol as shown in figure 1. The method was further validated according to ICH Q2B guidelines for validation of analytical procedures in order to determine the linearity, sensitivity, precision and accuracy for the analyte. All the comparative results were shown in table 1.
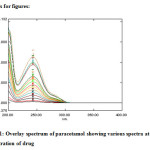 |
Figure 1: Overlay spectrum of paracetamol showing various spectra at different concentration of drug.
|
Accuracy
The accuracy of the developed methods was determined by calculating % recovery at three different levels (80%, 100% and 120%) in pre analyzed samples using standard addition method. The % recovery for Paracetamol in solution of methanol and phosphate buffer 6.8 (2:1 ratio) at level 80%,100%,120% were found to be 102.0±2.027, 102.1±2.913, 100.02±4.819 and for Paracetamol in methanol was 99.90±3.17 ,99.97±2.27, 100.11±1.68 respectively. From the recovery study it is clear that the method is accurate for quantitative estimation of paracetamol, in tablet dosage form as the statistical parameters are within the acceptance range. [16]
Table 1: Validation parameters for paracetamol in different solvents
| S. No. | Validation Parameter |
Values |
|
|
Phosphate buffer 6.8: Methanol (3:1) |
Pure methanol |
||
|
1. |
λ max |
246 |
243 |
|
2. |
Regression coefficient(r2) |
0.999 |
0.998 |
|
3. |
Equation of straight line |
y=0.061x+0.093 |
y=0.112x+0.007 |
|
4. |
LinearityRange (μg/ml) |
2-24ug/ml |
2-44ug/ml |
|
5. |
LOD(μg/ml) |
0.3275 |
0.432 |
|
6. |
LOQ(µg/ml) |
0.9836 |
1.440 |
|
7. |
Precision (%COV) |
0.999 |
0.9213 |
|
8. |
Inter Day (% RSD) | ||
|
a. |
1st Day |
0.053 |
0.033 |
|
b. |
2nd Day |
0.050 |
0.037 |
|
c. |
3rd Day |
0.052 |
0.041 |
|
9. |
Intra Day(% RSD) | ||
|
a. |
1st hours |
0.039 |
0.031 |
|
b. |
3rd hours |
0.040 |
0.025 |
|
c. |
5th hours |
0.041 |
0.025 |
|
10. |
Molar Absorptivity (L mol-1 cm-1) |
0.44×10⁴ |
0.906 × 10⁴ |
|
11. |
Sandell’s sensitivity (µg/cm2/0.001absorbance unit) |
0.0178 |
0.0164 |
|
12. |
Accuracy 80%100%120% |
102.00±2.027 102.10±2.913 100.00±4.819 |
99.90±3.17 99.97±2.27 100.11±1.68 |
Precision
Precision is the degree of aggregate among individual test results when a method is applied repeatedly to multiple sampling of homogenous sample is known as precision of the analytical method [17]. Variation in intra-day and between days (inter-day) was analyzed. The Intra-day and Inter-day precision was determined by analyzing same concentration of paracetamol (10µg/ml). The % RSD value of <2% suggests that the developed method are précised.
Linearity and range
The working standard solutions for the drug having concentration 2 to 24μg/ml were prepared with phosphate buffer 6.8 from the stock solution. The linearity was determined by plotting standard calibration curves for the concentration range 2-24 µg/ml at 246 nm for developed method as shown in figure 2.
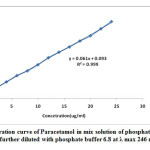 |
Figure 2: Calibration curve of Paracetamol in mix solution of phosphate buffer 6.8 and Methanol (3:1) further diluted with phosphate buffer 6.8 at λ max 246 nm LOD (Limit of Detection) and LOQ (Limit of quantification) |
The limit of detection (LOD) of paracetamol was evaluated from the slope (S) of their respective calibration curve and the standard deviation of the blank (σ) using equation as [18]:
LOD =3.3σ/S
LOQ (Limit of Quantification) Value is the minimum quantity of drug that can be quantified by the instrument. The LOQ of paracetamol were evaluated from the slope(S) of their respective calibration curve and the standard deviation of the blank (σ) using equation as:
LOQ =10σ/S
LOD and LOQ were found to be 0.3275, 0.9836 for paracetamol in new developed method and 0.132, 1.32 for Paracetamol in methanol.
Stability
The sample was subjected for stability studies under room temperature. Stabilities were studied by performing experiment to check the changes the absorbance with the freshly prepared standard solution [15]. The solution under room temperature was stable up to 15 days. The comparative graph has been drawn in between absorbance and concentration as shown in (figure- 3) at different days. Result suggested that up to 15 days all the data are significantly similar (P<0.05).
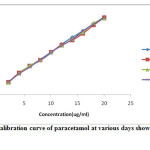 |
Figure 3: Calibration curve of paracetamol at various days showing Stability testing. |
Assay of paracetamol in marketed tablet
Percentage purity of Marketed tablet was found to be 99.99 % for the new developed method.
Conclusion
From the above results and data, it may be concluded that the proposed new method is simple, sensitive, eco-friendly, precise, and cost-effective. Besides this developed method has suitability for daily laboratory practice.
Acknowledgement
The authors are grateful to Department of Science and Technology (DST) New-Delhi (India) for providing financial assistance to Banasthali Centre for Education and Research in Basic Sciences under their CURIE (Consolidation of University Research for Innovation and Excellence in WomenUniversity) programme.
References
- Amit KN. Comparative in vitro dissolution assessment of some commercially available paracetamol tablets. Int J Pharm Sci Review and Research 2(1): 29-30, (2010).
- Byrant B, Knights K, Salerno E. Pharmacology for health professionals: Elsevier; (2007).
- Hinz B, Cheremina O, Brune K. Acetaminophen (paracetamol) is a selective cyclooxygenase-2 inhibitor in man. FASEB J 22 (2): 383–390, (2008).
- British Pharmacopoeia CD. The Stationery Oce Ltd. Norwich. 2, (1998).
- European Pharmacopoeia. Convention on the Elaboration of a European 3: 748- 749 (1997).
- Pharmacopoeia (European Treaty Series No. 50) Strasbourg (1996).
- Lau OV, Luk SF, Cheung YM. Simultaneous determination of ascorbic acid, caffeine and paracetamol in drug formulations by differential-pulse voltammetry using a glassy carbon electrode. Analyst 1047-1051, (1989).
- El Obeid HA, Al-Badr AA. Analytical profiles of drug substances. Acetaminophen. In: Florey K, editor. London: Academic Press 551–596 (1985).
- Erk N, Onur F. Simultaneous determination of analgine and paracetamol in tablets by spectrophotometric methods. Analytical Lett 30 (6): 1201-1210 (1997).Dogan HN. Simultaneous determination of acetaminophen, Dipyrone and caffeine in pharmaceutical preparations by the absorbance ratio technique. Pharmazie 51 (10):773-774 (1996).
- Kahela P, Laine E, Anttila M. A Comparison of the Bioavailability of Paracetamol from a Fatty and a Hydrous Suppository Base and the Effect of Storage on the Absorption in Man Drug Development. Indian Pharm 13 (2): 213-224 (1987).
- Sisco WR, Rittenhuse CT, Everhart LA, McLaughlin AM. Simultaneous High Performance Liquid Chromatography stability indicating analysis of Acetoaminophen, Codiene phosphate and sodium benzoate in elixirs. J Chromatogr 354: 355-366 (1986).
- Hossain M, Ayres JW. Relative bioavailability of a novel sustained-release acetaminophen molded tablet. Int J Pharm 133: 223-235 (1996).
- Bisceglia KJ, Yu JT, Coelhan M, Bouwer EJ, Roberts AL. Trace determination of pharmaceuticals and other wastewater-derived micropollutants by solid phase extraction and gas chromatography/mass spectrometry. J Chromatogr. 1217 (4):558-64 (2010).
- Matoga M, Pehoureq F. Rapid HPLC measurement of Venlafaxine and O-desmethyl Venlafaxine in Human plasma. J Chromatogr B Biomed Sci Appl 760: 213-218 (2001).
- Yuen KH, Peh KK, Quah YL, Chan KL. A Novel Simultaneous HPLC Assay of serum Paracetamol and Sulphpyridine as Markers of Gastric Emptying and Orocaecal Drug Development. Indian Pharm 23(2): 225-228 (1997).
- Altun ML. HPLC Method for Analysis of Paracetamol Caffeine and Dipyrone. Turk J Chem. 26:521-528 (2002).
- Gandhimathi R, Vijayaraj S, Jyothirmaie MP. Method development and validation of uv-spectroscopic method for estimation of asenapine maleate in bulk and tablet formulation. Int J med chem anal 85-92 (2012).

This work is licensed under a Creative Commons Attribution 4.0 International License.
![]()
A New Edition of Web of Science
Journal Impact Factor
2022: 0.5
Five Year: 0.8
Journal is Indexed in

Cabells Whitelist
![]()


