Adsorptive Removal of Rhodamine-B by Agricultural Waste
E. Porselvi1 and P. Krishnamoorthy2
1Department of Chemistry, Bharathiar university .working at Department of Chemistry, Arignar Anna Govt Arts College, Cheyyar, India.
2Department of Chemistry, Dr.Ambedkhar, Govt Arts College, Vyasarpadi, Chennai, India.
Activated carbon prepared fromAsadiractaIndica (neem)Seed Hull (AIH)was used for removal of Rhodamine-B (RDB) dye fromaqueous solutions. The process was studied as a function of contact time, adsorbent dose andpH. Adsorption process was attained to the equilibrium within 90 min for initial dye concentrations of 80 mg /l. pH 5 was optimum condition for adsorption of dye at room temperature, and the maximum dye removal at that pH was 83.56 %. The isotherm data could be well described via Langmuir equation andFreundlichequations.Kinetic studies revealed that the experimental data correlated well with pseudo second-order model
KEYWORDS:Adsorption; Isotherm; Kinetic; Rhodamine-B; Activated Charcoal
Download this article as:| Copy the following to cite this article: Porselvi E, Krishnamoorthy P. Adsorptive Removal of Rhodamine-B by Agricultural Waste. Orient J Chem 2013;29(2). |
| Copy the following to cite this URL: Porselvi E, Krishnamoorthy P. Adsorptive Removal of Rhodamine-B by Agricultural Waste. Orient J Chem 2013;29(2). Available from: http://www.orientjchem.org/?p=22225 |
Introduction
Colour removal from industrial effluents had been of significant concern due to theenvironmental problems1,2. The presence of very low concentrations of dyes in effluent was highly visible and undesirable. Wastewaters from the textile industry commonly containmoderate concentrations (10-200 mg/l) of dyestuffs, contributing significantly to thecontamination of aquatic ecosystems3. Dyes were chronic and acute effects on livingorganisms affect the nature of water and inhibit sunlight penetration into the stream whichavoids photosynthesis action4. Therefore, environmental legislation had imposed steadylimits on the concentrations of contaminants, which might be discharged in aqueous effluents from manufacturing and textile industries.The removal of colour from effluents was one of the major environmental problems. In this concern adsorption process had been found to be more effective method for the treatment of dye containing wastewater. The most efficient and commonly used adsorbentwas commercially activated carbon which is expensive and has regeneration problems. Recent investigations focused on effectiveness of low cost adsorbents like pearl millet husk, neem leaf powder, coconut husk, wheat straw, sewage sludge, perlite, maize cobs, natural adsorbent, bio mass slurry, chitin, agricultural waste5-13 in the removal of dyes from wastewater effluent.
In the present study the adsorption of RDBdye onAIH had beeninvestigated. The effect of various parameters such as effect of time, pH, temperature,adsorbent dose,isotherm and kinetic studies have been investigated in the batch experiments.
Materials and Methods
Materials
Clean and dried neemseed hull was carbonized with concentrated sulphuric acid in the weight ratio of 1:1(W/V). The resulting carbon was washed with distilled water until a constant pH of the slurry was reached. Then the activation of carbon was done by heating the biomass for four hours at 100°C in a hot air oven. The dried material was ground well to a fine powder,sieved and stored in air tight glass bottles for further studies.All chemicals used were of high purity, commercially available ARgrade. Stock solutions of 1g/l of dyes were prepared using doubly distilled water.
Methods
Rhodamine-B (RDB) dyesolution of known concentrating were made. From that, 50 ml of 80 mg/l dye solutions were taken and loaded with the 75 mg of activated carbon adsorbent for various batch experiments. After that samples were withdrawn from the shaker and centrifuged. Then there were analyzed in UV-Visible spectrophotometer.(Elico Model No: SL150) Dye concentration in the supernatant solution was estimated by measuring absorbance at maximum wavelength 545 nm andcomputing from a calibration curve. Kinetics of adsorption was determined by analyzing adsorptive uptake of the dye colour from aqueous solution at different time intervals. The isothermal studies were performed by varying the initial dye concentrations from 10 to 80 mg/l by shaking the reaction mixture at 180 rpm for the equilibrium time. Influence of the pH was studied by adjusting the reaction mixture to different initial pH (2 to 12) value using 0.1M Hydrochloric Acid or Sodium Hydroxide before addition of adsorbent (AIH).The amount of dye adsorbed onto seed hull, the adsorption capacity at steady-state Qe(mg/g), was calculated by mass balancerelationship equation.
![]()
where,C0 and Ce are the initial and equilibrium liquid-phase concentrations ofdye, respectively (mg/l), V is the volume of the solution (l) and W is the mass of the adsorbent used (g).
Results and Discussions
Effect of Contact Time
The percentage of dye adsorbed at different time is calculated by keeping the concentration as 80 mg/l and the mass of adsorbent 0.75g. The results are shown in Fig. 1. It was observed that the rate of removal of RDB increases with increase in contact time.After 60 minutes the solution attains equilibrium. This time was taken as equilibrium time for subsequent experiment14.
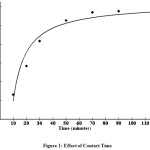 |
Figure 1: Effect of Contact Time Click here to View figure |
Effect of Carbon Dose
The adsorption of the dyes on carbon is studied by varying the carbon dose (0.5 – 2.5 gm/ml) for RDB of concentration 80 mg/l The percentage of adsorption increases with increase in the carbon concentration (Fig. 2). This is attributed to increase carbon surface area and availability of more adsorption sites. The adsorption of the dye increased from 71% to 83% with the increase in adsorbent dose. This observation is consistent with Langmuir hypothesis of an increasing competition among adsorbent particles for organic substances with increasing number of adsorbent particles per unit volume15, 16.
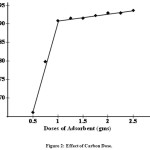 |
Figure 2: Effect of Carbon Dose. Click here to View figure |
Effect of pH
The experiments carried out at different pH show that there is a change in the percent removal of dyes over the entire pH range of 2 to 12 as shown in the Fig. 3. This indicates the strong force of interaction between the dyes and the activated carbon that, either H+ or OH– ions could influence the adsorption capacity. Here the interaction is larger at pH 6 due to the competence of acidic H+ ionwith dye cation for the adsorption sites. The percentage of adsorption increases above this pH value due to the presence of ionic COOH groups. The adsorption of dyes on the activated carbon does involve ion exchange mechanism. Due to this mechanism there should be an influence on the dye adsorption while varying the pH17.
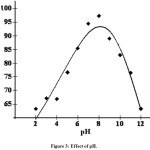 |
Figure 3: Effect of pH.
|
Adsorption Isotherm
The experimental data are analyzed according to the linear form of the Langmuir and Freundlich isotherms. The Langmuir isotherm is represented by the followingequation (Langmuir and Amer, 1918).
![]()
Here Ce is the equilibrium concentration (mg/l), Qe is the amount adsorbed at equilibrium (mg /g) and Qm and b are Langmuir constants related to the adsorption efficiency and energy of adsorption, respectively. The linear plots of Ce/Qe versus Ce suggest the applicability of the Langmuir isotherms
The values of ,Qmand b were determined from the slope and intercept of the plots as 90.91and 0.0666 respectively. From the results, it was found that the adsorption efficiency Qm and adsorption energy b of the carbon (Fig. 4). From the values we can conclude that the maximumadsorption corresponds to a saturated mono-layer of adsorbate molecules on an adsorbent surface with constant energy and no transmission of adsorbate in the plane of the adsorbent surface occurs. The trend shows that the adsorbent prefers to bind acidic ions and that special ion predominates on sorbent characteristics, when ionexchange is the predominant mechanism. To confirm the favourability of the adsorptionprocess, the separation factor (RL) value was found to be 0.0982 and confirm that the ongoing adsorptionprocess was favourable 18.
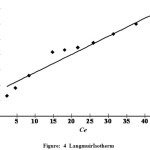 |
Figure 4: LangmuirIsotherm
|
The Freundlich equation was also employed for theadsorption of Rhodamine-B (RDB) dye on the adsorbent. The Freundlich isotherm (Freundlich, 1906) is represented as
![]()
Here Qeis the amount of Rhodamine-B (RDB) adsorbed (mg/g),Ce is the equilibrium concentration of dye in the solution(mg/l) and Kf and n are constants incorporating all factors affecting the adsorption capacity and intensity of adsorption, respectively. Linear plot of log Qe versus logCe shows that the adsorption of RDB dye follows also the Freundlich isotherm (Fig. 5). Thevalues of Kfand n found tobe 10.715 and 2.101 respectively showed the increase of negative charge on the surface that enhances the electrostatic force between the carbon surface and the dye ion, which increases in turn the adsorption of dyes. The values clearly show the dominance of adsorptioncapacity. The intensity of adsorption is an indication for the bond energies between dye and the adsorbent and the possibility of a slight chemisorption rather than physisorption. The possibility of multilayer adsorption of dyes through the percolation process could not be ruled out.However, the values of n is greater than one indicating that the adsorption is much more favourable19
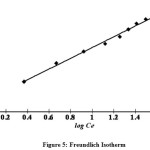 |
Figure 5: Freundlich Isotherm Click here to View figure |
Kinetics of Adsorption
The kinetics of sorption described the solute uptake rate,which in turn governs the residence time ofadsorption reaction. It was one of the important characteristics in defining the efficiency of adsorption. In the present study, the kinetics of dyes removal was carried out to understand the behaviour of this low cost carbon adsorbent.
From the values of correlation coefficient (0.970 and 0.984) it was found tobe that pseudo second order was better than the other one (Fig. 6 & 7).Similar results have been reported for adsorptionof reactive dyes20,21,22
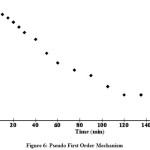 |
Figure 6: Pseudo First Order Mechanism
|
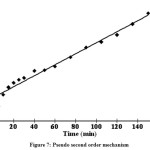 |
Figure 7: Pseudo second order mechanism Click here to View figure |
Conclusions
The results of the present work indicate that the activated carbon prepare from AsadiractaIndica seed hull is a promising adsorbent for the removal of Rhodamine-B form aqueous solutions.Maximum adsorbtion of dyes takes place when the pH of solution is at 6, the mass of adsorbent used is 0.75 mg and the equilibrium time is 60 minutes. The experimental data correlated reasonably well with the Langmuir and Freundlich adsorption isotherms and the respective isotherm parameters show that both the isomers are followed and the kinetic study reveals that the reaction order fits with pseudo second order.
Thus the present study proves that the adsorbent has potential to remove the dye and also more efficient and economical.
References
- R. Sanghi and B.Hatiachrya, Color Techno.,118,p.256-269, (2002).
- S. Wang, Y. Boyjoo, A. Choueib and H. Zhu, Water Res,.39p.129-138, (2005).
- C. O’Neill, F.R. Hawkes, N.D. Lourenco,H.M. Pinheiro, and W.J. Delee,, J. Chem. Technol. Biot.,74,p.1009-1018, (1999).
- Y.M. Slokar, and M. Le Marechal,Dyes Pigments,37,p.335-356, (1998).
- K.Selverani, Ph.DThesis, REC, Tiruchirapalli, India, (2000).
- G.M.Walkerand L.R.Weatherly, Environ. Pollution, 99, p.133-136, (1998).
- K.S.Low and C.K. Lee , J. Pertanika, 13, p.221-226, (1990).
- T.Robinson. B, Chandaran andP.Nigam.Water Research, 36, p.2830-2842, (2002).
- V.K.Verma and A.K. Mishra , Ecol. Environ. & Conservation, 12 (4), p.755-757, (2005).
- M.Otero.M. Rozada.L.F. Calvo., Garcia A.I. and Moran A., (2003),
- G.MaKay , HS Blair and JR Gardner , J. Appl. Sci.27, p.3042, (1982).
- G.McKay, J. Chem. Tech. Biotechnol. 32, p.759, (1982).
- G.McKay, and VJP.Poots, J. Chem. Tech.Biotechnol., 30,p.279, (1980).
- Sumanjit, Tenjinder Pal singhWalia andIshuKansal,J. Surface Sci. Technol., 24, p.179-193, (2008).
- M.N.V. Ravi Kumar, React.Funct. Polym,.46 ,p.1–27, (2000).
- H. Yoshida, S. Fukuda, A. Okamato, and T. Kataoka,,Water Sci. Technol. 23, p.1667–1676, (1991).
- R.Sivaraj,C, Namasivayam,and K. Kadirvelu., Waste Manag., 21,p.105, (2001).
- V.Vadivelanand K.Vasanthkumar.,J. Colloid. Interface Sci., 286, p.91, (2005).
- EJ.Weber andVC.Stickney, Water Res., 27, p.63, (1993).
- Y.S. Ho and G. McKay, Chem. Eng. J.,70, p.115-124, (1998).
- S. Senthikumaar, P. Kalaamani, K.P.R. Varadarajan, and C.V. Subburaam, Bioresource Technol., 97, p.1618-1625, (1998).
- M.Abassi.andN.R.Asl.,J. Iran. Chem. Res.,2, p.221-230, (2009).

This work is licensed under a Creative Commons Attribution 4.0 International License.
![]()
A New Edition of Web of Science
Journal Impact Factor
2022: 0.5
Five Year: 0.8
Journal is Indexed in

Cabells Whitelist
![]()


