Quantitative Structure Property Relationships Study of Mobility of Some Benzoaromatic Carboxylate Derivatives by Partial Least Squares and Least-Square Support Vector Machine
Hamideh Hamzehali and Ali Niazi*
Department of Chemistry, Faculty of Science, Islamic Azad University, Arak Branch, Arak, Iran.
Article Received on :
Article Accepted on :
Article Published : 19 Oct 2016
A quantitative structure-property relationship (QSPR) study is suggested for the prediction of mobilities (m) of benzoaromatic carboxylates. Ab initio theory was used to calculate some quantum chemical descriptors including electrostatic potentials and local charges at each atom, HOMO and LUMO energies, etc. Also, Dragon software was used to calculate some descriptors such as WIHM and GETAWAY. Modeling of the mobility of benzoaromatic carboxylate derivatives as a function of molecular structures was established by means of the least squares support vector machines (LS-SVM). This model was applied for the prediction of the mobility of benzoaromatic carboxylates, which were not in the modeling procedure. The resulted model showed high prediction ability with root mean square error of prediction (RMSEP) of 3.734, 1.931 and 0.018 for MLR, PLS and LS-SVM, respectively. Results have shown that the introduction of LS-SVM for quantum chemical, WIHM and GETAWAY descriptors drastically enhances the ability of prediction in QSAR studies superior to multiple linear regression (MLR) and partial least squares (PLS).
KEYWORDS:Benzoaromatic carboxylate; Mobility; Ab initio; GETAWAY; WHIM; MLR; PLS; LSSVM
Download this article as:| Copy the following to cite this article: Hamzehali H, Niazi A. Quantitative Structure Property Relationships Study of Mobility of Some Benzoaromatic Carboxylate Derivatives by Partial Least Squares and Least-Square Support Vector Machine. Orient J Chem 2013;29(1). |
| Copy the following to cite this URL: Hamzehali H, Niazi A. Quantitative Structure Property Relationships Study of Mobility of Some Benzoaromatic Carboxylate Derivatives by Partial Least Squares and Least-Square Support Vector Machine. Available from: http://www.orientjchem.org/?p=22557 |
Introduction
Separation selectivity in capillary zone electrophoresis is determined by the relative difference in the total ionic mobility of the separands. In capillary zone electrophoresis with electroosmotic flow, this total mobility consequently consists of two incremental parts, the nonspecific mobility of the electroosmotic flow, and the individual effective mobility of the solutes. The effective mobility, meff., depends on the degree to which the particle is charged and the mobility of the fully charged particle.1-3
The main aim of QSAR studies is to establish an empirical rule or function relating the structural descriptors of compounds under investigation to mobility in this study. This rule of function is then utilized to predict the same properties of the compounds not involved in the training set from their structural descriptors. Whether the properties can be predicted with satisfactory accuracy depends to a great extent on the performance of the applied multivariate data analysis method, provided the property being predicted is related to the descriptors. Among the investigation of QSAR,4 one of the most important factors affecting the quality of the model is the method to build the model. Many multivariate data analysis methods such as multiple linear regression (MLR),5,6 partial least squares (PLS)7 and artificial neural network (ANN)8 have been used in QSAR studies. MLR, as most commonly used chemometrics method, has been extensively applied to QSAR investigations. However, the practical usefulness of MLR in QSAR studies is rather limited, as it provides relatively poor accuracy. ANN offers satisfactory accuracy in most cases but tends to overfit the training data. The support vector machine (SVM) is a popular algorithm developed from the machine learning community. Due to its advantages and remarkable generalization performance over other methods, SVM has attracted attention and gained extensive applications.9,10 As a simplification of traditional of SVM, Suykens and Vandewalle11 have proposed the use of least-squares SVM (LS-SVM). LS-SVM encompasses similar advantages as SVM, but its additional advantage is that it requires solving a set of only linear equations (linear programming), which is much easier and computationally more simple.
A major step in constructing QSAR models is finding one or more molecular descriptors that represent variation in the structural property of the molecules by a number.12-14 A wide variety of descriptors have been reported to be used in QSAR analysis. Recent progress in computational hardware and the development of efficient algorithms have assisted the routine development of molecular quantum chemical calculations. Quantum chemical calculations are thus an attractive source of new molecular descriptors, which can, in principle, highest occupied molecular orbital (HOMO) and lowest unoccupied molecular orbital (LUMO) energies, molecular polarizability, dipole moments, and energies of molecule are examples of quantum chemical descriptors used in QSAR studies. Also, Dragon software was used to calculate some topology and geometry descriptors such as GETAWAY (GEometry, Topological, Atoms-Weighted AssemblY) and WHIM (Weighted Holistic Invariant Molecular descriptors). In this study, the MLR, PLS and LS-SVM methods were applied in QSAR for modeling the relationship between the mobility of 26 benzoaromatic carboxylates. Ab initio geometry optimization was performed at the B3LYP level, with a known basis set, 6-31++G**. Local charges, electrostatic potential, dipole moment, polarizability, HOMO-LUMO energies, hardness, softness, electronegativity and electrophilicity were calculated for each compound and WHIM and GETAWAY descriptors were calculated by Dragon software.
Theory
Theory of LS-SVM has also been described clearly by Suykens and Vandewalle11 and application of LS-SVM in quantification15,16 and QSAR17 reported by some of the workers. So, we will only briefly describe the theory of LS-SVM. The LS-SVM is capable of dealing with linear and nonlinear multivariate calibration and resolves multivariate calibration problems in a relatively fast way. In LS-SVM a linear estimation is done in kernel-induced feature space . As in SVM, it is necessary to minimize a cost function containing a penalized regression error, as follow:
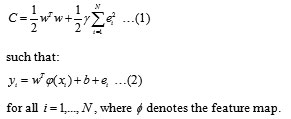
The first part of this cost function is a weight decay which is used to regularize weight sizes and penalize large weights. Due to this regularization, the weights converge to similar value. Large weights deteriorate the generalization ability of the LS-SVM because they can cause excessive variance. The second part of Eq. (1) is the regression error for all training data. The parameter g, which has to be optimized by the user, gives the relative weight of this part as compared to the first part. The restriction supplied by Eq. (2) gives the definition of the regression error. Analyzing Eq. (1) and its restriction given by Eq. (2), it is possible to conclude that we have a typical problem of convex optimization which can be solved by using the Lagrange multipliers method as follow:
![]()
To obtain the optimum solution, one sets all corresponding partial first derivatives to zero; the weights obtained are linear combinations of the training data:
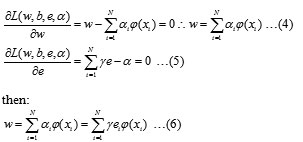
An important result of this approach is that the weights can be written as linear combinations of the Lagrange multipliers with the corresponding data training . Putting the result of Eq. (6) into the original regression line the following result is obtained:
The attainment of the kernel function is cumbersome and it will depend on each case. However, the kernel function more used is the radial basis function (RBF), a simple Gaussian function, and polynomial functions where is the width of the Gaussian function and is the polynomial degree, which should be optimized by the user, to obtain the support vector. For of the RBF kernel and of the polynomial kernel it should be stressed that it is very important to do a careful model selection of the tuning parameters, in combination with the regularization constant , in order to achieve a good generalization model.
Materials and Computational Methods
Hardware and software
All calculations were run on a Pentium IV personal computer with windows XP operating system. ChemDraw Ultra version 9.0 (ChemOffice 2005) software was used to draw the molecular structures and optimization by the AM1. Descriptors were calculated utilizing Dragon software (Milano Chemometrics group, http://www.disat.unimib.it/chm/) and with MATLAB (version 6.5, Mathwork, Inc.). The PLS evaluations were carried out by using the PLS program from PLS-Toolbox Version 2.0 for use with MATLAB from Eigenvector Research Inc. The LS-SVM optimization and model results were obtained using the LS-SVM lab toolbox.
These descriptors are calculated using two-dimensional representation of the molecules and therefore geometry optimization is not essential for calculating these types of descriptors. Gaussian 98 was operated to optimize with the 6-31++G** basis set for all atoms at the B3LYP level. No molecular symmetry constraint was applied; instead, full optimization of all bond lengths and angles was carried out at the B3LYP/6-31++G** level. Local charges (LC) and electrostatic potential (EP) at each atom, highest occupied molecular orbital (HOMO) and lowest unoccupied molecular orbital (LUMO) energies, molecular polarizabilities (MP) and molecular dipole moment (MDP) were calculated by Gaussian 98. Quantum chemical indices of hardness (h), softness (S), electronegativity (c), chemical potential (m) and electrophilicity (w) were calculated according to the method proposed by Thanikaivelan et al.19
Data set
The mobilities of benzoaromatic carboxylate derivatives were measured by Sarmini and Kenndler.1 In Table 1 the actual mobilities of the 26 benzoaromatic carboxylates are given. The structures of benzoaromatic carboxylates and their corresponding mobilities are listed in Table 1. In order to guarantee that training and prediction sets cover the total space occupied by the original data set, the set was divided into the parts of training and prediction set according to the Kennard-Stones algorithm.20,21 The Kennard-Stones algorithm is known as one of the best ways of building training and prediction sets and it has been used in many QSAR/QSPR studies.
Table 1: The structures and actual mobilities of benzoaromatic carboxylates in aqueous medium measures by capillary zone electrophoresis.
|
No. |
Substituent, R |
Mobility (m) |
No. |
Substituent, R |
Mobility (m) |
|
1t |
Benzoic |
33.27 |
14t |
2,-diMe |
29.21 |
|
2t |
2-OH |
36.29 |
15t |
2,5-diMe |
29.36 |
|
3t |
3-OH |
36.17 |
16t |
3,4-diMe |
29.38 |
|
4p |
4-OH |
31.08 |
17t |
3,5-diMe |
28.94 |
|
5t |
2,3-diOH |
32.62 |
18p |
2-NO2 |
32.78 |
|
6t |
2,4-diOH |
32.53 |
19t |
3-NO2 |
32.27 |
|
7t |
3,4-diOH |
29.68 |
20t |
4-NO2 |
32.65 |
|
8t |
3,5-diOH |
28.97 |
21t |
3,4-diNO2 |
31.03 |
|
9p |
2,4,6-triOH |
34.00 |
22t |
3,5-diNO2 |
30.63 |
|
10t |
3,4,5-triOH |
27.69 |
23t |
2,4,6-triNO2 |
28.42 |
|
11t |
2-Me |
31.59 |
24p |
2-Cl |
32.34 |
|
12t |
3-Me |
31.53 |
25t |
3-Cl |
32.63 |
|
13p |
4-Me |
31.51 |
26t |
4-Cl |
32.25 |
t training set, p prediction set
Results and Discussion
Principal component analysis of the data set
In order to detect the homogeneities in the data set and identify possible outliers and clusters, PCA was performed within the calculated structure descriptors space for the whole data set. PCA is a useful multivariate statistical technique in which new variables (called principal components, PCs) are calculated as linear combinations of the old ones. These PCs are sorted by decreasing information content (i.e. decreasing variance) so that most of the information is preserved in the first few PCs. An important feature is that the obtained PCs are uncorrelated, and they can be used to derive scores which can be used to display most of the original variations in a smaller number of dimensions. These scores can also allow us to recognize groups of samples with similar behavior. The detailed description of the PCA can be found in.
 |
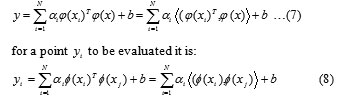
Figure 2: Principal components analysis of the structural descriptors for the data set. Click here to View figure |
Here, PCA gives five significant PCs (eigenvalues > 1), which explains 88.94% of the variation in the data (46.25%, 23.17%, 11.06%, 6.33% and 2.13%, respectively). Fig. 1 shows the distribution of compounds over the two first components. As can be seen from Fig. 1, there is not a clear clustering between compounds. The data separation is very important in the development of reliable and robust QSAR models. The quality of the prediction depends on the data set used to develop the model. The mobility of 26 specified benzoaromatic carboxylates were classified into a training set (21 mobility data) and a prediction set (5 mobility data) according to Kennard-Stones algorithms. As shown in Fig. 1, the distribution of the compounds in each subset seems to be relatively well-balanced over the space of the principal components. The data were centered to zero means and scaled to the unit variance. The data set of 26 benzoaromatic carboxylates includes recent data on mobility1 as summarized in Table 1. The calculated descriptors for each molecule are summarized in Table 2.
Table 2: The calculated quantum chemical descriptors used in this study.
|
Descriptor name |
Notation |
Description |
|
Local charges |
LCi |
The local charges at each atom of the base unit |
|
Electrostatic potential |
EPi |
The electrostatic potential at each atom of the base unit |
|
Molecular polarizability |
MP |
Total molecular polarizability |
|
Dipole moment |
DM |
Total molecular dipole moment |
|
HOMO |
EHOMO |
Highest occupied molecular orbital energy |
|
LUMO |
ELUMO |
Lowest unoccupied molecular orbital energy |
|
Electronegativity |
-0.5 (EHOMO -ELUMO) |
|
|
Hardness |
0.5 (EHOMO +ELUMO) |
|
|
Softness |
S |
|
|
Electrophilicity |
||
|
GETAWAY |
GEometry, Topological, Atoms-Weighted AssemblY |
|
|
WHIM |
Weighted Holistic Invariant Molecular descriptors |
For the evaluation of the predictive ability of a different model, the root mean square error of prediction (RMSEP) and relative standard error of prediction (RSEP) can be used:
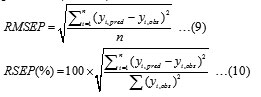
where is the predicted mobility using different model, is the observed value of the mobility and is the number of samples in the prediction set.
Multiple linear regression analysis
Among the descriptors calculated, the most significant molecular descriptors were identified using multiple linear regression analysis with a stepwise forward selection method. The best equation obtained for the mobility of the benzoaromatic carboxylates derivatives was:
Mobility = 32.35 + 0.36 RTp + 0.98 R1u + 0.46 P2e + 0.78 G2s + 0.11 Dm + 6.35 S + 0.39
where RTp, R1u, P2e, G2s and Dm are GETAWAU and WHIM descriptor and S, are softness and electrophilicity, respectively. In this model, the highly correlated descriptors were not considered. As seen, the resulting model has eleven significant descriptors (correlation coefficient > 0.5). Table 3 shows the descriptors coefficients, the standard error of coefficients, the t values for null hypothesis, and their related P values.
Table 3: Statistical results of multiple linear regression analysis.
|
Descriptor |
Coefficient |
S.E.* of coefficient |
t value |
P value |
|
Intercept |
32.35 |
2.12 |
6.66 |
0.076 |
|
RTp |
0.36 |
0.06 |
5.23 |
0.062 |
|
R1u |
0.98 |
0.04 |
2.56 |
0.064 |
|
P2e |
0.46 |
0.03 |
3.06 |
0.046 |
|
G2s |
0.78 |
0.04 |
2.15 |
0.063 |
|
Dm |
0.11 |
0.01 |
1.06 |
0.078 |
|
S |
6.35 |
0.21 |
1.12 |
0.092 |
|
0.39 |
0.07 |
0.13 |
0.071 |
* Standard error
Partial least squares analysis
The factor-analytical multivariate calibration method is a powerful tool for modeling, because it extracts more information from the data and allows building more robust models.22,23 According to mobility data (Table 1), data classified to training and prediction sets according to Kennard-Stones algorithm. The optimum number of factors to be included in the calibration model was determined by computing the prediction error sum of squares (PRESS) fro cross-validated models using a high number of factors (half of the number of total training set + 1). The cross-validation method employed was to eliminate only one compound at a time and then PLS calibrated the remaining of training set. The retention time of the left-out sample was predicted by using this calibration. This process was repeated until each compound in the training set had been left out once. According to Haaland suggestion,24 the optimum number of factor was selected. In Fig. 2, the PRESS obtained by optimizing the training set of the descriptor data with PLS model is shown. Table 4 shows the optimum number of factor and PRESS value.
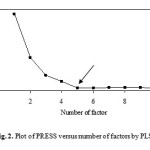 |
Figure 3: Plot of PRESS versus number of factors by PLS model. Click here to View figure |
Least squares – support vector machine analysis
The all descriptors were used as the input to develop nonlinear model by LS-SVM. The quality of LS-SVM for regression depend on g and s2 parameters. In this work, LS-SVM was performed with radial basis function (RBF) as a kernel function. To determine the optimal parameters, a grid search was performed based on leave-one-out cross-validation on the original training set fro all parameter combinations of g and s2 from 1 to 100, with increment steps of 1. Table 4 shows the optimum g and s2 parameters for the LS-SVM and RBF kernel, using the calibration sets for 21 mobility data.
Prediction of mobility of benzoaromatic carboxylates
The predictive ability of these methods (MLR, PLS and LS-SVM) were determined using 5 mobility data (their structure are given in Table 1). The results obtained by MLR, PLS and LS-SVM methods are listed in Table 4 and 5. Table 4 also shows RMSEP, RSEP and the percentage error for prediction of mobility of benzoaromatic carboxylates. As can be seen, the percentage error was also quite acceptable only for LS-SVM. Good results were achieved in LS-SVM model with percentage error ranges from -0.06 to 0.09 for mobility of benzoaromatic carboxylates. Also, it is possible to see that LS-SVM presents excellent prediction abilities when compared with other regression.
Table 4: Actual and predicted values of mobility for benzoaromatic carboxylates using MLR, PLS and LS-SVM models.
|
Substituent, R |
Actual (m) |
MLR |
Error (%) |
PLS |
Error (%) |
LS-SVM |
Error (%) |
|
4-OH |
31.08 |
29.66 |
-4.57 |
30.26 |
-2.64 |
31.07 |
-0.03 |
|
2,4,6-triOH |
34.00 |
31.03 |
-8.74 |
31.36 |
-7.76 |
34.03 |
0.09 |
|
4-Me |
31.51 |
28.66 |
-9.04 |
29.68 |
-5.81 |
31.49 |
-0.06 |
|
2-NO2 |
32.78 |
26.89 |
-17.97 |
30.89 |
-5.77 |
32.79 |
0.03 |
|
2-Cl |
32.34 |
28.33 |
-12.40 |
30.32 |
-6.25 |
32.33 |
-0.03 |
|
NPC* |
5 |
||||||
|
PRESS |
0.061 |
||||||
|
g |
10 |
||||||
|
s2 |
20 |
||||||
|
RMSEP |
3.734 |
1.931 |
0.018 |
||||
|
RSEP (%) |
11.541 |
5.967 |
0.055 |
According to the results, quantum chemical descriptors with WHIM-GETAWAY are suitable descriptors for describing the mobility of benzoaromatic carboxylate derivatives. When LS-SVM method with all descriptors is used, prediction of mobility in test step, with a small error is possible, which is improved in comparison with other methods (MLR and PLS). Which shows that by using all chemical quantum, WHIM and GETAWAY descriptors and also LS-SVM method, the mobility of benzoaromatic carboxylate derivatives are predicted with satisfactory results.
Table 5: Comparison of the statistical parameters by different QSPR models.
|
Methods |
Data set |
R2 |
Q2* |
|
MLR
|
Training Test |
0.9223 0.9110 |
|
|
PLS
|
Training Test |
0.9409 0.9365 |
0.8323 0.8267 |
|
LS-SVM
|
Training Test |
0.9991 0.9989 |
0.9561 0.9413 |
*Q2 coefficient for the model validation by leave-one-out
Conclusion
LS-SVM was established to predict the mobility of some benzoaromatic carboxylates. A suitable model with high statistical quality and low prediction errors was obtained. The model can accurately predict mobility of benzoaromatic carboxylate that do not exist in the modeling procedure. The quantum chemical, WHIM and GETAWAY descriptors concerning all the molecular properties and those of individual atoms in the molecule were found to be important factors controlling the mobility behavior. In this study, the results obtained by LS-SVM, are compared with results obtained by MLR and PLS. The results show that, LS-SVM is more powerful in prediction of mobility of benzoaromatic carboxylates than MLR and PLS.
References
- K. Sarmini, E. Kenndler, J. Chromatogr. A, 818: 209 (1998).
- E. Kenndler, J. Cap. Electrophoresis, 3: 191 (1996).
- E. Kenndler, J. Microcol. Sep., 10: 273 (1998).
- A. Niazi, S. Jameh-Bozorghi, D. Nori-Shargh, Turk. J. Chem., 30: 619 (2006).
- M. Kompany-Zareh, Acta Chim. Slov., 50: 259 (2003).
- B. Narasimhan, V. Judge, R. Narang, R. Ohlan, S. Ohlan, Bioorg. Med. Chem. Lett., 17: 5836 (2007).
- A. Niazi, R. Leardi, J. Chemometr., 26: 345 (2012).
- B. Hemmateenejad, M.A. Safarpour, F. Taghavi, J. Mol. Struc. (TheoChem), 635: 183 (2003).
- A.I. Belousov, S.A. Verzakov, J. Von Frese, J. Chemometr. Intell. Syst., 64: 15 (2002).
- R. Burbidge, M. Trotter, B. Buxton, S. Holden, Comput. Chem., 26: 5 (2001).
- J.A.K. Suykens, J. Vandewalle, Neural Process. Lett., 9: 293 (1999).
- S. Durdagi, T. Mavromoustakos, M.G. Papadopoulos, Bioorg. Med. Chem. Lett., 18: 6283 (2008).
- O. Isayev, B. Rasulev, L. Gorb, J. Leszczynski, Mol. Diversity, 10: 233 (2006).
- C. Hansch, R.P. Verma, A. Kurup, S.B. Mekapati, Bioorg. Med. Chem. Lett., 15: 2149 (2005).
- A. Niazi, J. Ghasemi, M. Zendehdel, Talanta, 74: 247 (2007).
- A. Borin, M.F. Ferrao, C. Mello, D.A. Maretto, R.J. Poppi, Anal. Chim. Acta, 579: 25 (2006).
- A. Niazi, S. Jameh-Bozorghi, D. Nori-Shargh, J. Hazard. Mater., 151: 603 (2008).
- J. Mercer, Philos. Trans. R. Soc. London, Ser. A, 209: 415 (1909).
- P. Thanikaivelan, V. Subramanian, J.R. Rao, B.U. Nair, Chem. Phys. Lett., 323: 59 (2000)..
- R.W. Kennard, L.A. Stones, Technometrics, 11: 137 (1969).
- M. Daszykowski, B. Walczak, D.L. Massart, Anal. Chim. Acta, 468: 91 (2002).
- A. Niazi, A. Azizi, M. Ramezani, Spectrochim. Acta Part A, 71: 1172 (2008).
- A. Niazi, S. Sharifi, E. Amjadi, J. Electroanal. Chem., 623: 86 (2008).
- D.M. Haaland, E.V. Thomas, Anal. Chem., 60: 1193 (1988).

This work is licensed under a Creative Commons Attribution 4.0 International License.
![]()
A New Edition of Web of Science
Journal Impact Factor
2022: 0.5
Five Year: 0.8
Journal is Indexed in

Cabells Whitelist
![]()


