Quantum Chemical Computation on Molecular Structure, Vibrational Spectra, Hirschfield Surface, HOMO–LUMO and MEP Analysis of Biologically Active Benzyl Hydrazinecarbodithioate
Rajeev Singh1* , Prashant Shrivastava2 and Mahendra Singh Bhadauriya3
1Department of Chemistry, Institute of Technology and Management, Gwalior, MP 474001, India.
2Department of Chemical Engineering, Institute of Technology and Management, Gwalior, MP 474001, India.
3Department of Mathematics, Institute of Technology and Management, Gwalior, MP 474001, India.
Corresponding Author E-mail: rajeev.singh@itmgoi.in
DOI : http://dx.doi.org/10.13005/ojc/400230
Article Received on : 25 Dec 2023
Article Accepted on :
Article Published : 06 Mar 2024
Reviewed by: Dr. Lahoucine BAHMAD
Second Review by: Dr. N. Raman
Final Approval by: Dr. MGH Zaidi
In this study benzyl hydrazinecarbodithioate (BHDTC) has been subjected to computational calculations. Density functional theory (DFT) , Hartree fock (HF) methods with split-valence triple-zeta 6-311G(3df,3pd) Pople style basis sets and semi-empirical methods, Modified neglect of diatomic overlap (MNDO), Parametric method 3 (PM3), Austin model 1 (AM1), Recife model 1 (RM1), Parametric method 6 (PM6) and Parametric method 7 (PM7) were utilized to investigate various properties of BHDTC like, structural parameters, electronegativity (χ), hardness (η), softness (S), HOMO, (LUMO), Ionization potential (I), Hirshfeld surface and molecular electrostatic potential (MEP) analysis. DFT/Becke, 3-parameter, Lee–Yang–Parr (B3LYP) approach was also utilized to get theoretical infrared frequencies. The experimental and theoretical structural parameters and IR frequencies were compared methodically, demonstrating a significant degree of consistency between the experimental and theoretical results.
KEYWORDS:Benzyl hydrazinecarbodithioate; Density Functional Theory; Hirshfeld surfaces analysis; Molecular structure
Download this article as:| Copy the following to cite this article: Singh R, Shrivastava P, Bhadauriya M. S. Quantum Chemical Computation on Molecular Structure, Vibrational Spectra, Hirschfield Surface, HOMO–LUMO and MEP Analysis of Biologically Active Benzyl Hydrazinecarbodithioate. Orient J Chem 2024;40(2). |
| Copy the following to cite this URL: Singh R, Shrivastava P, Bhadauriya M. S. Quantum Chemical Computation on Molecular Structure, Vibrational Spectra, Hirschfield Surface, HOMO–LUMO and MEP Analysis of Biologically Active Benzyl Hydrazinecarbodithioate. Orient J Chem 2024;40(2). Available from: https://bit.ly/49EYw60 |
Introduction
Dithiocarbazic acid and its derivatives have been synthesized, investigated and extensive biological studies of these compounds were evaluated by the researchers1-11. The biological properties of such compounds can be modified thorough some substituents in the side chain12,13. Apart from the biological and pharmacological studies, these compounds are needed to be investigated on theoretical basis for structure and reactivity aspect so their full potential could be harnessed further in the field of bioinformatics, chemo-informatics, and computer-aided drug designing. In the present study we report herein a theoretical study to characterize the BHDTC by DFT/B3LYP, HF and semi-empirical quantum chemical methods. The optimized geometry and theoretically calculated vibrational data of BHDTC have been compared with the experimental data.
Material and Method
All reagents, sourced from Sigma-Aldrich and Merck Chemicals (India), were directly employed in synthesis without additional purification. FT IR spectrum of Benzyl hydrazinecarbodithioate (BHDTC) was recorded by FT IR Perkin-Elmer RX I spectrometer using KBr pellet. Benzyl hydrazinecarbodithioate (BHDTC) was synthesized as described in literature14 (Scheme 1). A high-performance Intel Core i 7 quad-core 2.4 gigahertz THE FUJITSU machine with 16 GB of RAM and a 7200 RPM HDD was used to carry out the computational tasks. Semi-empirical calculations were conducted utilizing the MOPAC2012 program15,16. The ORCA computational chemistry package17 version 3.0.3 was used to perform the DFT and HF calculations with a 6-311G(3df,3pd) basis set. Parallel processing across eight cores on a Debian 8.0 LINUX operating system was used to get the most out of the machine’s computational power. Parallel administration of ORCA was facilitated by the Open MPI message passing interface library version 1.6.2. The molecular design and visualization application Avogadro version 1.0.3 was used in sketching the molecule18 and initial optimization was accomplished through the molecular mechanics method.
The generation of input files was facilitated through the utilization of the Gabedit graphical user interface19 version 2.4.8. Molecular geometry optimization was initially conducted employing the MMFF94 molecular force field20 with the conjugate gradient algorithm, ensuring convergence at a level of 10e-7. Subsequent geometry optimization involved HF, DFT methods at the 6-311G(3df,3pd) basis set level21-25, and semi-empirical methods using the MOPAC 2012 program. Computational calculations of the IR spectrum was carried out through DFT methods using the same basis set level.
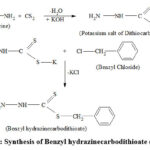 |
Scheme 1: Synthesis of Benzyl hydrazinecarbodithioate (BHDTC). |
Reseult and Discussion
Optimized Structure
Density functional theory (DFT), HF, MNDO, PM3, AM1, RM1, PM6 and PM7 have been employed for quantum chemical computations on Benzyl hydrazinecarbodithioate (BHDTC) molecule. Becke-3-Lee-Yang-Parr (B3LYP) exchange-correlation functionals with 6-311G(3df,3pd) basis sets have been used to optimized the ground state without any symmetry constraints. The optimized structure of BHDTC is shown in Fig. 1 and the optimized structural parameters such as bond lengths and bond angles are summarized in Table 1 and Table 2 respectively. In accordance with literature findings14 the experimental parameters fall under the monoclinic crystal structure, p21/c space group, having unit cell dimensions of a = 19.7221 (9) Å, b = 4.8605 (2) Å, and c = 10.2699 (5) Å. The calculated bond order value for C12-C6 bond is found to be lowest. The highest value of bond order is obtained for the C16-S17 bond indicating its double bond character. The experimental bond length value of C16-S17 has been reported as 1.678 Å while the theoretical values of this bond length are found to be 1.652 Å, 1.656 Å, 1.571 Å, 1.634 Å, 1.592 Å, 1.613 Å, 1.658 Å and 1.660 Å by HF, DFT, MNDO, PM3, AM1, RM1, PM6 and PM7 methods respectively.
The β-nitrogen (-N-H) and the thione sulfur (-C=S) are showed trans configuration due to the N18-C16 bond. The experimentally observed value of bond length revealed that the C16-N18 bond is found to be existed as single bond in the molecule which also shows a good agreement with the theoretically calculated value (Table 1).
 |
Figure 1: Optimized geometry of BHDTC using DFT/B3LYP 6-311G(3df,3pd) basis set. |
Table 1: Calculated and experimental bond lengths and bond orders of benzyl hydrazinecarbodithioate (BHDTC)
|
Parameter |
Exp14. Bond Length (Å)
|
Calculations by ORCA |
Calculations by MOPAC |
||||||||
|
HF |
DFT |
MNDO |
PM3 |
AM1 |
RM1 |
PM6 |
PM7 |
||||
|
Bond Length (Å) |
Bond Order |
Bond Length (Å) |
Bond Order |
Bond Length (Å) |
Bond Length ( (Å) |
Bond Length (Å) |
Bond Length (Å) |
Bond Length (Å) |
Bond Length (Å) |
||
|
N18-N19 |
1.406 |
1.383 |
0.74 |
1.400 |
0.84 |
1.380 |
1.430 |
1.356 |
1.395 |
1.419 |
1.412 |
|
N18-C16 |
1.320 |
1.326 |
0.99 |
1.349 |
1.10 |
1.408 |
1.383 |
1.376 |
1.360 |
1.354 |
1.348 |
|
C16-S17 |
1.678 |
1.652 |
1.86 |
1.656 |
1.81 |
1.571 |
1.634 |
1.592 |
1.613 |
1.658 |
1.660 |
|
C16-S13 |
1.753 |
1.760 |
1.07 |
1.778 |
1.09 |
1.694 |
1.782 |
1.729 |
1.757 |
1.765 |
1.795 |
|
S13-C12 |
1.816 |
1.819 |
1.27 |
1.835 |
1.23 |
1.746 |
1.840 |
1.782 |
1.833 |
1.823 |
1.838 |
|
C12-C6 |
1.514 |
1.508 |
0.15 |
1.504 |
0.47 |
1.507 |
1.486 |
1.477 |
1.481 |
1.492 |
1.489 |
|
C6-C7 |
1.384 |
1.385 |
1.15 |
1.395 |
0.95 |
1.416 |
1.397 |
1.401 |
1.394 |
1.404 |
1.398 |
|
C7-C2 |
1.388 |
1.381 |
1.07 |
1.389 |
1.10 |
1.406 |
1.390 |
1.393 |
1.389 |
1.397 |
1.393 |
|
C2-C1 |
1.348 |
1.381 |
1.06 |
1.390 |
1.05 |
1.405 |
1.391 |
1.395 |
1.390 |
1.398 |
1.394 |
|
C1-C3 |
1.359 |
1.381 |
1.06 |
1.390 |
1.02 |
1.406 |
1.391 |
1.395 |
1.390 |
1.399 |
1.394 |
|
C3-C5 |
1.396 |
1.381 |
1.07 |
1.389 |
1.01 |
1.405 |
1.390 |
1.393 |
1.389 |
1.397 |
1.393 |
|
C5-C6 |
1.366 |
1.385 |
1.15 |
1.396 |
1.00 |
1.416 |
1.397 |
1.401 |
1.394 |
1.404 |
1.398 |
Table 2: Calculated and experimental bond angles of the benzyl hydrazinecarbodithioate (BHDTC)
|
Bond angle designation |
Exp14. bond angles (0) |
Bond angle calculated by ORCA (0) |
Bond angle calculated by MOPAC (0) |
||||||
|
|
|
HF |
DFT |
MNDO |
PM3 |
AM1 |
RM1 |
PM6 |
PM7 |
|
N19-N18-C16 |
120.99 |
125.23 |
125.03 |
123.47 |
124.99 |
125.77 |
124.79 |
123.21 |
124.07 |
|
N18-C16-S13 |
113.51 |
110.85 |
110.52 |
110.96 |
111.41 |
112.85 |
112.67 |
113.98 |
111.94 |
|
N18-C16-S17 |
121.15 |
123.90 |
123.71 |
122.61 |
123.46 |
123.39 |
123.08 |
120.85 |
122.89 |
|
S13-C12-C6 |
106.05 |
108.29 |
108.57 |
109.11 |
108.52 |
106.54 |
106.10 |
104.00 |
104.64 |
|
C6-C7-C2 |
119.86 |
120.65 |
120.67 |
120.86 |
120.03 |
120.19 |
119.92 |
120.01 |
120.00 |
|
C7-C2-C1 |
120.91 |
120.06 |
120.05 |
120.21 |
120.17 |
120.15 |
120.14 |
120.20 |
120.12 |
|
C2-C1-C3 |
119.46 |
119.73 |
119.76 |
119.61 |
119.95 |
119.90 |
119.97 |
119.90 |
119.95 |
|
C1-C3-C5 |
120.72 |
120.06 |
120.08 |
120.22 |
120.17 |
120.16 |
120.14 |
120.21 |
120.13 |
|
C3-C5-C6 |
120.36 |
120.65 |
120.64 |
120.85 |
120.03 |
120.19 |
119.91 |
120.00 |
119.98 |
|
C5-C6-C7 |
118.66 |
118.85 |
118.80 |
118.26 |
119.64 |
119.41 |
119.92 |
119.67 |
119.82 |
|
S17-C16-S13 |
125.34 |
125.26 |
125.77 |
126.29 |
125.14 |
123.76 |
124.25 |
125.17 |
125.17 |
|
C16-S13-C12 |
103.37 |
104.57 |
103.20 |
109.10 |
104.25 |
102.64 |
102.29 |
103.21 |
104.97 |
|
C12-C6-C7 |
120.06 |
120.58 |
120.60 |
120.82 |
120.18 |
120.29 |
120.04 |
120.15 |
120.08 |
|
C5-C6-C12 |
121.27 |
120.58 |
120.60 |
120.92 |
120.15 |
120.28 |
120.03 |
120.17 |
120.10 |
We examined the performance of HF, DFT, MNDO, PM3, AM1, RM1, PM6 and PM7 methods in reproducing geometrical parameters. The analysis of the computation of root mean square deviation (RMSD), average relative error (ARE), and the regression coefficient (r2) has been done and the results obtained by various computational methods of these metrics are presented in Table 3. The regression coefficients (r2) of bond lengths obtained for HF, DFT, MNDO, PM3, AM1, RM1, PM6, PM7 methods are 0.9896, 0.9863, 0.9912, 0.9706, 0.9537, 0.9697, 0.9862, 0.9824 respectively. These results are showing good correlation between experimentally observed and theoretically calculated values. The MNDO method produces a marginally better regression coefficient value (r2 = 0.9912) with a deviation of error of 0.9566 % ARE. The simple linear regression analysis plot for the bond lengths and bond angles with HF and DFT methods are depicted in Fig.2 (a) and Fig. 2 (b) respectively.In the case of bond angles the regression coefficients obtained for HF, DFT, MNDO, PM3, AM1, RM1, PM6, and PM7 methods are 0.9256, 0.9297, 0.9043, 0.9331, 0.9400, 0.9559, 0.9788 and 0.9562 respectively. The PM6 method produces a better regression coefficient value (r2 = 0.9788) than the other theoretical methods.
A notable disparity between computed and experimental values of bond angles has been observed. It is due to the fact that theoretical calculations have been performed in the gaseous phase in which there is lacking intermolecular interactions whereas experimental result have been obtained from solid state having various intermolecular interactions. Despite these differences, theoretically computed geometric parameters provide a reasonable approximation and can serve as a foundation for investigating some other parameters, such as IR frequencies and global reactivity descriptors of molecules.
Table 3: RMSD, ARE and regression coefficient (r2) for bond lengths and bond angles for different theoretical methods.
|
Bond Lengths |
HF |
DFT |
MNDO |
PM3 |
AM1 |
RM1 |
PM6 |
PM7 |
|
RMSD (Ǻ) |
0.0179 |
0.0238 |
0.0585 |
0.0340 |
0.0439 |
0.0316 |
0.0277 |
0.0280 |
|
ARE (%) |
0.9758 |
1.3357 |
0.9566 |
1.9379 |
2.4259 |
1.6477 |
1.5679 |
1.5664 |
|
r2 |
0.9896 |
0.9863 |
0.9912 |
0.9706 |
0.9537 |
0.9697 |
0.9862 |
0.9824 |
|
Bond Angles |
|
|
|
|
|
|
|
|
|
RMSD (0) |
1.7932 |
1.7783 |
2.1617 |
1.6668 |
1.6264 |
1.4074 |
0.9940 |
1.3487 |
|
ARE (%) |
1.0709 |
1.0351 |
1.3076 |
1.0104 |
0.8805 |
0.8218 |
0.5968 |
0.8801 |
|
r2 |
0.9256 |
0.9297 |
0.9043 |
0.9331 |
0.9400 |
0.9559 |
0.9788 |
0.9562 |
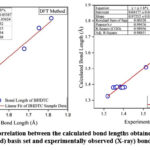 |
Figure 2: (a). Graphical correlation between the calculated bond lengths obtained by HF and DFT methods using 6-311G(3df,3pd) basis set and experimentally observed (X-ray) bond lengths for BHDTC. |
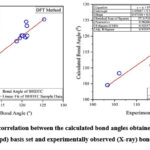 |
Figure 2: (b). Graphical correlation between the calculated bond angles obtained by HF and DFT methods using 6-311G(3df,3pd) basis set and experimentally observed (X-ray) bond angles for BHDTC. |
FT-IR analysis
The theoretical investigation of vibrational frequencies was done through DFT/B3LYP using 6-311G(3df,3pd) basis set. The vibrational assignments for the BHDTC are given in Table 4. Experimentally observed IR spectrum of BHDTC is represented in Fig. 3. Benzyl hydrazinecarbodithioate (BHDTC) exhibits characteristic bands at 3304 cm-1 and 3183 cm-1 attributed to –NH2 and the thione group [-NH-C(=S)] respectively. The theoretical counterparts for these bands were calculated at 3597 cm-1 and 3461 cm-1 respectively. Additionally, a characteristic azomethine group ν(C=N) band was experimentally observed at 1610 cm-1, while the theoretical calculation yielded a value of 1670 cm-1. Another band at 1048 cm-1 associated with symmetric stretching of ν(C=S)26-29 was theoretically predicted at 1097 cm-1. A simple linear regression analysis plot for DFT method is shown in Fig.4 which shows a good correlation (r2=0.999) between experimentally observed and theoretically obtained vibrational frequencies.
Table 4: Selected vibration frequencies of BHDTC observed experimentally and computed by DFT/B3LYP methods using 6-311G(3df,3pd) basis set.
|
Experimental Wave no. in cm-1 |
Theoretical Wave no. in cm-1 |
Vibrational frequency Assignments |
|
3304.13 |
3597.27 |
ν N-H2 vibration |
|
3182.80 |
3410.48 |
ν N-H vibration |
|
1610.09 |
1670.28 |
ν(C=N) vibrations coupled with N-H in-plane vibrations |
|
1476.14
|
1478.21 |
Aromatic stretching vibrations and thioureide C=N stretching vibrations |
|
1347.52 |
1394.25 |
C-N stretching vibrations |
|
1229.55 |
1307.58 |
N-H out of plane vibrations |
|
1192.50 |
1296.57 |
Aromatic in plane C-H bending |
|
1048.01 |
1097.65 |
C=S stretching vibrations |
|
951.89 |
1047.29 |
N-C-S stretching vibrations |
|
777.08 |
1043.86 |
Aromatic out of plane C-H bending |
|
712.45 |
719.24 |
Out of plane ring deformation mode |
|
r2 |
0.996 |
|
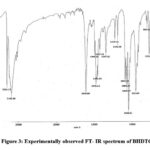 |
Figure 3: Experimentally observed FT- IR spectrum of BHDTC. |
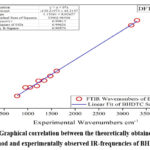 |
Figure 4: Graphical correlation between the theoretically obtained by DFT method and experimentally observed IR-frequencies of BHDTC |
Hirshfeld surface analysis of BHDTC
Hirshfeld surface analysis has been employed to investigate shape of the molecules in a crystalline environment. The mapped transparent Hirshfeld surfaces of BHDTC molecule in the crystal are shown in Fig. 5. The dnorm mapped Hirshfeld surfaces (1 and 2) reveal points of close contact, appearing as red spots. On the dnorm surfaces, circular dark red depressions indicate hydrogen bonding-like contacts, with a specific emphasis on the existence of C=S.……H close interactions. The most important of S.……H interaction is C=S.……H-N type. The shape index mapped Hirshfeld surface (6) do not exhibit any feature evidencing presence of CH…….π interaction. The resolved 2D finger print plot for BHDTC also do not show any distinct wings type feature. The HS plot do not show adjacent red and blue triangles, which makes it clear that the crystal structure of BHDTC does not exhibit any π…….π stacking interaction. The curved mapped on Hirshfeld surface (7) shows larger regions of low curvedness.
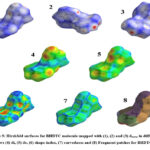 |
Figure 5: Hirshfeld surfaces for BHDTC molecule mapped with (1), (2) and (3) dnorm in different views (4) di, (5) de, (6) shape-index, (7) curvedness and (8) Fragment patches for BHDTC. |
The 2D fingerprint plots, depicted in Fig. 6, unveil the primary intermolecular interactions within the crystal structure of the BHDTC molecule. The major contributions come from H….H, H.……S/S…….H, and C…….H/H……..C interactions, accounting for 47.7%, 24.4%, and 20.5% of the relative contribution, respectively. Lower percentages are observed for the N……S/S……N (3.4%), H..….N/N……H (2.5%), C..….C (0.7%), C..….S/S…….C (0.5%), C..….N/N…….C (0.3%) and S……S (0.3%) contacts. Notably, a comparable proportion of S……H and H……S interactions is not evident in the 2D fingerprint plot analyses. The 2D fingerprint plot for S……H interactions displays a spiky shape at the bottom-left region, indicating S…….H interactions, while the spike at the right side of bottom region signifies H……S interactions. For H……H interactions, the resolved 2D fingerprint plot reveals the closest contact at de~di = 0.95 Å distance, forming a spearhead-shaped pattern indicative of a one-to-one close contact between H and H atoms. An unusually short head-to-head H……H contact is observed at a distance near 1.9 Å in the crystal of BHDTC. The S……H interaction 2D fingerprint plot shows two corresponding spikes, with the closest contact on the acceptor side at de = 0.86 Å and di = 1.52 Å distance. The resolved 2D fingerprint plot for C…….H interactions in BHDTC does not exhibit any distinct wing-type features, indicating the absence of significant π……π interactions in the crystal.
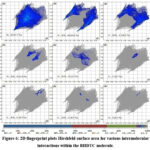 |
Figure 6: 2D fingerprint plots Hirshfeld surface area for various intermolecular interactions within the BHDTC molecule. |
Molecular electrostatic potential (MEP) surface
MEP surface serves as a representation of electronic density and proves to be a valuable descriptor for identifying sites susceptible to electrophilic attacks, nucleophilic reactions, and hydrogen-bonding interactions30-33. In this study, the MEP of BHDTC was computed through DFT calculations utilizing the optimized structure with the B3LYP/6-311G (3df,3pd) basis set. The 3D isosurface plot of the MEP for BHDTC is depicted in Fig. 7. In the MEP suface, red and blue colors denote the sites which are prone to electrophilic and nucleophilic attacks, respectively. The MEP surface reveals that negative potential regions are localized over nitrogen and sulfur atoms. Notably, the sulfur atoms in the compound exhibit lower electrophilic potential compared to the nitrogen atoms.
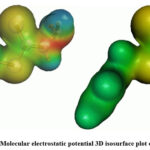 |
Figure 7: Molecular electrostatic potential 3D isosurface plot of BHDTC. |
Frontier molecular orbital (FMO) analysis of BHDTC
FMO analysis of a chemical species plays a crucial role in defining its reactivity34,35. A higher value of HOMO signifies a molecule’s tendency to donate electrons to a suitable acceptor molecule with a lower energy molecular orbital. The EHOMO, ELUMO, ionization potential (I), electron affinity (A), electronegativity (χ), chemical hardness (η), and chemical softness (s) of BHDTC were computed DFT and HF at the same basis set level as the optimized geometry and results are presented in Table 5. DFT and HF methods produced the values of ELUMO – EHOMO gap for the BHDTC molecule were 49391.42342 Btu/lb-mol and 115846.5 Btu/lb-mol respectively. These data based on the ELUMO – EHOMO gap suggest that BHDTC is a stable molecule, a finding further supported by the values of ionization potential obtained through computational study. The polarity in the SBDTC molecule is also indicated by the theoretically calculated values of the dipole moment.
Table 5: Calculated values of EHOMO-ELUMO, Hardness (η) and other related molecular properties of SBDTC.
|
Energies/Properties |
DFT |
HF |
|
ELUMO+1 (Btu/lb-mol) |
-7356.915648 |
30649.77 |
|
ELUMO (Btu/lb-mol) |
-10810.10671 |
26897.12 |
|
EHOMO (Btu/lb-mol) |
-60201.53014 |
-88949.3 |
|
EHOMO-1 (Btu/lb-mol) |
-64763.51927 |
-91185.8 |
|
ELUMO -EHOMO (Btu/lb-mol) |
49391.42342 |
115846.5 |
|
Energy gap ΔE1=ELUMO+1-EHOMO-1 (Btu/lb-mol) |
57406.60362 |
119599.1 |
|
Ionization potential (I)= -EHOMO (Btu/lb-mol) |
60201.53014 |
88949.35 |
|
Electron affinity (A)= -ELUMO (Btu/lb-mol) |
10810.10671 |
-26897.1 |
|
Electronegativity (χ)= (I+A)/2 |
35505.81842 |
31027.46 |
|
Hardness(η)= (I – A)/2 |
24695.71171 |
57924.58 |
|
Softness (s)= 1/2η |
1473565.654 |
628243.4 |
|
Total Energy (Eh) |
-328202057.3 |
-3.3×1008 |
|
Dipole moment (Debye) |
1.96510 |
2.33475 |
3D plots of the HOMO, LUMO for SBDTC computed by HF method are shown in Figure 8. The chemical species with a larger EHOMO-ELUMO gap are less reactive than those which are having smaller gap36. The blue and red regions indicate the +ve and -ve phases of wave function. The HOMO concentrates over S17 atom and the LUMO spreads from S17 atom to N18 atom. The HOMO over S17 atom mainly comprises of p orbital.
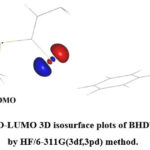 |
Figure 8: HOMO-LUMO 3D isosurface plots of BHDTC thione form by HF/6-311G(3df,3pd) method. |
Conclusion
The projected structure of BHDTC underwent geometry optimization, with structural parameters computed using HF, DFT theory at the B3LYP level of calculation with a 6-311G (3df,3pd) basis set and MNDO, PM3, AM1, RM1, PM6 & PM7 semi-empirical methods. Theoretical calculations are also applied for vibration frequencies, Hirshfeld surfaces analysis, EHOMO-ELUMO, molecular hardness, ionization energy, dipole moment, total energy, and MEP surface of Benzyl hydrazinecarbodithioate (BHDTC) molecule. Notably, all the theoretically obtained results demonstrated favorable linearity between experimental values for geometrical parameters. Among the methods, the MNDO method exhibited a slightly superior regression coefficient value (r2 = 0.9912) for bond lengths, while for bond angles, the PM7 method achieved a slightly better regression coefficient value (r2 = 0.9788). Discrepancies between the observed and the calculated infra-red frequencies are partly due to the fact that the optimized geometry is a cis-cis conformer while the experimental data reported is for cis-trans and trans-cis conformers. Additionally, the calculations were computed on a single molecule in the gaseous state, however experimental findings were recorded in the existence of intermolecular interactions. The MEP analysis of the studied compound revealed negative potential regions localized over nitrogen and sulfur atoms. The calculated EHOMO-ELUMO orbital were employed for semi-quantitative estimations of ionization energy, molecular hardness, and other molecular properties of SBDTC, proving valuable for investigating the biological activities of the studied compound.
Acknowlegement
This research was carried out with the financial support of the MPCST. Bhopal India.
Conflict of interest
The Authors have no conflicts of interest to disclose.
Reference
- Ali M. A.; Mirza A. H.; Butcher R. J.; Bernhardt P. V. Polyhedron 2011, 30, 1478–1486.
CrossRef - Li M. X.; Zhang L. Z.; Chen C. L.; Niu J. Y.; Ji B. S. J. Inorg. Biochem. 2012, 106, 117–125.
CrossRef - Ali M. A.; Mirza A. H.; Ting W. Y.; Hamid M. H. S. A.; Bernhardt P. V.; Butcher R. J. Polyhedron 2012, 48, 167–173.
CrossRef - Ali M. A.; Mirza A. H.; Mei C. C.; Bernhardt P. V.; Karim M. R. Polyhedron 2013, 49, 277–283.
CrossRef - Dani R. K.; Bharty M. K.; Kushawaha S. K.; Prakash O.; Sharma V. K.; Kharwar R. N.; Singh R. K.; Singh N. K. Polyhedron 2014, 81, 261–272.
CrossRef - Hamid M. H. S. A ; Said A. N. A. H.; Mirza A. H.; Karim M. R.; Arifuzzaman M.; Ali M. A.; Bernhardt P. V. Inorg. Chim. Acta. 2016, 453, 742–750.
CrossRef - Low M. L.; Maigre L.; Tahir M. I. M.; Teikink E. R. T.; Dorlet P.; Guillot R.; Ravoof T. B.; Rasoli R.; Pages J. M.; Policar C.; Delsuc N.; Crouse K. A. Eur. J. Med. Chem. 2016, 120, 1–12.
CrossRef - Rakshit S.; Palit D.; Hazari S. K. S.; Rabi S.; Roy T. G.; Olbrich F.; Rehder D. Polyhedron 2016, 117, 224–230.
CrossRef - Pavan F. R. Eur. J. Med. Chem. 2010, 45, 1898.
CrossRef - Ahmed Boshaalaa ; Bohari M. Yaminb; Younis O. Ben Amer a; Ghaith S.H. Ghaithc; Abdulla Ali Almughery d; Abdelkader Zarrouke ; Ismail Waradf J. Mole. Struct. 2021, 1224, 129207.
CrossRef - Hazari S. K. S.; Kopf J.; Palit D.; Rakshit S.; Rehder D. Inorg. Chim. Acta. 2009, 362, 1343.
CrossRef - Yazdanbakhsh M.; Takjoo R. Struct. Chem. 2008, 19, 895.
CrossRef - Nunez-Montenegro A.; Carballo R.; Vazquez-Lopez E. M. Polyhedron 2008, 27, 2867.
CrossRef - Shanmuga Sundara Raj S.; Yamin B.M.; Yussof Y.A.; Tarafder M.T.H.; Fun H.-K.; Grouse K.A. Acta Cryst. 2000, C56, 1236.
CrossRef - Stewart J.J.P. J. Comput. Mol. Des. 1990, 4, 1.
CrossRef - Stewart J.J.P. MOPAC2012, 2012. http://openmopac.net/.
- Neese F. WIREs Comput Mol Sci. 2012, 2, 73.
CrossRef - Hanwell M.D.; Curtis D.E.; Lonie D.C.; Vandermeersch T.; Zurek E.; Hutchison G.R. J. Cheminformatics 2012, 4, 1.
CrossRef - Allouche A.R. J. Comput. Chem. 2010, 32 174.
CrossRef - Halgren T.A. J. Comput. Chem. 1996, 17, 490.
CrossRef - McLean A.D.; Chandler G.S. J. Chem. Phys. 1980, 72, 5639.
CrossRef - Francl M.M.; Pietro W.J.; Hehre W.J.; Binkley J.S.; Gordon M.S.; DeFrees D.J.; Pople John A. J. Chem. Phys. 1982, 77, 3654.
CrossRef - Blaudeau J.P.; McGrath M.P.; Curtiss L.A., Radom L. J. Chem. Phys. 1997, 107, 5016.
CrossRef - Krishnan R.; Binkley J.S.; Seeger R.; Pople J.A. J. Chem. Phys. 1980, 72, 650.
CrossRef - Silverstein R.M.; Webster F.X. Spectrometric Identification of Organic Compounds, John Wiley & Sons, New York, NY, USA, 1997 6th ed.
- Islam A.; Sheikh C.; Mumit M.A.; Miyatake R.; Alam M.A.; Mondal M.O.A. J. Coord. Chem. 2016, 69, 3580.
CrossRef - Islam M.H.; Sheikh M.C., Islam M.A.A.A.A. J. Sci. Res. 2019, 11, 121.
CrossRef - Singh R.; Kumar D.; Goswami Y.C.; Sharma R. Arab. J. Chem. 2019, 12, 1537.
CrossRef - Okulik N.; Jubert A.H. J. Mol. Des. 2005, 4, 17.
- Scrocco E., Tomasi J. Advances in Quantum Chemistry 1978, Volume 11, Elsevier.
- Mendoza-Huizar L.H.; Rios-Reyes C.H. J. Mex. Chem. Soc. 2011, 55, 142.
- Singh B., Singh R., Singh B., Kumar D.; Kuwait J. Sci.2017, 44 (4), 98.
- Chetan Pratap K.N.; Niranjana S.V.; Lokanathan K. Oriental J. Chemistry, 2021, 37, 2, 8440.
- Pearson Proc. Natl. Acad. Sci. U. S. A. 1986, 83, 8440.
CrossRef - Kurtaran R.; Odabaşıoğlu S.; Azizoglu A.; Kara H.; Atakol O. Polyhedron2007, 26, 5069.
CrossRef

This work is licensed under a Creative Commons Attribution 4.0 International License.
About The Author
![]()
A New Edition of Web of Science
Journal Impact Factor
2022: 0.5
Five Year: 0.8
Journal is Indexed in

Cabells Whitelist
![]()


