Phytochemical Screening and In Vitro Cytotoxicity of Sphagnum sericeum against Human Acute Lymphoblastic Leukaemia Cell Lines
Elda Surhaida Latif1 , Normah Awang1*, Nur Rasyiqin Rasli1, Daphne Wong Qiao Xuan1, Noor Eszrezad Juferi2, Nik Norhazrina Nik Mohd Kamil3, Asmah Hamid1
1Center for Toxicology and Health Risk Studies (CORE), Faculty of Health Sciences, Universiti Kebangsaan Malaysia, Jalan Raja Muda Abdul Aziz, 50300 Kuala Lumpur, Malaysia.
2Institute of Medical Science Technology (MESTECH), Universiti Kuala Lumpur, Taman Kajang Sentral, 43000 Kajang, Selangor, Malaysia.
3Moss Herbarium (UKMB), School of Environmental and Natural Resource Sciences, Faculty of Science and Technology, Universiti Kebangsaan Malaysia, 43600 Bangi, Selangor.
Corresponding Author E-mail: norm@ukm.edu.my
DOI : http://dx.doi.org/10.13005/ojc/400203
Article Received on : 13 Nov 2023
Article Accepted on : 22 Mar 2024
Article Published : 24 Apr 2024
Reviewed by: Dr. Ahmed Abd El-Moniem El-Sayed
Second Review by: Dr. Esti mulatsari
Final Approval by: Dr. Abdelwahab Omri
The potential of Sphagnum sericeum (SS) moss extracts as an alternative treatment for childhood acute lymphoblastic leukaemia (ALL) was investigated in this study. Aqueous, methanol, and chloroform SS extracts were analyzed for phytochemical composition and cytotoxic effects on T-cell ALL lines (Jurkat and CCL-119). Results show that the S. sericeum aqueous extract (SSAE) yielded the highest percentage, followed by the methanol extract (SSME) and the chloroform extract (SSCE). Phytochemical analysis identified alkaloids, glycosides, and terpenoids in all extracts. SSME demonstrated significant cytotoxicity towards ALL cells, with the lowest IC50 values observed at 72 hours. Notably, SSME induced morphological changes, including blebbing and cell fragmentation after 6 hours, indicative of apoptosis and cell destruction. These findings suggest SSME's potential as a natural agent for treating paediatric ALL, offering a novel approach in cancer research and contributing insights into the phytochemical compounds and cytotoxic effects of S. sericeum extracts on T-ALL cell lines.
KEYWORDS:Acute lymphoblastic leukaemia; Cytotoxicity; Extraction yield; Phytochemical contents; Sphagnum sericeum;
Download this article as:| Copy the following to cite this article: Latif E. S, Awang N, Rasli N. R, Xuan D. W.O, Juferi N. F, Kamil N. K. N. M, Hamid A. Phytochemical Screening and In Vitro Cytotoxicity of Sphagnum sericeum against Human Acute Lymphoblastic Leukaemia Cell Lines. Orient J Chem 2024;40(2). |
| Copy the following to cite this URL: Latif E. S, Awang N, Rasli N. R, Xuan D. W.O, Juferi N. F, Kamil N. K. N. M, Hamid A. Phytochemical Screening and In Vitro Cytotoxicity of Sphagnum sericeum against Human Acute Lymphoblastic Leukaemia Cell Lines. Orient J Chem 2024;40(2). Available from: https://bit.ly/3Uv2wkd |
Introduction
Acute lymphoblastic leukaemia (ALL) is the most common form of cancer in paediatrics and adolescents, accounting for 80% of childhood leukaemia cases 1. Approximately 3 of 4 children and adolescents diagnosed with leukaemia are diagnosed with ALL, with most cases occurring between the ages of 2 and 5 2. Children with ALL are stratified into standard-, high-, or very high-risk groups. The patients are treated with a multidrug chemotherapy regimen with different combinations and doses based on the stratification group 3,4. Drug toxicity has become a challenge where common chemotherapeutic agent poses side effects, such as avascular necrosis, increased risk of infection, and reduced linear growth 5. Uncertainty about elevated levels of treatment resistance and relapse, particularly in high-risk cases (which include both high-risk and very high-risk groups), treatment toxicity, and toxic death, particularly at high doses, are further exacerbated via the use of an extensive array of intensive multidrug regimens in the initial phase of remission 6,7.
It is currently estimated that more than 50% of anticancer agents in the market are plant-derived natural products 8. Research on plant-derived natural products has gained popularity due to the minimal side effect, multiple signalling actions, and synergistic effect when combined with other synthetic drugs9. For example, vinblastine, an anticancer drug derived from the alkaloid of the plant vinca, is still effective in cancer treatment, including leukaemia 10. Hitherto, many medicinal plants have shown a positive correlation between the folklore and phytochemical analysed.
Sphagnum spp. is part of phylum Bryophyte group of mosses. Various Sphagnum spp. have shown medicinal properties, such as anticancer and antitumor 11, antimicrobial 12, and antiviral 14. As early as the 1900s, Sphagnum sericeum (SS) was used for wound dressing during the First World War. In addition, it is used as an ingredient in skin ointment for infection, treatment for haemorrhoids, and also eye disease 14. However, no study is ever conducted using SS on its anticancer effect, specifically as an antileukaemic agent. As such, this work aims to evaluate the cytotoxity of S. sericeum extracts on Jurkat and CCL-119 cell lines of the human T-acute lymphoblastic cell, and qualitative phytochemical screening using chemical methods. The findings in this study may contribute to the potential discovery of SS as a new candidate for an antileukemic agent.
Materials and Methods
Plant Material
Cameron Highlands, Pahang, was selected as a study site for this research, where S. sericeum (SS) moss was collected; whereas the identification of this moss is done in the Herbarium Unit, Faculty of Science and Technology, Universiti Kebangsaan Malaysia, Bangi. This moss was given the voucher numbers of UKMB 2556, 2557, 2559, and 2561. Collectively, the SS was air-dried at room temperature and grounded to a fine powder.
Selection of variables
The plant sample’s pH, sample-to-solvent ratio, extraction time and temperature, type of solvent, and other components could influence the phytochemical contents and extraction yield [15, 16]. Therefore, some of these variables, such as the types of solvent, extraction temperature, and time were selected in this study. Meanwhile, the variations in polarity would determine the different solvents used, for instance, distilled water (aqueous), 80% of methanol and chloroform. In this study, the time of extraction and the sample-to-solvent ratio was fixed at 30 min and a 1:30 ratio, respectively.
Ultrasound-assisted extraction
An ultrasonic bath (55Hz; 550W; 230V) was used for extraction purposes (Fisherbrand FB15055, Germany). Approximately 5 g of SS powder was placed into separate conical flasks. The SS powder was mixed with 150 ml of different solvents (w/v), comprising distilled water, methanol, or chloroform. The plant sample mixtures were then sonicated for 30 min. The Whatman Filter Paper No. 1 was used to filter the samples for the removal of soil debris. The process was repeated three times. A rotary evaporator (Butchi, Germany) was used to concentrate the SS methanol and chloroform extracts, while a freeze dryer (Innova Bio-Meditech Co., Ltd., China) was used to concentrate the SS aqueous extract.
Determination of extraction yield
The extraction yield is evaluated by having the weight of the extracted SS was divided by the initial amount of SS powder (5 g). A 0.0001 g analytical balance (Ohaus, New Jersey, United States) was used for accurate weighing. The formula below is used to calculate the extraction yield [17]:
Stock extract preparation
Twenty milligrams (20 mg) of the crude extract were dissolved in one millilitre (1 ml) of 100% DMSO to create the stock solution of SS extract. The stock solution was mixed equally using a vortex. The stock solution was then filtered using a 0.22 µM nitrocellulose membrane filter and kept at –20°C freezer until further use.
Phytochemical screening
Alkaloids, coumarin, glycoside, flavonoid, saponin, tannin, terpenoids, and phenolic compounds were filtered via the phytochemical screening. The screening conducted was adopted and modified based on the previously reported methods [18, 19].
Test for alkaloids (Wagner’s test)
Diluted hydrochloric acid was used to dissolve approximately 1 mg of extract. Then, 2–3 drops of Wagner’s reagent were added to the solution. A brown/reddish precipitate appeared, thus demonstrating the presence of alkaloids.
Test for flavonoids (Alkali reagent test)
An amount of 1 mg of extract was diluted in two millilitres of 1 M sodium hydroxide. Subsequently, three drops of 0.6 M of hydrochloric acid were added into the abovementioned mixed solution. The appearance of a yellow colour that disappears or becomes colourless confirms flavonoids in the plant extracts.
Test for glycoside (Keller-Kiliani test)
An amount of 0.4 ml of glacial acetic acid and 1% ferric chloride solutions were used to dissolve around 1 mg of extract. Then, 2–3 drops of concentrated sulfuric acid were added to the solution drop-wise. A reddish-brown ring formation between the layers indicated the presence of glycoside.
Test for phenol and tannins (Ferric chloride test)
Approximately 1 mg of extract was dissolved in 1 ml distilled water, then 3–4 drops of 1% ferric chloride solution was added. The formation of a bluish-black colour indicated the presence of phenols.
Test for coumarin
Approximately 1 mg of samples were moistened with the extraction solvent in a test tube. A layer of filter paper coated with a 1 M sodium hydroxide solution was placed over the mouth of the tube. After submerging the tube in boiling water for a few minutes, the filter paper was taken out and the tube was examined under the UV lamp at 365 nm. The presence of coumarins was revealed via the emergence of yellow fluorescence.
Test for saponin
For this test, a mixture of about 1 mg of extract and 2 ml of distilled water was prepared in a test tube. The formation of froth, which persists when warmed in a water bath for 5 min, showed the presence of saponins.
Test for terpenoids (Salkowski test)
Concentrated sulfuric acid was added gradually after approximately 1 mg of extract and 2 ml of chloroform were blended. A layer of reddish-brown colouring that developed at the site of contact suggested the presence of terpenoids.
Preparation of cell culture
The Jurkat and CCL-119 ALL cell lines were obtained from the American Type Culture Collection (ATCC), Rockville, MD, USA. The cell lines were maintained in a complete growth medium (RPMI-1640) supplemented with 10% of foetal bovine serum (FBS) and 1% of penicillin-streptomycin. Cells were cultured in the laminar flow cabinet and incubated at 37°C in the CO2 incubator (supplemented with 5% CO2) at the Biocompatibility and Biotechnology Laboratory, Faculty of Health Sciences, Universiti Kebangsaan Malaysia. The cultured cells were observed and checked daily to monitor the cell morphology, growth rate, and contamination using an inverted microscope (Olympus, Japan). When the cells reached the concentration of 2–2.5 × 10⁶ cell/ml, they were subcultured into a new culture flask.
Evaluation of cytotoxicity
The number of live cells in the cell suspensions was counted using the trypan blue exclusion method. Based on the idea that live cells have intact cell membranes that reject trypan blue, the cells were counted using a haemocytometer. On the contrary, dead cells have compromised cell membranes; thus, allowing the dye to enter the cell via the cell membrane. This assay was done to obtain the value of half maximal inhibitory concentration (IC50) which indicates the potency of the SSM treatment in inhibiting the biological and biochemical function of the cell lines. It is crucial that this value be used in the subsequent experiment. Cells were counted and seeded at a concentration of 50,000 cells/100 μl medium in each well of a 96-well plate for this test. Subsequently, the cells were treated with SSME in a serial dilution manner, utilizing five concentrations: 100 µg/ml, 50 µg/ml, 25 µg/ml, 12.5 µg/ml, and 6.25 µg/ml and incubated at 37°C in 5% CO2 for various time intervals including 24, 48 and 72 hours. As for the positive control (dexamethasone), five concentrations were employed: 10 µM, 1 µM, 0.1 µM, 0.01 µM, and 0.001 µM. Following the incubation period, a 1:1 mixture of cells and 0.4% trypan blue was added. Trypan blue was added to the cells, and they were counted within 3 to 5 minutes because a longer incubation time will result in cell death and lower viability numbers. Cell viability was calculated using the following formula:
Cell morphology assay
Cell morphology was determined using Giemsa stain. This assay aimed to observe the morphology of the cell membrane by identifying the occurrence of cell blebbing after treatment with SSM extract at different timepoints. The leukaemia cell lines were seeded into a 6-well plate, with the concentration of 1 × 10⁵ cells/well. The total volume of cell suspension in each well is 2.25 ml. Cells were incubated for 48 h at 37°C in the CO2 incubator. Subsequently, a 25 µL SSME treatment is administered using the IC50 value obtained from the trypan blue exclusion assay. After 10, 24, and 48 h of SSME treatment, the cells were collected into a 15 ml centrifuge tube and centrifuge at 1,500 rpm for 3 min. The cell pellet was again suspended in 0.4 millilitres of culture media, and the supernatant was disposed of. To obtain a number of cell populations, a volume of 100 µL cell suspension was smeared onto a glass slide. The glass slide was dried on a warm plate. The cells were then allowed to dry after being fixed with two drops of methanol. After the cells were fixed, three drops of Giemsa stain were added to the glass slide and left for 3 min. The slide was then rinsed with running tap water and mounted with DPX after dried. The glass slide was then observed under the light microscope (Olympus XSZ 107BN, Japan).
Statistical Analysis
All experiments were conducted in triplicate, and data were presented as mean ± mean standard error (SEM). IC50 of the extracts was calculated using the GraphPad Prism software. A two-way ANOVA was used for the normal data distribution, and the value of p < 0.05 indicated significant differences.
Results and Discussion
In children, acute lymphoblastic leukaemia (ALL) is the most common type of cancer or malignancy to be diagnosed. Chemotherapy using various chemotherapeutic agents is given to leukemic patients to extend their life span [20]. However, the application of chemotherapy is always associated with drug toxicity that is harmful to patients [21]. Challenges, such as relapse and drug resistance urge the development of a new, less toxic therapeutic agent. Plant sources, including bioactive compounds from natural sources, have steadily attracted the attention of researchers. Bryophyte moss, such as the Sphagnum species, is believed to have a crucial medicinal purpose [22]. Although S. sericeum possesses some traditional medicinal characteristics, there is no sufficient data available for its anticancer ability, especially its antileukemic properties.
This study is designed to evaluate the cytotoxicity of SS extracts against Jurkat and CCL-119, the human T-ALL cell lines. The extract of SS was prepared using the sonication method. This method is faster and cheaper than the conventional method, such as maceration [23]. Numerous investigations were carried out in order to determine the plant extract’s percentage yield. Most of the assessments were performed in a wide range of temperatures [24- 26]. Therefore, we decided to study the factor of temperature in a narrower range (35–45 ± 2°C) for SS. If the temperature escalated during the experiment, ice was constantly added to the sonicator bath to regulate the temperature. The microwave power was set to limit to avoid possible overheating of the extraction mixture.
Table 1: The percentage yield of S. sericeum extracts.
|
Exp no. |
Solvent |
Temperature (±2°C) |
Percentage yield (±SEM) |
|
1 |
Water |
35 |
4.28 ± 0.39 |
|
2 |
Water |
45 |
5.41 ± 0.93 |
|
3 |
Methanol |
35 |
1.21 ± 0.58 |
|
4 |
Methanol |
45 |
2.52 ± 0.10 |
|
5 |
Chloroform |
35 |
0.40 ± 0.06 |
|
6 |
Chloroform |
45 |
0.84 ± 0.11 |
The time was fixed to 30 min, and the ratio of sample to solvent was fixed at 1:30. Percentage yield (%) was based on three extractions of each experiment. Values were expressed as mean ± SEM (n = 3). Table 1 shows the yield percentage of S. sericeum moss, which was sonicated at different temperatures with different polarities of solvents (distilled water, methanol, and chloroform). The yield percentage at 35°C is 4.28 ± 0.39% (SSAE), 1.21 ± 0.58% (SSME), and 0.40 ± 0.06% (SSCE). Whereas the yield percentage of SSAE, SSME, and SSCE at 45°C is 5.41 ± 0.93%, 2.52 ± 0.10%, and 0.84 ± 0.11%, respectively. The difference between the two temperatures for SSAE is 1.13%, for SSME is 1.31%, and for SSCE is 0.44%. Overall, at the temperature of 45°C, SS moss produced a higher yield percentage than 35°C for all extracts.
Extraction at a lower temperature could prevent the loss of volatile compounds and thermal damage to the extract [27], while a too high extraction temperature may cause degradation of individual phenolic compounds [28]. Based on previous study, an increase in temperature (above 65°C) will decrease the viscosity of extract, causing a decrease in the interaction between target compounds and sample matrix and eventually causing decreased extraction yield [29]. Optimisation of Galanthus woronowii L. Bulbs showed that the temperature at 51.04°C could produce the highest yield extraction for this species [30]. Meanwhile, it was concluded that 60°C is the optimum temperature to extract Artocarpus heterophyllus fruit peel [29].
For the overall extraction process, water (aqueous) extract gave the highest yield, followed by methanol extract and the lowest yield by chloroform extract. This result is comparable to that of the previously published study [31], which showed that the most and least polar solvents provided the highest and lowest yield percentages, respectively. The finding also was in a good agreement for the study that compared the yield percentage of ethanol, methanol, and dichloromethane [32]. Their observation showed that polar compounds were easier to be extracted than non-polar compounds. Both chemical structures of water and methanol contain hydroxyl groups that can bind with plant samples and form a hydrogen bond. However, water effectively extracts the solute due to its high polarity and shorter chain [33]. Chloroform does not contain a hydroxyl group; therefore, it could not form hydrogen bonds with any compound. This could probably be the reason why chloroform produced the least yield percentage.
The prepared extracts were then subjected to phytochemical screening. The results showed that different solvents could extract different bioactive compounds. The screening of different extracts of the moss Leucobryum bowringii Mitt. and Dicranum scoparium Hedw. exhibited positive results for the presence of different bioactive compounds [34]. In our study, three phytochemical compounds are present in the extracts (Table 2). It is observed that alkaloids are only present in SSME and absent in the SSAE and SSCE. Alkaloid is one of the biggest phytochemicals and has a low molecular weight, with nitrogen structure in its structure [35]. Due to the presence of a nitrogen (N) atom, alkaloids generally function as weak bases, forming salts when exposed to acids. These salts demonstrate high solubility in water but limited solubility in less polar organic solvents [36]. Conversely, the free bases are typically soluble in organic solvents such as dichloromethane and diethyl ether but remain insoluble in water. This distinctive set of properties facilitates the extraction and fractionation of alkaloids, adding to their unique characteristics in natural products research. However, the free electron pair of the nitrogen atom renders alkaloids highly reactive, resulting in their intrinsic instability as a group of natural products. Factors such as light, pH fluctuations, and heat can influence their decomposition [36]. These factors may contribute to the absence of alkaloids in SSAE and SSCE. The alkaloid compound can inhibit cell proliferation and induce cell cycle arrest [37]. The analysis of glycosides was positive in all extracts. The presence of glycosides suggests that the compound can cause apoptosis through different apoptotic pathways [38]. Terpenoids were found positive in all extracts but were detected at a higher intensity in methanol and chloroform extracts. According to [39], terpenoids can cause cytostatic and induce cell apoptosis.
Table 2: Results of phytochemical screening.
|
Phytochemical |
Aqueous |
Methanol |
Chloroform |
|
Alkaloids |
– |
+ |
– |
|
Flavonoids |
– |
– |
– |
|
Glycosides |
+ |
+ |
+ |
|
Coumarin |
– |
– |
– |
|
Saponins |
– |
– |
– |
|
Phenols/ Tannins |
– |
– |
– |
|
Terpenoids |
++ |
+++ |
+++ |
(+++) Abundant (++) Highly present (+) Trace (-) Negative
Phytochemical screening was conducted using the method described earlier. Referring to Table 2, all extracts are screened positive for the presence of glycosides and terpenoids, while alkaloids are present only in the methanol extract. The screening test shows negative results for phenols, coumarin, tannin, flavonoids, and saponin. Meanwhile, Çelik et al. (2022) [40] conducted a study on two Sphagnopsida species, Sphagnum divinum Flatberg, and Sphagnum girgensohnii Russow. Their research revealed that the methanol extract of these mosses tested positive for phenols, tannins, and saponins. Notably, the total phenolic content of S. girgensohnii methanol extract surpassed that of S. divinum. Furthermore, Joshi et al. (2002) [41] reported variations in the total phenolic and flavonoid compounds between S. fimbria-tum extracts (41.02 mg ±0.33 GAE/gdw) and P. appendiculatum (30.04 mg±0.25 GAE/gdw), and between P. appendiculatum (24.03 mg ± 0.22 QE/gdw) and S. fimbriatum extracts (38.09 mg ±0.35 QE/gdw), respectively. Quantitative phytochemical analysis [42] of crude extracts showcased the ethanolic extracts of Hyophila involuta with the highest flavonoid content (288.37±0.10 mg RE/g) and Raffia-palm-wine extracts of Hyophila involuta with the highest saponin content (224.70±0.02 mg/g). Similarly, the methanolic extract of Archidium ohioense exhibited the highest cardiac glycosides content (63.71±0.14 mg/g), and the Raffia-palm wine extract of Hyophila involuta showed the highest alkaloids content (102.50±0.12 mg/g). These results contribute to our understanding of the phytochemical composition of SS and are consistent with findings from prior studies on various moss species.
The SSME was selected for further study to assess its cytotoxicity against T-cell ALL lines (Jurkat and CCL-119) due to its highest content of tested phytochemical compounds, including alkaloids, glycosides, and terpenoids. The trypan blue exclusion assay was used in the analysis of the cytotoxic effect of SSME. Owing to the absence of prior research, the experiment was carried out at three distinct intervals to establish the ideal incubation duration for the SS extract treatment. Oztopcu-Vatan et al. (2017) [43] used two time points, 24 and 48 h, for the treatment in their study, where the extracts of the moss Aulacomnium androgynum exhibited optimum cytotoxicity against rat glioma cell at 48 h. Another study by Latif et al. (2018) [44] chose the treatment period of 72 h on CCL-119 cells using Canarium odontophyllum acetone extract.
Fig. 1. And 2. showed the cytotoxic effect of SSME against Jurkat and CCL-119 cell lines at different time points, i.e., 24, 48, and 72 h. The IC50 values for Jurkat and CCL-119 cells treated with SSME are summarised in Table 3. For the positive control, the cytotoxic effects of dexamethasone are shown in Fig. 3. And 4. For Jurkat and CCL-119 cell lines, respectively, at 24, 48, and 72 h of treatment. The IC50 values for Jurkat and CCL-119 cells treated with dexamethasone are summarised in Table 4.
 |
Figure 1: The average percentage cell viability of Jurkat against the concentration of SSME |
 |
Figure 2: The average percentage cell viability of CCL-119 against the concentration of SSME ranging from 0 µg/ml to 100 µg/ml after 24, 48 and 72 h of treatment. |
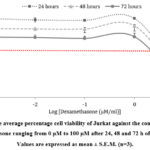 |
Figure 3: The average percentage cell viability of Jurkat against the concentration of dexamethasone ranging from 0 µM to 100 µM after 24, 48 and 72 h of treatment. |
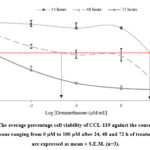 |
Figure 4: The average percentage cell viability of CCL-119 against the concentration of dexamethasone ranging from 0 µM to 100 µM after 24, 48 and 72 h of treatment. |
Table 3: Cytotoxic effects of SSME against Jurkat and CCL-119 cells using trypan blue exclusion assay.
|
Cell line |
Timepoints (h) |
||
|
24 |
48 |
72 |
|
|
Jurkat |
21 ± 0.70 µg/ml |
12 ± 1.00 µg/ml |
9.1 ± 0.30 µg/ml |
|
CCL-119 |
9.8 ± 0.20 µg/ml |
8.1 ± 0.50 µg/ml |
8 ± 0.60 µg/ml |
Table 4: Cytotoxic effects of dexamethasone against Jurkat and CCL-119 cells by using trypan blue exclusion assay
|
Cell line |
Timepoints (h) |
||
|
24 |
48 |
72 |
|
|
Jurkat |
3.7 ± 0.10 µM |
3.1 ± 0.04 µM |
2.1 ± 0.30 µM |
|
CCL-119 |
4.5 ± 0.10 µM |
0.046 ± 0.10 µM |
0.001 ± 0.0004 µM |
The SSME exhibited cytotoxicity towards the Jurkat and CCL-119 ALL cells. The treatment of 72 h produced the lowest IC50 values in both cell lines for both SSME and dexamethasone treatments. Terpenoids, glycoside, and alkaloids are some phytochemicals in the extract that may have resulted in cell cytotoxicity. The action mechanism of the phytochemicals in the moss extract caused an antiproliferative effect towards the ALL cell line [45].
Fig. 5. shows the Jurkat & CCL-119 T-ALL cells stained with Giemsa stain under the light microscope (1000× magnification). Fig. labelled A and I (Jurkat and CCL-119 cells) represent the negative control, i.e., the untreated cells. The intact cells displayed cytoplasm that was attached to a membrane. Below is a picture of cells treated with dexamethasone (C and K) and an SSME at IC50 after six hours of treatment. The cells appear morphologically asymmetrical, with membrane blebbing (arrow), shrinkage of cells (S), and cell fragmentation (*) compared to the negative control.
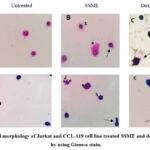 |
Figure 5: Cell morphology of Jurkat and CCL-119 cell line treated SSME and dexamethasone by using Giemsa stain. |
The cells undergo a series of morphological changes, with the notable formation of apoptotic bodies [46]. Cell shrinkage and membrane blebbing are two characteristics of apoptotic cells [44]. Cell morphology observation was performed to observe the blebbing of cells after 6 h of exposure of SSME and dexamethasone using Giemsa stain (Fig. 5.). The high level of terpenoids in the extract caused the disruption of cell membrane integrity and induced cell blebbing [47]. Furthermore, the alkaloids induced apoptosis in the cells, which is characterised by regulated morphological processes that end in cell death, such as nuclear condensation, membrane blebbing, shrinking of the cell, and DNA breakage/laddering [48,49].
Conclusion
SSAE showed the highest yield percentage, followed by SSME, and the least was SSCE. Regardless of the yield obtained, all extracts tested positive for alkaloids, glycosides, and terpenoids. S. sericeum methanolic extract could induce cytotoxicity towards Jurkat and CCL-119 T-ALL cell lines at all time points. However, the lowest values of IC50 were obtained at 72 h of treatment for both cell lines. In conclusion, SS extracts could act as an alternative phytochemotherapeutic agent for the treatment against ALL in paediatric patients. Nonetheless, it is essential to note that the higher percentage yield does not necessarily correlate with maximum biological activity. Further study is needed concerning the mechanism of action, and the cytotoxic reaction of SS extracts towards ALL cell lines. This is the first publication that discusses the cytotoxic effects of SS on T-ALL cell lines. This data can contribute to the discovery of other medicinal benefits of this moss.
Acknowledgement
This project was funded by Universiti Kebangsaan Malaysia under the Research University Grant with the grant code of GUP-2017-078. Special thanks to the Moss Herbarium team from the Faculty of Science and Technology, UKM Bangi, for their assistance in the collection and identification of the bryophyte moss.
Conflict of Interest
The writers disclose no competing interests. The writing and content of this article are the sole responsibility of the authors.
References
- Zhang P.Y., Yang Y.J., Fu C.M., Xiang L.L., Wang Q. and Li X.L., Eur Rev Med Pharmacol Sci., 2015; 19:1356-63.
- American Cancer Society. Last Medical Review: Available at: https://www.cancer.org/cancer/leukemia-in-children/.
- Hunger S.P. and Mullighan C.G., N Engl J Med., 2015; 373:1541-52. DOI: 10.1056/NEJMra1400972.
CrossRef - Arakawa A., Springer., 2020: 123-139. DOI 10.1007/978-981-15-0548-5_13.
- Cooper S.L. and Brown P.A., Pediatr Clin North Am., 2015; 62: 61-73. DOI 10.1016/j.pcl.2014.09.006.
CrossRef - Chu M.C., Yin K., Wang P., Xue Y., Zhou P., Wang Y. and Wang Y., Oncotarget., 2017; 8: 1405-1415. DOI 10.18632/oncotarget.13630.
CrossRef - Pui C.H. and Evan W.E., Semin Hematol., 2013; 50: 185-196. DOI 10.1053/j.seminhematol.2013.06.007.
CrossRef - Twilley D. and Lall N., Elsevier.; 2018:. 139-178. DOI 10.1016/B978-0-08-102081-4.00007-1.
CrossRef - Srivastava A., Srivastava P., Pandey A., Khanna V.K. and Pant A.B., Academic Press., 2019: 625-655. DOI 10.1016/B978-0-12-814619-4.00025-2.
CrossRef - Greenwell M. and Rahman P.K.S.M., Int J Pharm Sci Res., 2015; 6: 4103-4112. DOI 10.13040/IJPSR.0975-8232.6(10).4103-12.
- Dey A. and Mukherjee A., J. Acute. Dis., 2015; 4: 13. DOI 10.1016/j.joad.2015.04.011.
CrossRef - Seham A.S., Hussein Y., Abou Sabaa G. and Abdel-Monaem A.S., Egypt. J. Microbiol., 2017; 52: 63-86. DOI 10.21608/EJM.2017.893.1020.
- Alam A., Shrama V., Rawat K.K. and Verma P.K. SMU Medical Journal., 2015; 2: 299-315.
- Chandra S., Chandra D., Barh A., Pandey R.K. and Sharma I.P., J Tradit Complement Med., 2017; 7: 94-98. DOI 10.1016/j.jtcme.2016.01.007.
CrossRef - Belwal T., Dhyani P., Bhatt I.D., Rawal R.S. and Pande V., Food Chem., 2016; 207:115-124. DOI 10.1016/j.foodchem.2016.03.081.
CrossRef - Pandey A., Belwal T., Sekar K.C., Bhatt I.D. and Rawal R.S., Ind Crop Prod., 2018; 119: 218-225. DOI 10.1016/j.indcrop.2018.04.019.
CrossRef - Bimakr M., Rahman R.A., Taip F.S., Adzahan N.M., Sarker M., Islam Z. and Ganjloo A., Molecules. 2012; 17: 11748-11762. DOI 10.3390/molecules171011748.
CrossRef - Tiwari P., Kumar B., Kaur M., Kaur G. and Kaur H., Internationale Pharmaceutica Sciencia., 2011; 1: 98-106.
- Kumar R.S., Venkateshwar C., Samuel G. and Rao S.G., Int J Eng Sci., 2013; 2: 6.
- Aznab M. and Rezaei M., Hematol Oncol., 2017; 35: 113-117. DOI 10.1002/hon.2253.
CrossRef - Tomizawa D. and Kiyokawa N., Hematological Disorders in Children; Acute lymphoblastic leukemia, Springer, Singapore, 2017: 33-60. DOI 10.1007/978-981-10-3886-0_2.
CrossRef - Chandra S., Chandra D., Barh A., Pandey R.K. and Sharma I.P., J Tradit Complement Med., 2017; 7: 94-98. DOI 10.1016/j.jtcme.2016.01.007.
CrossRef - Medina-Torres N., Ayora-Talavera T., Espinosa-Andrews H., Sánchez-Contreras A. and Pacheco N., Agronomy., 2017; 7: p.47. DOI 10.3390/agronomy7030047.
CrossRef - Chen C., You L.J., Abbasi A.M., Fu X. and Liu R.H., Carbohydr Polym., 2015; 5: 36. DOI 10.1016/j.carbpol.2015.05.003.
- Bubalo M.C., Urko N.C., Tomaševic M., Ganic K.K.E. and Redovnikovic I.R.I., Food Chem., 2016; 200: 159-166. DOI 10.1016/j.foodchem.2016.01.040.
CrossRef - Xu D.P., Zheng J., Zhou Y., Li Y., Li S. and Li H.B., Food Chem., 2017; 217: 552-559. DOI 10.1016/j.foodchem.2016.09.013.
CrossRef - Vinatoru M., Mason T. and Calinescu I., Trends Analyt Chem., 2017; 97:159-178. DOI 10.1016/j.trac.2017.09.002.
CrossRef - Dahmoune F., Nayak B., Moussi K., Remini H. and Madani K., Food Chem., 2015; 166:585-595. DOI 10.1016/j.foodchem.2014.06.066.
CrossRef - Moorthy I.G., Maran J.P., Ilakya S., Anitha S., Sabarima S.P. and Priya B., Ultrason Sonochem., 2017; 34:525-530. DOI 10.1016/j.ultsonch.2016.06.015.
CrossRef - Bulduk I., Gokce S. and Enginar H., Eur J Med Chem., 2018; 24: 1-12. DOI 10.9734/EJMP/2018/42871.
CrossRef - Efthymiopoulos I., Hellier P., Ladommatos N., Russo-Profili A., Eveleigh A., Aliev A., Kay A. and Mills-Lamptey B., Ind Crop Prod., 2018; 119: 49-56. DOI 10.1016/j.indcrop.2018.04.008.
CrossRef - Rodrigues V.H., De Melo M.M., Portugal I. and Silva C.M., J Supercrit Fluids., 2018; 135:263-274. DOI 10.1016/j.supflu.2018.01.010.
CrossRef - Płotka-Wasylka J., Rutkowska M., Owczarek K., Tobiszewski M. and Namieśnik J., Trends Analyt Chem., 2017; 91:12-25. DOI 10.1016/j.trac.2017.03.006.
CrossRef - Mitra S., Manna A. and Rai R., J Pharmacogn Phytochem., 2019; 8: 649-654.
- Kukula-Koch W. and Widelski J., Pharmacognosy; Alkaloids, Elsevier, 2017: 163-198. DOI 10.1016/B978-0-12-802104-0.00009-3.
CrossRef - Klein-Júnior, L.C., Heyden, Y.V. and Henriques, A.T., TrAC, Trends Anal. Chem., 2016; 80: 66-82. DOI 10.1016/j.trac.2016.02.021.
CrossRef - Efferth T. and Oesch F., Seminars in Cancer Biology., 2019. DOI 10.1016/j.semcancer.2019.12.010.
- Diederich M., Muller F. and Cerella C., Biochem Pharmacol., 2017; 125: 1-11. DOI 10.1016/j.bcp.2016.08.017.
CrossRef - Ansari I.A. and Akhtar M.S., Chemistry, Pharmacology and Health Care Practices., 2019; 53: 54-74. DOI 10.1007/978-981-13-7205-6_3.
CrossRef - Çelik T.A., Aslantürk, Ö.S., Aslan G. and Kirmaci M., Anatolian Bryol., 2022; 9: 58-69. DOI 10.26672/anatolianbryology.1301057.
CrossRef - Joshi S., Singh S., Sharma R., Vats S., Nagaraju G.P. and Alam, A., Plant Sci. Today., 2022; 9: 986-990. DOI 10.14719/pst.1892.
- Olasoji K.O., Makinde A.M., Akinpelu B.A. and Isa M.O., Sci. Cold Arid. Reg., 2019; 11: 382-388. DOI 10.3724/SP.J.1226.2019.00382
CrossRef - Oztopcu-Vatan P., Savaroglu F., Iscen C.F., Kabadere S., Ozturk N. and Ilhan S., J Anim Plant Sci., 2017; 27: 1909-1917.
- Latif E.S., Basri D.F. and Shelan T.N., Int J Sci Res Environ Sci Toxicol., 2018; 2: 8. DOI 10.15226/2572-3162/3/1/00113.
- Karim F.A., Suleiman M., Rahmat A. and Bakar M.F.A., Int J Pharm Pharm Sci., 2014; 6: 292-297.
- Atkin-Smith G.K. and Poon I.K., Trends Cell Biol., 2017; 27: 151-162. DOI 10.1016/j.tcb.2016.08.011.
CrossRef - Wojtunik K.A., Ciesla L.M. and Waksmundzka-Hajnos M., J. Agric Food Chem., 2014; 62: 9088-9094. DOI 10.1021/jf502857s.
CrossRef - Elmore S., Toxicol Pathol., 2007; 35:459–516. DOI 10.1080/01926230701320337.
CrossRef - Habli Z., Toumieh G., Fatfat M., Rahal O.N. and Gali-Muhtasib H., Molecules., 2017; 22: 250. DOI 10.3390/molecules22020250.
CrossRef

This work is licensed under a Creative Commons Attribution 4.0 International License.
About The Author
![]()
A New Edition of Web of Science
Journal Impact Factor
2022: 0.5
Five Year: 0.8
Journal is Indexed in

Cabells Whitelist
![]()


