Forced Oxidative Degradation of Anti-Hepatitis C Drugs Sofosbuvir and Daclatasvir: Characterization and Quantification
Sabrein H. Mohamed1,2* , Rasha M.K. Mohamed1, Aida L. El-Ansary2, Ahmed I. Mahmoud3, Tamer H. A. Hasanin1,4
1Chemistry Department, College of Science, Jouf University, Sakaka, Saudi Arabia.
2Chemistry Department, Faculty of Science, Cairo University, Giza, Egypt.
3National Center for Environmental and Clinical Toxicology, Cairo University, Giza, Egypt.
4Department of Chemistry, Faculty of Science, Minia University, El Minia, Egypt.
Corresponding Author E-mail: sabrein@sci.cu.edu.eg
DOI : http://dx.doi.org/10.13005/ojc/400201
Download this article as:
![]()
This study focuses on the analysis of hepatitis C drugs, specifically sofosbuvir (SOF) and daclatasvir (DCL), and their oxidative products. The drugs were isolated and characterized using FTIR, 1HNMR, and Mass Spectrometry techniques. Additionally, the drugs were oxidized using cerium (IV) in the presence of sulfuric acid at 100ºC. A spectrophotometric method was developed for the quantitative analysis of SOF and DCL in pure and pharmaceutical forms. The oxidation of the drugs was monitored by back determination of residual Ce(IV) using Fe(II) with ferroin as an indicator at 510 nm. The method demonstrated good sensitivity with RSD%, and the data were statistically analyzed using t- and F-tests.
KEYWORDS:Daclatasvir; Oxidative Degradation Products; Sofosbuvir
Introduction
Sofosbuvir and Daclatasvir are used as antiviral drugs to treat persistent infections with the hepatitis C virus (HCV). Daclatasvir targets the NS5A protein involved in viral assembly and replication, whereas sofosbuvir targets the HCV NS5B polymerase enzyme to suppress viral replication. To maximize adverse effect reduction and attain high cure rates for hepatitis C, both medications, which belong to the direct-acting antiviral (DAA) class, are used in combination with other drug compounds 1-3.
For drug development and quality control, forced degradation studies are crucial. These studies intentionally subject pharmaceutical ingredients and products to stress to evaluate stability, degradation mechanisms, and contaminants. The primary objectives of forced degradation research include stability assessment, identification of degradants, validation of analytical methods, optimization of formulations, and ensuring regulatory compliance. Common stress conditions used in forced degradation studies include hydrolysis, oxidation, thermal stress, photodegradation, and humidity.
A literature review indicates that there are limited methods available for analyzing SOF and DCL in pharmaceutical formulations. The methods include HPLC 4-13, (UHPC) 14-16, and electrochemical 17 methods. These methods are intricate and necessitate comprehensive pre-treatment of samples and detailed clean-up procedures before analysis. A comprehensive literature review indicates that only a limited number of spectrophotometric methods exist for quantifying SOF and DCL in both their pure forms and pharmaceutical dosages 18-22.
In numerous quality control and clinical laboratories, visible spectrophotometry is often the most convenient analytical technique. This method is favored for its high sensitivity, excellent analytical selectivity, impressive accuracy and precision, and widespread availability for analyzing pharmaceutical products. The oxidizing agent cerium IV (Ce(IV)) has been utilized to detect various drugs. 23–27.
This study elucidates the structure of the forced oxidation product formed between Ce(IV) and SOF or DCL for the first time. The degradation of both drugs is isolated and characterized using FTIR, 1H-NMR, and mass spectrometry. Spectrophotometric titration with excess Ce(IV) and Fe(II) is employed for the accurate determination of SOF and DCL in pure forms and tablets.
Materials and Methods
Apparatus
During the whole study, a Scientech SA 210 digital analytical balance was used to measure weight. A Tecchin water bath was used to control temperature. The pH measurements were performed with the aid of a Jenway pH meter. FTIR spectra were scanned with the aid of a Nicolet 6700 spectrometer (USA) by applying the KBr-disk technique at the Egyptian Chemistry Administration, Cairo, Egypt. 1H-NMR spectra were obtained using a Varian 300 MHz NMR instrument (USA) using DMSO as a solvent and tetramethylsilane (TMS) as an internal standard. Mass spectra were recorded using a Q 1000 EX GC-MS Shimadzu spectrometer (Japan) at 70 eV and 100 µA using a direct insertion probe. 1H-NMR spectra and mass spectra curves were carried out at the Micro Analytical Center, Faculty of Science, Cairo University, Giza, Egypt. Absorption spectra were obtained with a PerkinElmer Lambda 4B UV-visible spectrophotometer.
Materials and Chemicals
The quality standards Daclatasvir (99.3%) and Sofosbuvir (99.9%), as well as Mpiviropack® (400 mg/tablet) and Daclaviroccyrl® (60 mg/tablet), were sourced from Marcyrl Pharma (Egypt). Ferrion indicator, sulfuric acid, and DMSO-d6 were obtained from Merck (Germany), and cerium sulfate tetrahydrate was purchased from Intrade GmbH (Germany). All experiments were carried out using bi-distilled water.
Solutions
404 mg of cerium sulfate tetrahydrate was dissolved using the minimum amount of 1.0 mol L-1 H2SO4. The resulting solution was transferred to a 100 mL volumetric flask and diluted to the mark with the same solvent.
A stock solution of 1,10-phenanthroline (0.1 mol L-1) was prepared by dissolving 198.0 mg in dilute sulfuric acid in a 10 mL flask. A working solution with a concentration of 10.0 mmol L-1 was then made by adding sulfuric acid. A 10.0 mmol L-1 stock solution of Fe(II) was prepared from ferrous ammonium sulfate hexahydrate, and a working Fe(II) solution with a concentration of 0.1 mmol L-1 was obtained by dilution. The ferroin indicator, [Fe(Phen)3]2+, was prepared by mixing 1,10-phenanthroline and iron (II) sulfate in a 3:1 molar ratio.
Stock solutions of 0.1 mol L-1 SOF and DCL were prepared by dissolving 529 mg and 812 mg, respectively, in ethanol and diluting to 100 mL with doubly bi-distilled water.
The pharmaceutical formulations were prepared by grinding ten tablets of mpiviropack® and Daclavirocyrl® with a mortar and pestle. The powder from one tablet was mixed with ethanol or bi-distilled water and stirred vigorously to ensure thorough mixing of the active ingredient. The resulting precipitate was washed multiple times with bi-distilled water to remove any unwanted solids.
Method for oxidative degradation of SOF and DCL
High concentrations of Ce(IV) were prepared with either DCL (0.8 g Ce(IV) with 0.08 g DCL) or (0.5 g Ce(IV) with 0.05 g SOF) in a 1.0 mol L-1 H2SO4 acid medium. The mixture was heated at 100 ºC for 25 minutes with stirring. After allowing the precipitate to form overnight, it was washed with methanol (for SOF) or distilled water (for DCL), filtered, and stored in a desiccator.
Identification and clarification method for oxidation product structure.
Chemical characterization is essential for studying materials. 1H-NMR spectroscopy is commonly used to determine structure by analyzing the relative configuration, coupling between nuclei, and chemical shifts. IR spectroscopy helps identify functional groups, bond lengths, and. Mass spectrometry reveals molecular weight and fragment masses. Combining these methods provides a comprehensive understanding of a molecule’s structure. Ce(IV) concentrations with DCL or SOF were prepared in an acid medium and heated, resulting in precipitates that were washed and stored.
Spectrophotometric titration
One of the widely used processes for Ce(IV) relies on the ability to oxidize and bleach the ferroin indicator color. In this part, SOF and DCL were added to excess Ce(IV) and then heated for 30 and 25 minutes for SOF and DCL, respectively, at 100 °C then cooling for at least 5 minutes. The residual Ce(IV) is determined by titration against Fe(II) in the presence of a ferroin indicator. The endpoint was measured at λmax of ferrion 510 nm.
The oxidation-reduction equation of ferroin is summarized as follows:
[Fe(Phen)3]+3 + e ↔ [Fe(Phen)3]+2
Red Color ↔ Blue Color
Fe(II) forms an intense red color with the indicator, whereas the oxidized Fe(III) indicator complex is pale blue.
The amount of SOF and DCL in the aliquot was calculated using the following formula:
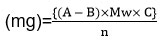
Where:
A: is the amount of Fe(II) used in the blank titration, in ml.
B: ml of Fe(II) used in the sample titration.
Mw: is the drug’s relative molecular mass.
C: is the oxidant’s molar concentration or intensity in mol L-1.
n: is the quantity of Ce(IV) molecules that react with each mole of SOF or DCL.
n=12 or 10 for SOF or DCL, respectively
Statistical formulas and evaluation of the experimental results
The statistical formulae used in this thesis can be summarized in the following sections.
Arithmetic mean
It is a criterion used to compare replicate results in analytical experiments. The arithmetic mean is an average value (usually abbreviated to the mean). It can be calculated using the following formula:

Where (x ̅ ) = arithmetic mean
∑ (xi ) = sum of the individual values
n = number of observed measurements
Standard deviation (SD)
A more useful measure, which utilizes all the values, is the standard deviation, SD, which is defined as follows:
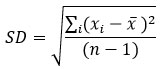
Where:
SD = standard deviation
∑i (xi – x ̅ )2 = Sum of the squared deviation of individual value of varieties from the mean of the series
n-1 = degree of freedom for sample
Standard error (SE)
The sampling distribution of the mean is the distribution of all possible sample means. It has the same mean as the original population and its standard deviation is the standard error of the mean (SEM), which is related to the standard deviation (SD) of the individual measurements.

This parameter measures the statistical reliability and accuracy of the arithmetic mean by showing how much it would change with additional observations.
Test of significance
The F-test
This test compares the standard deviations of the two methods to see if there is a significant difference. F is calculated using the squared standard deviations.

Where: SD12 > D22 There are v1 and v1, two different degrees of freedom, where degrees of freedom are defined as (n−1) for each case. If the calculated F value from equation the above equation exceeds the tabulated F value at the selected confidence level, then there is a significant difference between the variances of the two compared methods.
The Student’s t-test
This test compares replicate measurements from two different methods. A statistical t value is calculated and compared to a tabulated value at a specific confidence level. If the calculated t value is higher, there is a significant difference between the methods. Otherwise, there is no significant difference. The t value is calculated using the equation:
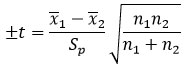
Where x ̅1 is the mean of a set containing n1 observations, is the mean of n2 values comprising the other set, and Sp is the pooled standard deviation of the individual measurements calculated using the following equation:
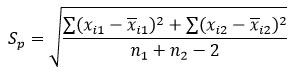
Where xi1 and xi2 are the individual values in each set.
When n1 = n2 = n3 then:
Results and Discussion
Structural elucidation of the oxidative products
Mass Spectra
The spectra clearly show that the molecular ion peak of sofosbuvir was found and manifested at m/z 526.81. This research is comparable to a prior investigation on the oxidation of SOF with H2O2 at room temperature, Figure 1. The values of m/z of the product fragments were found at 378, 286; 270; 178; 137; and 97 (Scheme 1).
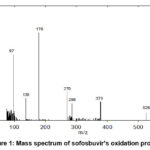 |
Figure 1: Mass spectrum of sofosbuvir’s oxidation product |
 |
Scheme 1: The expected fragmentation of Sofosbuvir’s oxidation product. |
Yande Huang et al. studied the oxidative degradation of DCL’s imidazole moiety under forced conditions. The degradation was tested in a 0.3% H2O2 solution at room temperature for 7 days. Degradation products were identified after exposing the DCL solution to high-intensity light or UV radiation. 28,29.
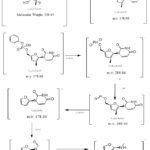
The empirical formula of the oxidation product of DCL with Ce(IV) was determined through mass spectrometry, IR, and 1H-NMR spectroscopy in this study. Mass spectrometry analysis revealed a molecular ion peak at m/z 772.0 for the oxidation product of daclatasvir. The product fragments were observed at m/z values of 738.27, 722.56, 564.53, 459.62, 388.02, 234.37, 209.02, 198.35, 182.88, 168.33, and 154.2.
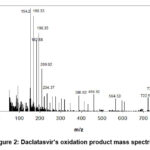 |
Figure 2: Daclatasvir’s oxidation product mass spectrum |
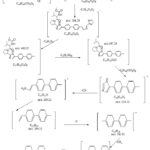 |
Scheme 2: Daclatasvir’s oxidation product expected fragmentation. |
FTIR studies
During the survey, it was unable to find any published research on evaluating SOF and DK using FTIR. Upon the experimental study SOF demonstrates characteristic bands at 3354 cm-1 (N-H stretch), 3249 cm-1 (enol O-H stretch), 3090 cm-1 (=C-H stretch, asymmetric), 2938 cm-1 (C-H stretch aromatic, symmetric), 2985 cm-1 (C-H stretching (CH3), asymmetric), 2911 cm-1 (C-H stretching (CH3), symmetric), 1718 cm-1 (C=O stretch (ester)), and 1676 cm-1 (C (P-O-R stretch). Separated SOF oxidation products were analyzed by FTIR to gain a better understanding of what occurs during oxidation. The scanning was captured. Compared to the pure form, the function groups of the oxidation product of SOF exhibit bands at 3604 cm-1 for the N-H amide group and 3453 cm-1 for the O-H stretching group. As a result of its attachment to Phosphorus, the stretching of the O-H group shifted to a higher frequency, while the =C-H and C-H peaks at 2,850 and 2,104 cm-1, respectively, shifted to lower frequencies. The peak of C-N stretching at 1542 cm-1 has been shifted to a longer wavelength. The bands due to N-P=O and C-F frequencies, which were present in the IR spectrum of the pure form of SOF, disappeared in the spectrum of the oxidation product, while P-O-R remained with a slight drift, validating the proposed structure of the oxidation product. Figure 3 (A).
Figure 3 (B) shows the FTIR spectral bands of pure DCL and its oxidation product to show the changes accompanying the important bands. Characteristic bands for DCL appear at 3382 cm-1 (N-H stretch), 3150 cm-1 (=C-H stretch asymmetric), 2962 cm-1 (C-H stretch (CH3)), 2928 cm-1 (C-H aromatics symmetric), 2871–2361 cm-1 HCl, 1726 cm-1 (C=O stretch (ester)), 1644 cm-1 (C=O amide), 1525 and 1494 cm-1 (C=C stretch aromatic ring), 1211 cm-1 (C-N stretching), and 1193 cm-1 (C‒O stretch). The characteristic bands of the DCL oxidation product show some changes, where the N-H amide group appears at 3406 cm-1 with a small shift to high frequency, the =C-H and C-H stretch were shifted to a low wavenumber, and the carbonyl starching of ester and imid groups appeared together as one peak at (1688 cm-1).
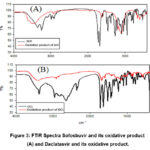 |
Figure 3: FTIR Spectra Sofosbuvir and its oxidative product (A) and Daclatasvir and its oxidative product. |
1H-NMR Studies
The oxidation product’s molecular structure was determined using 1H-NMR spectroscopy. The assignments of the 1H-NMR spectra for the pure and oxidation products of SOF are shown in Table 1. Pure SOF’s 1H-NMR spectrum exhibits a singlet peak at 10.0 ppm attributed to imid proton, doublet peak at 9.6 ppm attributed to 1-ethylene, peaks at 6.1, 4.4, and 3.83 ppm attributed to tetrahydrofuran protons, peak at 4.93 ppm attributed to methane proton, peak at 4.28 ppm attributed to methylene proton, peaks at 7.18-7.28 attributed to H benzene ring, Figure 4. The signal due to the -OH group attached to the P-atom after oxidation is what causes the signal at 11.98 ppm in the 1H-NMR spectrum of SOF oxidation product. The signal due to the -NH imid group has the same shift at 10.0 ppm as the pure form. The signals due to H 1-ethylene at 9.62 ppm slightly shifted to 9.23, and aromatic protons were present at the same shift.
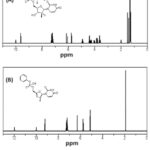 |
Figure 4: 1H-NMR spectra for Sofosbuvir (A), |
Table 1: 1H-NMR spectral data of Sofosbuvir (SOF) and its oxidation Product with Ce(IV).
|
Assignment |
Chemical shift δ (ppm) |
|
|
|
Pure SOF |
Oxidation product SOF |
|
1H/NH imid |
10.0 |
10.0 |
|
1H/NH amine |
2.0 |
– |
|
1H/OH alcohol |
3.58 |
11.98 |
|
3H/CH tetrahydrofuran |
3.83, 4.40, 6.11 |
– |
|
6H/CH 1-benzene |
7.18-7.28 |
7.18-7.28 |
|
2H/ CH2 methylene |
4.0-4.28 |
– |
|
2H//CH methane |
3.63-4.93 |
– |
|
9H/CH3 methyl |
1.28-1.47 |
– |
|
2H/1-ethylene |
5.76 and 9.62 |
– |
|
1 H/ CH 2-furan |
– |
6.3 |
|
3H/CH3 methyl |
– |
1.93 |
|
2 H/ 1-ethylene |
– |
5.76 and 9.23 |
1H-NMR spectra were recorded for the DCL and its oxidative product. Their assignments are listed in table 2. The 1H-NMR spectrum of DCL shows a singlet peak at 13.0 ppm assignable to NH imidazole proton, protons of benzene rings at 7.85-8.3 ppm, chemical shifts due to imid (NH) protons were found at 8.03 ppm, imidazole CH signals at 7.35 ppm, the triplet at 4.7 ppm due to CH of pyrrolidine, the methine C-H show doublet at 4.5 ppm, 6H of CH3 methyl at 3.6 ppm, 2H of CH methine at 2.6 ppm and 12H of CH3 methyl at 0.9 ppm, Figure 5.
The 1H-NMR spectrum for DCL oxidation product shows two main differences from DCL, a singlet peak at 11.0 ppm assignable to NH imidazole proton shifted to a higher field compared to pure form, the intensity of signal at 7.35 ppm for 1H of imidazole CH was lowered.
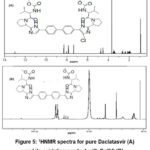 |
Figure 5: 1HNMR spectra for pure Daclatasvir (A) and its oxidation product with Ce(IV) (B). |
Table 2: 1H-NMR spectral data of Daclatasvir and its oxidative product with Ce(IV).
|
Assignment |
Chemical shift δ (ppm) |
|
|
|
Daclatasvir |
Oxidation product |
|
1H/NH imidazole |
13 |
11 |
|
1H/CH imidazole |
7.35 |
7.35 (low intensity) |
|
4H/CH 1-benzene |
8.3 |
8.3 |
|
2H/NH second amide |
8.03 |
8.03 |
|
4H/CH 1-benzene |
7.85 |
7.85 |
|
2H /CH pyrrolidine |
4.7 |
4.7 |
|
2H /CH methane |
4.5 |
4.5 |
|
6H /CH3 methyl |
3.6 |
3.6 |
|
2H /CH methine |
2.6 |
2.6 |
|
12H of CH3 methyl |
0.9 |
0.9 |
Quantification of both drugs in pure and pharmaceutical formulation
Tested solutions with concentrations of 21.0, 10.8, and 5.2 µg and 14.70, 22.17, and 29.55 µg of SOF and DCL were analyzed. The recovery values were 96.19%, 98.42%, and 100.38% with standard deviation percentages of 0.88%, 0.75%, and 0.37%, respectively (Table 3).
Table 3: Spectrophotometric titration of Sofosbuvir and Daclatasvir in pure form and pharmaceutical formulations
|
Taken (µg) |
Found (µg) |
%Recovery*±SD% |
Taken (µg) |
Found (µg) |
%Recovery*±SD% |
|
Sofosbuvir |
Daclatasvir |
||||
|
Pure Sofosbuvir |
Pure Daclatasvir |
||||
|
21.0 |
20.2 |
96.19 ± 0.88 |
14.70 |
14.65 |
99.60 ± 0.90 |
|
10.8 |
10.63 |
98.42 ± 0.75 |
22.17 |
22.21 |
100.18 ± 0.62 |
|
5.2 |
5.22 |
100.38 ± 0.37 |
29.55 |
29.64 |
100.30 ± 0.87 |
|
Mpiviropack tablet (400 mg/tablet) |
Daclavirocyrl® |
||||
|
21.0 |
21.9 |
104.25 ± 0.62 |
14.70 |
14.57 |
99.11 ± 1.30 |
|
10.8 |
10.53 |
97.50 ± 0.71 |
22.17 |
21.86 |
98.60 ± 1.29 |
|
5.2 |
5.4 |
103.85 ± 0.44 |
14.70 |
14.65 |
99.60 ± 0.90 |
|
*: Average of five measurements. |
|||||
Method Validation
The developed methods were validated against a previously published method [22]. Intra-day and between-day precisions for SOF and DCL were less than 1.0%. Accuracy was assessed by percentage recovery and precision by standard deviation. Results indicate high accuracy and precision in estimating SOF and DCL in dosage forms. The suggested methods were compared to reference methods using variance ratio F-test and student t-test, showing no significant differences. The suggested methods had higher recovery rates and were unaffected by tablet matrix. These methods are recommended for routine analysis in drug quality control labs.
Table 4: Inter-and Intra-days precision of the determination of Sofosbuvir and Daclatasvir using ferrion.
| Drug | Taken | Intra Day | Inter Day | ||||||
| µg mL-1 | Found | Recovery*±SD% | t-test | F-test | Found | Recovery*±SD% | t-test | F-test | |
| µg mL-1 | µg mL-1 | ||||||||
| Sofosbuvir | 21 | 20.5 | 97.62±0.88 | 2.12 | 1.38 | 20.8 | 99.05 ±0.45 | 1.92 | 1.99 |
| 5.2 | 5.3 | 101.92±0.47 | 2.32 | 1.01 | 5.13 | 98.65±0.33 | 1.52 | 2.32 | |
| Daclatasvir | 14.7 | 14.62 | 99.45±0.48 | 2.66 | 1.2 | 14.52 | 98.77±0.79 | 1.12 | 1.88 |
| 22.27 | 22.06 | 99.50±0.87 | 2.12 | 1.52 | 22.23 | 100.27±0.11 | 1.53 | 2.42 | |
*: Average of five measurements.
The tabulated t-test at 95% confidence limit is 2.78, and the tabulated F- test 0.05) is 6.388
Conclusion
This study examined the degradation of sofosbuvir and daclatasvir in an acidic medium using cerium (IV). The results showed that both Hepatitis C drugs are susceptible to oxidative conditions. A spectrophotometric method was developed to detect the drugs in pure and pharmaceutical forms, offering high sensitivity, cost-effectiveness, simplicity, repeatability, and reproducibility (RSD%<1.0). The recovery rates ranged from 96.19% to 100.38%, with standard deviation percentages between 0.37 and 88.0%. This method is valuable for quality control analysis of sofosbuvir and daclatasvir in pharmaceutical preparations, free from interference by common additives.
Acknowledgment
The author would like to acknowledge the faculty of science at Cairo University, Egypt.
Conflict of Interest
The authors declare no competing interests.
References
- World Health Organization. Model list of essential medicines, 2019.
CrossRef - Llewellyn, A.; Simmonds, M.; Irving,W. L.; Brunton, G.; Sowden, A. J. Medicine and Policy 2016, 1, 1-16.
CrossRef - Ajlan, A. A.; Al-Gain, R.; Ahmed, M.; Abu-Riash, T.; Alquaiz, M.; Aba Alkhail, F.; Alashgar, H.; Alkhairallah, T.; Alkortas, D.; Al-jedai, A. Journal of the American Pharmacists Association 2021, 61(2), e159-e170.
CrossRef - Mohamed, H. M.; Saad, A. S.; Morsi, A. M.; Essam, H. M. Microchemical journal 2023, 186, 108344.
CrossRef - Hassouna, M.E.M.; Abdelrahman, M.M.; Mohamed, M.A. J. of forensic sciences and criminal investigation 2017,1(3), 555-562.
CrossRef - Al-Tannak, N.F.; Hemdan, A.; Eissa, M.S. Inter. J. of Anal. Chem. 2018 Article ID 6535816.
CrossRef - Farid, N.F.; Abdelwahab, N.S. J. of Liq. Chrom. & Rel. Techno. 2017, 40(7), 327-332.
CrossRef - Zaman, B.; Siddique, F.; Hassan, W. Chromatographia. 2016, 79, 1605-1613.
CrossRef - Abdelhalim, A. Az. J. of Pharma. Sci. 2015, 52, 233-247.
CrossRef - El-Waey, A. A.; Abdel-Salam, R. A.; Hadad, G. M.; El-Gindy, A.. Microchemical journal 2023,186, 108324.
CrossRef - Saroja, J.; Lakshmi, P.V.A.; Rammohan, Y.; Divya, D.; Kumar, P.S. Rasayan J. of Chemistry 2018, 11(3),1058-1066.
CrossRef - Saeed, N.; Afridi, M.S.K.; Latif, A.; Fahham, H.H.; Aslam, I.; Mazhar, M.; Afridi, M.S.K. J. of Chemistry 2022, 65(2), 81-91.
- Ezzeldin, E.; Abo-Talib, N. F.; Tammam, M. H.; Y. A.; Asiri, Amr, A. E.; Almehizia, A. A. Molecules 2020, 25(20), 4611.
CrossRef - Kumari, K.P.; Sankar, D.G. J. of Bioanalysis & Biomedicine 2019, 11(1),136-141.
CrossRef - Moustapha, M.E.; El-Gamal, R.M.; Belal, F.F. BMC Chem. 2019,13(1), 118-133.
CrossRef - Susmita,A. G.; Rajitha, G. Inter. J. of Pharma. Sci. and Research 2018, 9(11), 4 764-4769.
- Azab, S.M.; Fekry, A.M. RSC Advances 2017, 7(2), 1118-1126.
CrossRef - Mohamed, S.H.; Issa, Y.M.; El-Ansary, A.L.; Mahmoud, A.I. Egypt. J. Chem. 66(3) (2023) 449 – 457.
CrossRef - Mohamed, S.H., Issa, Y.M.; Salim, A.I. Spectrochimica Acta A: Molecular and Biomolecular Spectroscopy 2019, 210, 290-297 .
CrossRef - Eissa, M.S.; A.S; Fayed, M.A ; Hegazy, Kamel, E.B. Research J. of Pharmacy and Technology. 2020, 13(12), 5939-5946.
CrossRef - Almahri, A.; Abdel-Lateef, M.A. Luminescence 2021, 36(6), 1544-1552.
CrossRef - Keyvan, K.; Sohrabi, M.R.; Motiee, F. Spectrochimica Acta A 2021, 251, 119429.
CrossRef - I.A.; Darwish, S.A.; Hussein, A.M.; Mahmoud, Hassan, A.I. Spectrochimica Acta A. 2008, 69, 33-40.
CrossRef - Basavaiah, K.; Nagegowda, P.; Somashekar, B.C.; Ramakrishna, V. Science Asia 2006, 32, 403-409.
CrossRef - Badulla, W.F.S.; Bamahmood, E.S.O.; Al-Maqdia, D.H. Indonesian J. of Chem. Sci. 2022, 11(3), 259-265.
- Raghu, M.S.; Basavaiah, K.; Prashanth, K.N.; Vinay, K.B. Inter. J. of Anal. Chem. 2013, Article ID 697651.
- Omara, H.A. Trends in Anal. Chem. Letters 2017, 7(1), 65-75.
CrossRef - M.; Nebsen, Elzanfaly, E. S. J.of Chroma Sci. 2016, 54(9), 1631–1640.
CrossRef - Huang, Y.; Su, B-N.; Marshall, J.; Miller, S. A. J. of Pharma. Sci. 2019 108(10), 3312-3318.
CrossRef
Second Review by: Dr. Gihan Dissanayake
Final Approval by: Dr. Dinesh Chand Sharma


![]()


