An RSM Modeling and Optimization: Utilizing Zn Nanoparticles For 2,4-D Photocatalytic Degradation in Water
Rakshitha Rajashekara , Aleakudiyi Baburajan Ardra Raj and Pallavi Nagaraju*
Department of Environmental Science, School of Life Sciences, JSS Academy of Higher Education and Research, Mysuru-570015, India.
Corresponding Author E-mail: anupallavi@jssuni.edu.in
DOI : http://dx.doi.org/10.13005/ojc/400228
Article Received on : 07 Mar 2024
Article Accepted on :
Article Published : 17 Apr 2024
Reviewed by: Dr. Vikas Sawant
Second Review by: Dr. Junfeng Kou
Final Approval by: Dr. Ioana Stanciu
Groundwater is the only source of clean water for human use in much of the world, but contaminants from the home, business, and agriculture—such as fertilizers and pesticides—can quickly contaminate it. The main objective of the current work was to investigate the photocatalytic removal of the herbicide 2,4-Dichlorophenoxyacetic acid (2,4-D) from an aqueous medium utilizing environmentally friendly zinc oxide nanoparticles. One of the main areas of research has been the possible use of zinc oxide (ZnO) nanoparticles in antifungal, antibacterial, and optical applications. Due to their unique qualities, the well-known nanoparticles utilized in nanotechnology and nanoscience have a wide range of practical applications in the chemical, pharmaceutical, medical, and rural sectors. These particles are used to degrade contaminants during synthetic production. Due to the availability of dangerous synthetic compounds and the outrageous climatic openness in these nanoparticles' physical and substance growth, eco-friendly approaches to utilizing plants have been established. The study includes a brief history of the production of zinc oxide nanoparticles and their application in the pollutant 2,4 D degrading process. This study highlights the use of neem extract in the manufacture of zinc oxide nanoparticles and their application in the removal of contaminants.
KEYWORDS:2,4-Dichlorophenoxyacetic acid; Green synthesis; Neem extract; Nanoparticles; Pollutant degradation; Response surface modelling; Zinc oxide nanoparticles
Download this article as:| Copy the following to cite this article: Rajashekara R, Raj A. B. A, Nagaraju P. An RSM Modeling and Optimization: Utilizing Zn Nanoparticles For 2,4-D Photocatalytic Degradation in Water. Orient J Chem 2024;40(2). |
| Copy the following to cite this URL: Rajashekara R, Raj A. B. A, Nagaraju P. An RSM Modeling and Optimization: Utilizing Zn Nanoparticles For 2,4-D Photocatalytic Degradation in Water. Orient J Chem 2024;40(2). Available from: https://bit.ly/3xCL989 |
Introduction
One of the main obstacles to human existence and societal advancement is the lack of freshwater 1,2. According to1, Merely 1% of the global water reserves may be utilized directly. Sadly, about 40% of the world’s population already resides in dry or semiarid areas, and by 2025, that percentage is projected to reach nearly two-thirds1. Concurrently, one of the most urgent concerns of this age has evolved as a result of the rapid onset of industrialization, rising pollution levels, and ecological deterioration 3-6. Pharmaceutically active compounds (PACs) can affect aquatic and terrestrial life at trace amounts of just a few mg/L to ng/L 7,8. In particular, phenols and phenolics are extensively used in the manufacturing and processing sectors. Phenolics can disrupt the endocrine system and act as a carcinogen, both of which have detrimental impacts on human health. 9-11. The current work emphasizes 2,4-Dichlorophenoxyacetic acid (2,4 D), a colorless chlorinated phenol with a molecular weight of 221.03 g/mol and a molecular formula of C8H6Cl2O3, which is toxic to living organisms and has a higher boiling point, low volatility, and low drift. 12,13. There are several physical, chemical, biological, and combination methods for the degradation and mineralization of Persistent organic pollutants (POPs). Coagulation-flocculation and biological therapies are examples of traditional POP treatments that only fixate on POPs rather than remove them 14-16. According to[17], The drawbacks of each of these systems include high operational expenses, slow reaction times, restricted mobility, and secondary pollution. Therefore, new techniques for the breakdown of compounds containing chlorophenol are required. The advanced oxidation strategy has been proposed as a successful treatment approach for these POPs, notwithstanding some limitations. 17,18. Several potent reactive oxygen species (ROSs), notably hydroxyl radicals (OH), are produced throughout the process. The process generates hydroxyl radicals (OH), which are particularly potent reactive oxygen species (ROSs) that facilitate the elimination and mineralization of organic species with stable chemical structures. 19-21.
Recently, nanoscience and nanotechnology have been used in several fields, such as medicine, pharmaceuticals, the environment, and others. Thus, a range of methods was employed to produce nanomaterials, including hydrothermal, sol-gel, precipitation, sonochemistry, and solid-state22. It is a desirable alternative to traditional physical and material processes since it is cheap, ecologically benign, and environmentally sustainable. Nanoparticles with a broad range and no contamination may be produced quickly and effectively by plant-interceded synthesis23. Plants are very tempting sources for further alterations during drug development because of their pharmacological capabilities, which include antibacterial, anticancer, and antagonistic to diabetic activities. The application of a chemical known as a capping agent prevents the molecule from evolving further and keeps it in the nano-range. Depending on the plant content, biomolecules may be particularly good at lowering, or comparable atoms might function as both a reducing and a capping agent24. The suggested photocatalytic degradation has been developed using zinc oxide, which has much higher photocatalytic activity than conventional titanium dioxide (TiO2) under visible light25.
The application of response surface methodology (RSM) dates back to Box and Wilson’s 1951 research26, and is a statistical approach for improving processes like photocatalysis in addition to the usage of nanocatalysts. The effects of certain experimental circumstances may be predicted, and connections between them can be found, using RSM approaches. To create new processes, alter designs, and improve their performances, RSM has historically been a powerful design experiment technique 10,27. It is acknowledged as the most trustworthy empirical-statistical approach and a practical plan for methodically altering every variable to determine how effective photocatalytic degradation is. Even in increasingly complicated systems, RSM can evaluate the relative importance of different process factors using math and statistics 10,28. RSM shows the strong relationship between several parameters by methodically changing every component while requiring the fewest tests possible in an experiment that is carefully planned for the right process circumstances. 10. According to 26, RSM may be used to estimate the linear, interactional, and quadratic effects of the components and to create a prediction model for the response. Zinc oxide is a typical nanoparticle with excellent photostability, a significant depth of light penetration, and considerable sensitivity to visible light. Due to these unique characteristics, ZnO exhibits significant potential applications as an electroactive material and visible-light photocatalyst.
In the current study, a prediction model for 2,4-D degradation is created using RSM and is based on independent essential factors such as 2,4-D concentration, ZnO dose, and contact time. The coprecipitation method is used to create ZnO nanoparticles, which are then thoroughly investigated to show all of the significant physicochemical and photocatalytic features. The proposed degradation process would help the research move further.
Materials and methods
Materials
From the JSS Academy of Higher Education and Research in Mysuru, India, neem (Azadirachta Indica) leaves were gathered. The leaves were repeatedly washed with distilled water that had been sterilized to remove impurities, after which they were chopped into small pieces and left to air dry. Every chemical and reagent used was of analytical grade and didn’t need to be purified. Zinc acetate dihydrate (Zn (CH 3COO)2 · 2H2O), sodium hydroxide (NaOH), ethanol, and 2,4 dichlorophenoxy acetic acid (C8H6Cl2O3) herbicide were acquired from JSS AHER, Mysuru, India. And the aqueous solutions were made using double-distilled water.
Zinc oxide nanoparticle synthesis
To begin the synthesis, neem extract was made by combining 50 g of fresh leaves with 200 ml of double-distilled water in a 500 ml glass beaker and stirring the mixture at 60 °C for two hours until the aqueous solution became brown. After the extract had cooled to room temperature, it was filtered using Whatman filter paper. It was maintained in a refrigerator so that it might be used in forthcoming investigations.
Neem leaf extract and 1M zinc acetate dihydrate were mixed in 50 ml for the production of zinc oxide in a 50:50 ratio. By adding 0.5 M sodium hydroxide to the solution dropwise while it was still at room temperature, the pH of the solution was kept at 7.0, which caused a precipitate to form. A magnetic stirrer was used to continuously swirl the mixture. The precipitate was repeatedly washed with water and ethanol to remove impurities. After being crushed to a fine powder, the material was dried overnight at 60° C in an oven and calcined for one hour at 4000C in a muffle furnace with an air atmosphere.
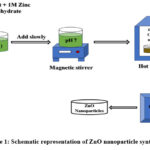 |
Figure 1: Schematic representation of ZnO nanoparticle synthesis. |
Characterization of Zinc oxide nanoparticles
In the realm of nanotechnology, the adaptable X-ray diffraction (XRD) technique is often used to characterize and collect accurate data on the chemical composition, nanoparticle crystal structure, and crystalline grain dimension. To capture the crystallographic data, the Cu K-radiation helped the diffractive angular measurements between 10° and 80° at a scan rate of 2° per minute. Another method for determining the shape, texture, and size of particles is scanning electron microscopy (SEM), which only allows milligram amounts of material to be employed. A small electron beam travels across the prepared sample in a series of parallel lines during an SEM scan. EDS could potentially be used to identify and determine the relative abundance of the chemical elements that are present in a sample. EDS may also be used to evaluate various alloys and gauge the thickness of multi-layer metallic coverings. The microscopic structure and surface composition of the NPs examined were looked at using energy-dispersive X-ray spectroscopy (EDS) and scanning electron microscopy (SEM). UV-Vis spectroscopy was used to examine the optical characteristics. The absorbance of the substance is examined as a function of wavelength using UV-visible absorbance spectroscopy, a method for characterizing materials. The following qualities distinguish UV spectroscopy from other types of spectroscopies: UV has a lower detection threshold and a higher sensitivity in its absorption spectrum. As a result, it is often employed in the quantitative analysis of carbonyl and conjugated diolefin compounds. Compressed pellets created by combining powders and potassium bromide underwent an FTIR investigation. An infrared absorption spectrum can be produced using Fourier Transform Infrared Spectroscopy (FTIR), which can be used to identify a molecule’s chemical bonds. The spectra offer a sample profile or particular substance fingerprint recognition that may be used to examine and screen samples for various constituents.
Evaluation of the 2,4 D photocatalytic degradation process
By comparing the photodegradation of 2,4-D under 18W LED light sources and sunlight, the photocatalytic capacity of the ZnO NPs was evaluated. ZnO NPs at concentrations of 10, 25, and 40 ppm were added to three separate containers containing 5, 10, and 15 mg of ZnO NPs, which led to the photocatalytic annihilation 2,4-D. After being mixed for half an hour in the daylight, the mixture was stored in a dark place without access to light. The final products were continuously stirred and exposed to direct sunlight for a certain amount of time. The same procedure was followed for LED light sources. Absorbance was taken at the wavelength of 285 nm at different time intervals using UV-Vis spectroscopy.
Table 1: Experimental ranges of independent variables of the RSM experiment
|
Level |
Factors |
Unit |
Lower limit |
Upper limit |
|
1 |
Pollutant concentration |
ppm |
10 |
40 |
|
2 |
Catalyst dosage |
mg |
15 |
5 |
|
3 |
Contact time |
minutes |
180 |
30 |
The degradation of 2,4-D under LED and natural light conditions was used to assess the photocatalytic potential of ZnO NPs. Different doses (5 mg, 10 mg, and 15 mg), times (30, 105, and 180 minutes), and starting concentrations (10, 25, and 40 ppm) are used to analyze the UV-vis spectra of 2,4-D photodegradation.
Each photocatalytic test was carried out as the RSM program advised. To achieve an adsorption/desorption equilibrium state, Both the solution and the catalyst were initially agitated by a magnetic stirrer for about 30 minutes at room temperature and in complete darkness. The combination was thereafter exposed to experimental settings determined by JMP software and exposed to both 18-watt LED light and sunlight. After being exposed to light, using filter paper, the suspension was filtered, and a UV-Vis Spectrophotometer with a peak wavelength of 285 nm was used to measure the filtrate’s absorbance. To calculate the 2,4 D’s rate of degradation, the solution’s absorbance at both its starting (Co) and the final (Ct) concentrations was measured. The method for this calculation is given below in Equation (1). 29.

Experimental design by RSM method
Box and Wilson developed the Response Surface Methodology (RSM), a set of statistical and mathematical methods for examining situations similar to the one under study using an empirical model. More specifically, its goals are, to produce knowledge in the relevant experimental field. Regression analysis is carried out for the entire set of data using the Response Surface Methodology (RSM), a statistical approach. RSM is one of the techniques that have been programmed in that software, which is a tool that aids in the design of experiments and the analysis of data. It might foretell the relationship or interaction between the values of a collection of experimental variables thought to have an impact on the response and those of a measurable response variable. Predict response values under different process conditions. The design of Experiment (DoE) is the most important element of RSM. DoE aims to choose the most pertinent topics for in-depth analysis of the response. The design of experiments is mostly tied to the mathematical model of the process. For the design, we considered three factors; pollutant concentration, catalyst dose, as well as time.
Response Surface Methodology (RSM), a method for assessing the effects of interrelated elements and enhancing the photocatalytic 2,4 D degradation by ZnO NPs, was utilized to construct the experimental section together with the (DOE) JMP Pro 15 program. To understand their interactions and effects regarding the pollutant’s photocatalytic degradation by zinc nanoparticles, the three primary independent variables or parameters, Pollutant concentration (X1), Catalyst dose (X2), and Contact time (X3) were included. Using the aforementioned software, about 9 distinct experimental trials were created, as indicated in Table.2 below. Additionally, The independent variables and their corresponding ranges that are crucial for the response’s optimization are shown in Table 1.
Table 2: Experimental trials, produced by the RSM technique using customized designs
|
Trial No. |
Concentration (ppm) |
Dosage (mg) |
Time (minutes) |
|
1 |
10 |
5 |
180 |
|
2 |
10 |
10 |
30 |
|
3 |
25 |
10 |
105 |
|
4 |
10 |
10 |
180 |
|
5 |
40 |
15 |
180 |
|
6 |
25 |
15 |
105 |
|
7 |
25 |
5 |
30 |
|
8 |
40 |
10 |
180 |
|
9 |
25 |
5 |
180 |
Result and discussion
Characterization of ZnO
X-ray diffraction (XRD) patterns were acquired using an X-ray diffractometer to examine the crystallographic structure of the nanoparticle. The well-defined peaks with small breadth supported the ZnO NPs’ excellent crystalline nature. The substance is crystal if the XRD pattern shows sharp peaking. In Fig.2, we can detect distinct peaks, which show the substance’s crystallinity. The existence of crystalline hexagonal wurtzite ZnO nanoparticles with average crystallite sizes between 30 and 36 nm and variable reaction durations was confirmed by the XRD pattern. The same has been cited in the earlier literature 30.
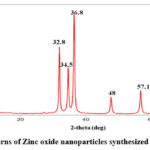 |
Figure 2: XRD patterns of Zinc oxide nanoparticles synthesized using neem extract |
Fourier transform infrared spectra were captured using an FT-IR spectrometer (FTIR- 4100 type A). Using the FTIR profile, the primary ZnO NPs’ group functions were examined. Fig.5 depicts the transmittance vs. wavenumber graph from the FTIR analysis of ZnO NPs. The peaks represent the functional groups that are typical of the synthesized zinc oxide nanoparticles. The samples’ absorption peaks are predicted to be between 3533.59 cm-1 and 3321.42 cm-1, 1178.71 cm-1, 1045.42 cm-1, and 410.84 cm-1. Usually, the stretching mode of metal-oxygen (M-O) is held responsible for peaks between 400 and 600 cm-1. Peaks around 437-455 cm-1 are thought to include information on the Zn-O stretching vibration of crystalline hexagonal zinc oxide30.
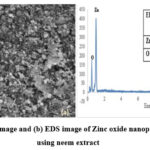 |
Figure 3: (a) FE-SEM image and (b) EDS image of Zinc oxide nanoparticles synthesized using neem extract |
The morphological structures were determined using field emission scanning electron microscopy (FE-SEM). Fig.3(a) clearly shows that the ZnO NPs contain aggregates and a texture like flowers. The use of other plant extracts, including Juglans regia L. leaves, has been documented in the literature for a similar type of similarly shaped materials 31. The polarization, electrostatic attraction, and high energy at the surface of NPs made of ZnO may have contributed to aggregate formation. Additionally, As we noted in our previous study, the interaction between the nanoparticles and MCE biomolecules has a mechanistic role in aggregation formation. Researchers recently revealed another discovery that is similar to the prior one. They determined the function of the reducing and capping action and the creation of aggregates.
The combination of qualitative as well as quantitative information regarding the photocatalyst was estimated using EDS analysis. In keeping with the EDS findings, as a result, the MCE’s phenolics assisted in the creation of nanoparticles and created extremely pure, crystalline ZnO NPs free of amorphous impurities. EDS analysis was used to examine the ZnO NPs’ component-wise profile, which is shown in Fig.3(b). Only the Zn and O element signals were seen in the spectrum, proving the purity of the ZnO NPs. The hexagonal type of wurtzite ZnO NPs’ atomic ratio of Zn (45.33%) and O (54.67%) was compatible with previously published data32,33. Fig.3(b) demonstrates that Zn’s weight percentage is 77.21 and O’s is 22.79. Here we can see a higher proportion of zinc and the rest is oxygen. It assures the purity of zinc oxide nanoparticles synthesized by the process.
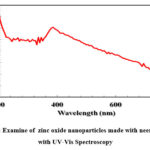 |
Figure 4: Examine of zinc oxide nanoparticles made with neem extract with UV-Vis Spectroscopy |
The band energy was calculated using an (Orion AquaMate 8000) UV-visible spectrophotometer. In addition to an eye examination, the analysis involving the ZnO NP suspension’s UV-vis spectrum Fig.4 provided further evidence of the ZnO NPs’ production. The existence of a prominent absorption peak (λ=199 nm) confirmed that ZnO NPs formed as a result of surface plasmon resonance. This unusual peak could be caused by electrons moving from the valence band to the conduction band. The conventional indications of ZnO NPs’ wurtzite structure may be attributed to these peaks seen in the Raman spectrum Fig.4. The current study’s bandgap energy is consistent with the values published for the environmentally conscious development of ZnO NPs. As a consequence, the wurtzite structure and crystallinity of ZnO NPs, which are congruent with XRD results, are confirmed by the Raman spectroscopic measurements.
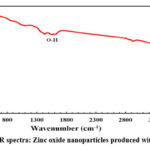 |
Figure 5: FTIR spectra: Zinc oxide nanoparticles produced with neem extract |
Response surface modeling in the deterioration of 2,4 D
Response Surface Methodology analysis was done for each of the nine trials, they were collected taking into account the four distinct independent variables to optimize the response factor (pollutant degradation). The starting values for the designated 2,4 D, catalyst dosage, concentration, and time spent in contact are X1, X2, and X3, respectively. For every trial that was run, the amount of 2,4 D that was photo-catalytically degraded was determined. The research conducted indicates that, In the figure.8 below, the connection between actually occurring deterioration and anticipated degradation is depicted and is used to determine if the model that has been used is important or inconsequential for the degradation of pollutants. The R2 value for the photodegradation of 2,4 D is 0.99602. Additionally, the root means square error and P-value are 2.4191 and 0.0119, respectively. The R2 value for the photodegradation of 2,4 D under sunlight is 0.99603. Additionally, the root means square error and P-value are 2.4682 and0.0119, correspondingly, Fig.6.
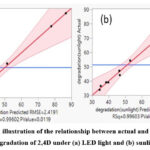 |
Figure 6: An illustration of the relationship between actual and anticipated degradation of 2,4D under (a) LED light and (b) sunlight |
Fig. 7 (p-value and Log Worth) shows the importance of each model parameter. The p-values are modified to bring about a more appropriate scale for charting, and this change is referred to as the Log-Worth. A p-value of less than 0.01 often means there is significant evidence to support the null hypothesis. The two-equivalent -log10(0.01) value is shown by the reference blue line. Based on the graph a Log Worth of 2.490 and a P-value of 0.00324 and a Log Worth of 2.478 and a P-value of 0.00333 were found for both experiments.
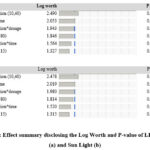 |
Figure 7: Effect summary disclosing the Log Worth and P-value of LED Light (a) and Sun Light (b) |
Fig. 8(a) and (b) present plots of the residuals against the predicted values and the number of rows, respectively. Additionally, the picture demonstrates that there is no obvious pattern or odd structure to them. The depiction of equal scatters along the x-axis further demonstrates the suitability of the suggested model. The line fit is thought to be more accurate since most of the data points align to create a straight line and because a large number of data points contain no residual values.
While the constant variance plot of residuals vs. predicted values was used to evaluate acceptability, Fig. 8(b) shows how to employ lurking factors that may impact the response throughout the experimental activity.
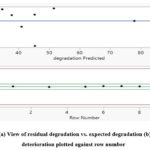 |
Figure 8: (a) View of residual degradation vs. expected degradation (b) residual deterioration plotted against row number |
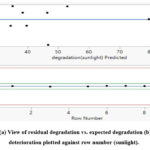 |
Figure 9: (a) View of residual degradation vs. expected degradation (b) residual deterioration plotted against row number (sunlight). |
Table 3: ANOVA of LED light
|
Source |
DF |
Sum of Squares |
Mean square |
F Ratio |
|
Model |
3 |
2015.4157 |
671.805 |
3.6352 |
|
Error |
5 |
924.0257 |
184.805 |
Prob>F |
|
C.Total |
8 |
2939.4414 |
|
0.0993 |
Table 4: ANOVA of sunlight
|
Source |
DF |
Sum of Squares |
Mean square |
F Ratio |
|
Model |
3 |
2119.5647 |
706.522 |
3.7251 |
|
Error |
5 |
948.3278 |
189.666 |
Prob>F |
|
C.Total |
8 |
3067.8925 |
|
0.0954 |
The dependability of the developed model’s predicted findings was confirmed using an ANOVA-based study. ANOVA (analysis of variance) is used to determine the F ratio, p-value, mean square, sum of squares, degrees of freedom (DF), and so forth. The findings are compiled in Tables 3 and 4 for both artificial light sources and sunlight. The sum of the squares from every single one of the various sources is divided by the relevant degrees of freedom for the model and the error variance to produce the mean square values34. The model is further tested in terms of F-value and p-value to confirm its significance. In statistics, a significant model has a high F-value (3.6352,3.7251) and a small p-value (0.0993,0.0954). Additionally, the model’s fit is confirmed by the coefficient of determination (R2). R2=0.99602 and 0.99603 are the values of the coefficient of determination for both artificial light source and sunlight from this investigation. The model is appropriate for the current inquiry since the regression coefficient is near to one and shows that there aren’t many differences between experimental and expected results.
Independent experimental factors affect the degradation of pollutants
JMP was used to create a three-dimensional response surface map to better understand how the independent experimental variable had an impact on 2,4 D’s degradation. In this investigation, the pollutant concentration (10 ppm) was at the medium concurrently with the catalyst dose (10 mg) and contact duration (3 hours) being at a maximum range, and the highest 2,4 D degradation (88.34) was found under sunlight. The degradation of the 2,4 D was about 88.34% when the catalyst dosage was 10 mg, the pollutant concentration was 10 ppm, and the contact duration was at its greatest values. The data showed that the findings were displayed as a function of two components and that the associations across each of the factors were worthwhile. The molecules of the photocatalyst and pollutant undergo significant changes in surface charge during this process. The 3D response surface plots are shown in Figures 10, 11, and 12 below.
The findings were shown about two different factors. The effects of pollutant concentration vs. time are shown in Fig.10. Here, we can observe how the graph grows as it approaches the appropriate levels. Fig.10 illustrates how the 2,4 D degradation percentage is significantly impacted by contact time with pollutant concentration. At a medium pollution concentration and longer contact times, the pollutant removal rate was astounding.
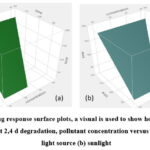 |
Figure 10: Using response surface plots, a visual is used to show how experimental conditions affect 2,4 d degradation, pollutant concentration versus time(a) artificial light source (b) sunlight |
Where the greatest catalytic degradation occurs at 10 mg of catalytic dose, 10 ppm of pollutant, and its maximum contact time. Fig. 10 and 11 imply that the pollutant degradation is significantly influenced by the contact time. Fig. 11 shows a graph that displays catalytic dosage against time. 2,4 D degradation is reaching its maximal degradation point at a catalytic dose of 10 mg and maximum contact duration.
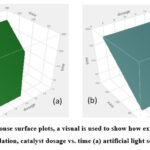 |
Figure 11: Using response surface plots, a visual is used to show how experimental conditions affect 2,4 d degradation, catalyst dosage vs. time (a) artificial light source (b) sunlight |
Fig.12 illustrates how the 2,4-D degradation percentage is significantly impacted by the interaction between catalyst dose and pollutant concentration. The concentration of the pollutant and the amount of the catalyst are the two predominant variables affecting the degradation process. Here, the degradation reaches its climax at the medium catalytic dose and the lowest pollutant concentration.
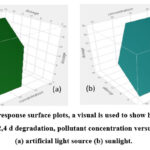 |
Figure 12: Using response surface plots, a visual is used to show how experimental conditions affect 2,4 d degradation, pollutant concentration versus catalyst dosage (a) artificial light source (b) sunlight. |
Stability and reusability of the produced catalyst
Stability and reusability are critical for long-term use, and the cyclic mode of ZnO nanoparticles was employed to test them for both. Regarding this, the reusability of ZnO was tested using three distinct cycles with a catalyst dose of 10 mg and a pollutant concentration of 10 PPM. In preparation for the upcoming cycle, the catalyst was removed, cleaned, and oven-dried. Three consecutive cycles of the repeatability test are shown in Fig. 13. 2,4 D deterioration had dropped by nearly 18.1% from the beginning of the third cycle to the end. This might be the outcome of a subsequent cycle that reduces the catalyst’s active surface sites. The effectiveness of ZnO photocatalysts used for eliminating different contaminants is also shown in Table 5. It is a promising catalyst when contrasted with earlier work.
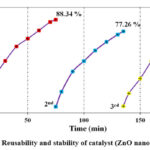 |
Figure 13: Reusability and stability of catalyst (ZnO nanoparticles). |
Table 5: Comparison of ZnO-based photocatalytic system
|
Photocatalyst |
Synthesis |
Target |
Efficiency (%) |
Reference |
|
Tungsten-doped zinc oxide nanoparticles |
hydrothermal method |
2,4-Dichlorophenoxyacetic acid |
78% |
35 |
|
Ag-ZnO |
Sol-gel method |
Rhodamine 6G (R6G) |
86% |
36 |
|
ZnO |
Hydrothermal |
detoxification of anionic azo dyes and antibiotic |
100% |
37 |
|
ZnO |
sol–gel |
Azo Dyes |
99.70% |
38 |
|
ZnO |
solvothermal |
RR141 dye and OFL antibiotic |
100 % and 98 % |
39 |
2,4-D’s proposed photocatalytic degradation pathway onto ZnO nanoparticles in the presence of sunlight
Under the influence of sunlight and the ZnO catalyst, the 2.4-D goes through a systematic breakdown. After absorbing the appropriate photons (energy > Eg of ZnO), the catalyst typically undergoes photoactivation. Zinc oxide (ZnO) conduction and valence bands undergo redox processes that act on 2,4-D to break it down and finally form simple organic molecules like carbon dioxide and water. These processes result in the production of reactive oxidants. The photodegradation of 2,4-D using ZnO is schematically shown in Figure 14. Dehalogenation and ring fragmentation are other potential pathways for degradation, which together produce several intermediates before ultimately producing water and carbon dioxide[40].
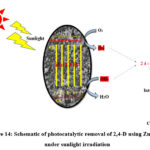 |
Figure 14: Schematic of photocatalytic removal of 2,4-D using ZnO NPs under sunlight irradiation |
Conclusion
In summary, zinc nanoparticles were made using the co-precipitation technique using neem extract, and they showed exceptional photocatalytic degradation of 2,4 D with 88.34% degradation at 10 ppm pollutant concentration, 10 mg of catalyst dose, and 3 hours of contact time under sunlight. The outcome demonstrates that photodegradation under direct sunlight is more effective than photodegradation using a light source. Additionally, the optimized procedure was made more effective and rigorous scientifically by the RSM. The R2 and the P values agreed with the outcomes of laboratory experiments and the RSM tool. For the photodegradation of 2,4 D under LED, the R2 value is 0.99602 and the P-value is 0.0119 and the photodegradation of 2,4 D in sunlight has an R2 value of 0.99603 and P-value 0.0119, respectively. The RSM model’s response surface plots clarified the importance of the individual factors including the amount of the catalyst used, the pollutant concentration, and the length of the contact time. The outcomes show the efficacy of RSM as an excellent tool for enhancing operating settings and an inexpensive approach for improving experimentation. The current investigation gave consent for the use of ZnO nanoparticles in the degradation of 2,4 D.
Acknowledgments
R Rakshitha and A B. Ardra Raj acknowledge the JSS Academy of Higher Education and Research, Mysuru, provided a laboratory facility to the authors.
Conflicts of interest
We have no conflicts of interest to disclose.
References
- D. Hao, Y. Yang, B. Xu, and Z. Cai, “Bifunctional Fabric with Photothermal Effect and Photocatalysis for Highly Efficient Clean Water Generation Bifunctional Fabric with Photothermal Effect and Photocatalysis for Highly Efficient Clean Water Generation,” ACS publications, pp. 1–31, 2018, doi: 10.1021/acssuschemeng.8b02094.
CrossRef - F. Ming, J. Hong, X. Xu, and Z. Wang, “Dandelion-like ZnS/carbon quantum dots hybrid materials with enhanced photocatalytic activity toward organic pollutants,” RSC Adv., vol. 6, no. 37, pp. 31551–31558, 2016, doi: 10.1039/C6RA02840C.
CrossRef - Y. Lin, C. Yang, S. Wu, X. Li, Y. Chen, and W. L. Yang, “Construction of Built-In Electric Field within Silver Phosphate Photocatalyst for Enhanced Removal of Recalcitrant Organic Pollutants,” Advanced Functional Materials, vol. 2002918, pp. 1–13, 2020, doi: 10.1002/adfm.202002918.
CrossRef - C. Liu, Y. Min, A. Zhang, Y. Si, J. Chen, and H. Yu, “Electrochemical treatment of phenol-containing wastewater by facet- tailored TiO 2 : Efficiency , characteristics and mechanisms,” Water Research, vol. 165, p. 114980, 2019, doi: 10.1016/j.watres.2019.114980.
CrossRef - V. Mahmoodi, T. R. Bastami, and A. Ahmadpour, “Solar energy harvesting by magnetic-semiconductor nanoheterostructure in water treatment technology,” Environmental Science and Pollution Research, vol. 25, no. 9, pp. 8268–8285, 2018, doi: 10.1007/s11356-018-1224-y.
CrossRef - E. Omrani, A. Ahmadpour, M. Heravi, and T. R. Bastami, “Novel ZnTi LDH/h-BN nanocomposites for removal of two different organic contaminants: Simultaneous visible light photodegradation of Amaranth and Diazepam,” Journal of Water Process Engineering, vol. 47, no. November 2021, p. 102581, 2022, doi: 10.1016/j.jwpe.2022.102581.
CrossRef - N. Nakada et al., “Removal of selected pharmaceuticals and personal care products (PPCPs) and endocrine-disrupting chemicals (EDCs) during sand filtration and ozonation at a municipal sewage treatment plant,” Water Research, vol. 41, no. 19, pp. 4373–4382, 2007, doi: 10.1016/j.watres.2007.06.038.
CrossRef - K. A. Kidd et al., “Collapse of a fish population after exposure to a synthetic estrogen,” Proceedings of the National Academy of Sciences of the United States of America, vol. 104, no. 21, pp. 8897–8901, 2007, doi: 10.1073/pnas.0609568104.
CrossRef - Adeem Ghaffar Rana and Mirjana Minceva, “Analysis of Photocatalytic Degradation of Phenol with Exfoliated Graphitic Carbon Nitride and Light-Emitting Diodes Using Response Surface Methodology,” Catalysts, vol. 11, no. 898, pp. 2–15, 2021, doi: 10.3390/catal11080898.
CrossRef - M. Zulfiqar, M. F. R. Samsudin, and S. Sufian, “Modelling and optimization of photocatalytic degradation of phenol via TiO2 nanoparticles: An insight into response surface methodology and artificial neural network,” Journal of Photochemistry and Photobiology A: Chemistry, vol. 384, no. May, p. 112039, 2019, doi: 10.1016/j.jphotochem.2019.112039.
CrossRef - M. Choquette-Labbé, W. A. Shewa, J. A. Lalman, and S. R. Shanmugam, “Photocatalytic degradation of phenol and phenol derivatives using a Nano-TiO2 catalyst: Integrating quantitative and qualitative factors using response surface methodology,” Water (Switzerland), vol. 6, no. 6, pp. 1785–1806, 2014, doi: 10.3390/w6061785.
CrossRef - L. Gnanasekaran et al., “Photocatalytic degradation of 2,4-dichlorophenol using bio-green assisted TiO2–CeO2 nanocomposite system,” Environmental Research, vol. 195, no. December 2020, 2021, doi: 10.1016/j.envres.2021.110852.
CrossRef - Z. Hashemi, Z. M. Mizwari, and S. Mohammadi-aghdam, “Sustainable green synthesis of silver nanoparticles using Sambucus ebulus phenolic extract ( AgNPs @ SEE ) : Optimization and assessment of photocatalytic degradation of methyl orange and their in vitro antibacterial and anticancer activity,” Arabian Journal of Chemistry, vol. 15, no. 1, p. 103525, 2022, doi: 10.1016/j.arabjc.2021.103525.
CrossRef - P. Raizada et al., “Surface defect engineering of metal oxides photocatalyst for energy application and water treatment,” Journal of Materiomics, 2020, doi: 10.1016/j.jmat.2020.10.009.
CrossRef - P. V. A. Padmanabhan et al., “Nano-crystalline titanium dioxide formed by reactive plasma synthesis,” Vacuum, vol. 80, no. 11–12, pp. 1252–1255, 2006, doi 10.1016/j.vacuum.2006.01.054.
CrossRef - R. Eizi, T. R. Bastami, V. Mahmoudi, A. Ayati, and H. Babaei, “Facile ultrasound-assisted synthesis of CuFe-Layered double hydroxides/g-C3N4 nanocomposite for alizarin red S sono-sorption,” Journal of the Taiwan Institute of Chemical Engineers, vol. 145, no. November 2022, p. 104844, 2023, doi: 10.1016/j.jtice.2023.104844.
CrossRef - S. Li, X. Ma, L. Liu, and X. Cao, “Degradation of 2,4-dichlorophenol in wastewater by low-temperature plasma coupled with TiO2 photocatalysis,” RSC Advances, vol. 5, no. 3, pp. 1902–1909, 2015, doi: 10.1039/c4ra10797g.
CrossRef - L. Zhu, B. Chen, S. Tao, and C. T. Chiou, “Interactions of organic contaminants with mineral-adsorbed surfactants,” Environmental Science and Technology, vol. 37, no. 17, pp. 4001–4006, 2003, doi: 10.1021/es026326k.
CrossRef - Z. Heidari et al., “A new insight into catalytic ozonation of sulfasalazine antibiotic by plasma-treated limonite nanostructures: Experimental, modeling and mechanism,” Chemical Engineering Journal, vol. 428, no. July 2021, p. 131230, 2022, doi 10.1016/j.cej.2021.131230.
CrossRef - M. Karaca, M. Kiranşan, S. Karaca, A. Khataee, and A. Karimi, “Sonocatalytic removal of naproxen by synthesized zinc oxide nanoparticles on montmorillonite,” Ultrasonics Sonochemistry, vol. 31, pp. 250–256, 2016, doi: 10.1016/j.ultsonch.2016.01.009.
CrossRef - M. A. Oturan and J. J. Aaron, “Advanced oxidation processes in water/wastewater treatment: Principles and applications. A review,” Critical Reviews in Environmental Science and Technology, vol. 44, no. 23, pp. 2577–2641, 2014, doi: 10.1080/10643389.2013.829765.
CrossRef - M. Ali, Z. Hashemi, M. Mohammadyan, and M. Fakhar, “In vitro cytotoxicity against human cancer cell lines ( MCF-7 and AGS ), antileishmanial and antibacterial activities of green synthesized silver nanoparticles using Scrophularia striata extract,” Surfaces and Interfaces, vol. 23, no. January, p. 100963, 2021, doi: 10.1016/j.surfin.2021.100963.
CrossRef - S. Rani, A. K. Malik, H. Rekhi, and R. Kaur, “A Review for the Analysis of antidepressant, antiepileptic and quinolone type drugs in Pharmaceuticals and Environmental samples,” vol. 8347, no. March 2016, doi: 10.1080/10408347.2016.1141670.
CrossRef - S. A. Anjum, U. Ashraf, I. Khan, M. F. Saleem, and L. C. Wang, “Chromium toxicity induced alterations in growth, photosynthesis, gas exchange attributes and yield formation in maize,” Pakistan Journal of Agricultural Sciences, vol. 53, no. 4, pp. 751–757, 2016, doi: 10.21162/PAKJAS/16.3824.
CrossRef - B. S. Abdulkarim, J. Cuartero, J. Hanson, J. Deschênes, D. Lesniak, and S. Sabri, “Increased risk of locoregional recurrence for women with T1-2N0 triple-negative breast cancer treated with modified radical mastectomy without adjuvant radiation therapy compared with breast-conserving therapy,” Journal of Clinical Oncology, vol. 29, no. 21, pp. 2852–2858, 2011, doi: 10.1200/JCO.2010.33.4714.
CrossRef - M. Sabonian and M. A. Behnajady, “Artificial neural network modeling of Cr(VI) photocatalytic reduction with TiO2-P25 nanoparticles using the results obtained from response surface methodology optimization,” Desalination and Water Treatment, vol. 56, no. 11, pp. 2906–2916, 2015, doi: 10.1080/19443994.2014.963161.
CrossRef - B. K. Körbahti and M. A. Rauf, “Response surface methodology (RSM) analysis of photoinduced decoloration of toludine blue,” Chemical Engineering Journal, vol. 136, no. 1, pp. 25–30, 2008, doi: 10.1016/j.cej.2007.03.007.
CrossRef - S. Ray, J. A. Lalman, and N. Biswas, “Using the Box-Benkhen technique to statistically model phenol photocatalytic degradation by titanium dioxide nanoparticles,” Chemical Engineering Journal, vol. 150, no. 1, pp. 15–24, 2009, doi: 10.1016/j.cej.2008.11.039.
CrossRef - A. Majumdar and A. Pal, “Recent advancements in visible-light-assisted photocatalytic removal of aqueous pharmaceutical pollutants,” Clean Technologies and Environmental Policy, vol. 22, no. 1, pp. 11–42, Jan. 2020, doi: 10.1007/s10098-019-01766-1.
CrossRef - A. Singh, Neelam, and M. Kaushik, “Physicochemical investigations of zinc oxide nanoparticles synthesized from Azadirachta Indica (Neem)leaf extract and their interaction with Calf-Thymus DNA,” Results in Physics, vol. 13, no. February, p. 102168, 2019, doi: 10.1016/j.rinp.2019.102168.
CrossRef - E. Darvishi, D. Kahrizi, and E. Arkan, “Comparison of different properties of zinc oxide nanoparticles synthesized by the green (using Juglans regia L. leaf extract) and chemical methods,” Journal of Molecular Liquids, vol. 286, 2019, doi: 10.1016/j.molliq.2019.04.108.
CrossRef - S. Pai, S. H, T. Varadavenkatesan, R. Vinayagam, and R. Selvaraj, “Photocatalytic zinc oxide nanoparticles synthesis using Peltophorum pterocarpum leaf extract and their characterization,” Optik, vol. 185, pp. 248–255, 2019, doi: 10.1016/j.ijleo.2019.03.101.
CrossRef - M. Pudukudy and Z. Yaakob, “Facile Synthesis of Quasi Spherical ZnO Nanoparticles with Excellent Photocatalytic Activity,” Journal of Cluster Science, vol. 26, no. 4, pp. 1187–1201, 2015, doi: 10.1007/s10876-014-0806-1.
CrossRef - N. N. Desai, V. S. Soraganvi, and V. K. Madabhavi, “Solar photocatalytic degradation of organic contaminants in landfill leachate using TiO2 nanoparticles by RSM and ANN,” Nature Environment and Pollution Technology, vol. 19, no. 2, pp. 651–662, 2020, doi: 10.46488/NEPT.2020.V19I02.019.
CrossRef - Y. Zandsalimi, A. Maleki, B. Shahmoradi, S. Dehestani, R. Rezaee, and G. McKay, “Photocatalytic removal of 2,4-Dichlorophenoxyacetic acid from aqueous solution using tungsten oxide doped zinc oxide nanoparticles immobilized on glass beads,” Environmental Technology (United Kingdom), pp. 1–36, 2020, doi: 10.1080/09593330.2020.1797901.
CrossRef - R. Georgekutty, M. K. Seery, and S. C. Pillai, “A highly efficient Ag-ZnO photocatalyst: Synthesis, properties, and mechanism,” Journal of Physical Chemistry C, vol. 112, no. 35, pp. 13563–13570, 2008, doi: 10.1021/jp802729a.
CrossRef - T. Sansenya et al., “Hydrothermal synthesis of ZnO photocatalyst for detoxification of anionic azo dyes and antibiotic,” Journal of Physics and Chemistry of Solids, vol. 160, no. May 2021, p. 110353, 2022, doi: 10.1016/j.jpcs.2021.110353.
CrossRef - X. Chen, Z. Wu, D. Liu, and Z. Gao, “Preparation of ZnO Photocatalyst for the Efficient and Rapid Photocatalytic Degradation of Azo Dyes,” Nanoscale Research Letters, vol. 12, no. 1, pp. 4–13, 2017, doi: 10.1186/s11671-017-1904-4.
CrossRef - T. Chankhanittha, C. Yenjai, and S. Nanan, “Utilization of formononetin and pinocembrin from stem extract of Dalbergia parviflora as capping agents for preparation of ZnO photocatalysts for degradation of RR141 azo dye and ofloxacin antibiotic,” Catalysis Today, vol. 384–386, no. October 2020, pp. 279–293, 2022, doi: 10.1016/j.cattod.2021.03.002.
CrossRef - R. Rakshitha, B. Gurupadayya, S. H. K. Devi, and N. Pallavi, “Coprecipitation aided synthesis of bimetallic silver tungstate: a response surface simulation of sunlight-driven photocatalytic removal of 2,4-dichlorophenol,” Environmental Science and Pollution Research, pp. 1–21, 2022, doi: 10.1007/s11356-022-20062-y.
CrossRef

This work is licensed under a Creative Commons Attribution 4.0 International License.
About The Author
![]()
A New Edition of Web of Science
Journal Impact Factor
2022: 0.5
Five Year: 0.8
Journal is Indexed in

Cabells Whitelist
![]()


