A Comparative Study of Heavy Metal Toxicity in the Vegetables Using ICP-MS and AAS
Pooja Kumari , Vandana Kachhwaha and Pallavi Mishra*
Department of Chemistry, Jai Narain Vyas University, Jodhpur, Rajasthan India.
Corresponding Author E-mail: pallavianuk@gmail.com
DOI : http://dx.doi.org/10.13005/ojc/400217
Article Received on : 11 Dec 2023
Article Accepted on :
Article Published : 06 Mar 2024
Reviewed by: Dr. Dinesh Rishipathak
Second Review by: Dr. Neeraj Kumar
Final Approval by: Dr. Ioana Stanciu
Our study was conducted between January and September 2023, and aimed to evaluate the presence of toxic heavy metals in vegetables cultivated using effluent and sewage water in Jodhpur city. Eight vegetable samples were obtained from four distinct locations, and the concentrations of seven harmful heavy metals (Cu, Zn, Pb, Cd, Cr, Ni, and Fe) were examined. The initial analysis employed ICP-MS, followed by determining the concentration of heavy metals in the vegetables through atomic absorption spectrometry (AAS). The Heavy Metal Pollution Index (HPI) was computed to assess pollution levels at each site. Comparative analysis of vegetable samples using both ICP-MS and AAS indicated elevated levels of lead, cadmium, and chromium pollution in vegetables from all four sites. Calculations further confirmed the contamination of the sites with toxic heavy metals. The order of metal concentration based on allowable limits was Fe>Cd>Cr>Pb>Ni>Zn>Cu. The overall order of observed heavy metal concentrations site-wise was site 4 > site 3 > site 2 > site 1. Many samples were obtained from local vendors near residential areas and community markets frequented by the public. This highlights a crucial issue of heavy metal toxicity exposure to the general population, emphasizing urgent government action, including essential restrictions and measures, to address this pressing problem.
KEYWORDS:Contamination; Concentration; HPI; Irrigation; Toxic metal ions; Vegetables; Wastewater
Download this article as:| Copy the following to cite this article: Kumari P, Kachhwaha V, Mishra P. A Comparative Study of Heavy Metal Toxicity in the Vegetables Using ICP-MS and AAS. Orient J Chem 2024;40(2). |
| Copy the following to cite this URL: Kumari P, Kachhwaha V, Mishra P. A Comparative Study of Heavy Metal Toxicity in the Vegetables Using ICP-MS and AAS. Orient J Chem 2024;40(2). Available from: https://bit.ly/3Tn9qYd |
Introduction
Vegetables play a vital role in human nutrition, supplying essential micronutrients such as copper (Cu), zinc (Zn), calcium (Ca), iron (Fe), magnesium (Mg), iodine (I), sodium (Na), potassium (K), antioxidants, vitamins, and various bioactive compounds. Given that both cooked and raw foods are commonly consumed, it is imperative to consider the presence of harmful heavy metals in vegetables, as they can pose risks to human health.1-2 Numerous global reports extensively detail the contamination of heavy metals in the food chain, with plants having the capacity to absorb these metals from the soil, resulting in elevated concentrations in their edible parts.3-4 The primary catalyst for heavy metal accumulation in plants is soil pollution caused by human activities like industrialization, urbanization, and natural geological factors.
While certain heavy metals like Cu, Zn, and Ni are beneficial in trace amounts as micronutrients, others such as lead (Pb), mercury (Hg), cadmium (Cd), and arsenic (As) are highly toxic even at low levels, particularly for vulnerable groups like pregnant women and young children5. Cadmium is a notable concern due to its mobility in soil and plants, posing health risks to various organs and increasing the likelihood of certain cancers, including pulmonary adenocarcinoma and prostatic lesions, in addition to compromising the immune system. Elevated blood levels of lead can lead to hypertension, impairments in the skeletal, immune, and endocrine systems, and diminished cognitive abilities in children, affecting renal and cardiac functions in adults.6-7. Vegetables and fruits serve as the primary sources of heavy metal exposure in humans, constituting 90% of metal intake, while the remaining 10% comes from skin contact and inhalation of contaminated dust8-12. Therefore, quantifying the concentration of heavy metals in commonly consumed vegetables and fruits is essential for assessing potential health risks13-16. There have been reports of heavy metal toxicity in the Jodhpur city17-19. However, continuous assessment of toxic metal ions in vegetables is very important for people’s health. Despite the National Green Tribunal (NGT) ban on direct disposal of industrial effluents and their subsequent use for irrigation, many farmers are using polluted water for the irrigation of vegetables and settling them in the local market small shops, and man carts20-21. Given the ongoing use of toxic effluents in the city, and increasing Cancer cases, regular monitoring of heavy metal infiltration in the edibles is crucial including evaluating the health risks linked to heavy metal-infused commonly consumed vegetables.
Methodology
Sample Collection Sites
Our study areas were divided into four sites, namely Salawas, Madhuban Housing Board mandi, Basni phase 1 and 2, Bhadwasia Nallah area, and Sangaria region of Jodhpur City, to ascertain the impact of heavy metal contamination in vegetables irrigated with polluted and untreated wastewater from the sewage and industrial effluents. Eight vegetables, namely, Carrot, radish, tomato, coriander, spinach, radish leaves, mustard leaves, and wild spinach were gathered from various locations and were stored in marked sampling packets.
Preparation of Samples
The samples collected and their preparation are represented in Fig-1, All the collected samples were rinsed with water and dried in the oven Finally, they were ground into a homogeneous fine powder and digested in acids.1 gm of a single sample (fine powder of dried vegetables) was weighed and digested with 15 ml of triacid mixture (70% high purity HNO3,65%HClO4 and 70%H2SO4;5:1:1) in a conical flask. They were thoroughly stirred for 30 minutes on a hot plate at 250°C till a translucent solution was obtained. The digested materials were filtered, and diluted with distilled water and were used for the analysis. For each sample, we preparedblank solutions. Then, these samples were analyzed by ICP-MS22, and later the concentration of all heavy metal ions was measured using AAS.
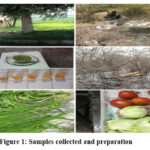 |
Figure 1: Samples collected and preparation |
Results and Discussion
Heavy metals are important in eco-chemistry and eco-toxicology due to their low-level toxicity and tendency to accumulate in human organs. FAO/WHO has published vegetable metal content limits, and these limitations are an essential part of a healthy diet [Table 6]. Heavy metals stay around for a long time and are not chemically degradable. Physical methods are needed for their removal, or they should be changed into nontoxic compounds.
In our research, eight species of vegetables were collected from four different sites. We collected four samples of each vegetable from 4 different sites in different areas in the remote areas of the Blue City and later analyzed them for seven heavy metals. The study was divided into three parts
The samples were analyzed by ICP-Ms and polluted sites were marked.
The samples were assessed by AAS for heavy metal concentration
The heavy metal pollution index was calculated to ascertain site-wise pollution
Analysis by Inductively Coupled Plasma Mass Spectrometry (ICP-MS)
ICP-MS analysis of 32 samples collected from different sites in Jodhpur city was done. The below graph 1-11 shows the ICP-MS analysis.
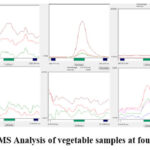 |
Figure 2: ICP-MS Analysis of vegetable samples at four different sites |
Site 1
Bhadvasia area samples were collected from the sabzi mandi shops and farms. The intensities observed are represented in Fig:2 and [Table 1]. The results indicated that the vegetables were least polluted in Site 1 areas.; maximum intensity variations were observed in tomato and radish for Zn metal ions. Site 1 looked the least polluted.
Site 2
Sangaria-Here mainly Jojari river water is used for irrigation. The intensities observed are shown in Fig:2 and [Table 1]. [Table 1]. Most of the vegetable samples were not polluted and did not show much variation in the intensity. However, coriander, spinach, and radish leaves showed high-intensity variation for Pb, as shown in [Table 1], and tomato and radish showed high-intensity variation for Zn metal ion, as represented in. So, site 2 was moderately polluted.
Site 3
Salawas- Here mainly industrial wastewater and Jojari river water is used for irrigation The intensities observed are shown in Fig:2 and [Table 1]. The intensity of Pb, Cr, and Ni showed a remarkable increase, especially in wild spinach and tomato, for Pb metal ions as shown in wild spinach, coriander and wild spinach for Cr metal ions as shown in wild spinach, coriander for Ni metal ion as indicated in Fig 2. Site 3 was very much polluted.
Site 4
Madhuban Housing Board and Basni Phase 1 and 2
This site has mainly local vegetable shops, mandi and farms where vegetables are sold, which are mainly grown with toxic polluted water. Site four showed maximum variation in the intensity for Cd, Cr, and Ni metal ions. Spinach, radish leaves, coriander, tomato, carrot, radish in mustard leaves, and wild spinach for Cd metal ion. Radish leaves for Cr metal ion and tomato radish for Ni metal ion as indicated in Fig:2 and Table 1. The most intensity variation was observed in site 4. Hence, site 4 was more populated than other sites.
Table 1: Observed metal intensity for different vegetable samples at all four sites by ICP-MS
|
Metal |
Cd |
Pb |
Cr |
Ni |
Zn |
||||
|
Vegetable |
|||||||||
|
λmax |
|||||||||
|
|
214.441 |
220.353 |
267.716 |
231.604 |
206.200 |
||||
|
Blank Intensity |
|||||||||
|
|
24 |
534 |
34382 |
1338 |
3533 |
||||
|
Observed Intensity |
|||||||||
|
Tomato |
685* |
1042# |
– |
2349*
|
530450ɸ 1089231Ψ |
||||
|
Coriander |
1537* |
971ɸ |
131140# |
4930# |
– |
||||
|
Wild Spinach |
138* |
1079# |
348676# |
40054# |
– |
||||
|
Radish |
461* |
– |
192969234* |
1986* |
62592ɸ 34452Ψ |
||||
|
Carrot |
677* |
– |
– |
– |
– |
||||
|
Spinach |
4631* |
610ɸ |
– |
– |
– |
||||
|
Mustard leaves |
357* |
– |
1452348* |
2600# |
– |
||||
|
Radish leaves |
3388* |
523ɸ |
92170349* |
– |
– |
||||
Site 4- Intensity*, Site 3- Intensity#, Site 2- Intensityɸ, Site 1- IntensityΨ
The overall order observed for heavy metal concentration by ICP-Ms was – site 4 > site 3> site 2 > site 1.
Based on the above data, we advanced our study and did an AAS analysis for all 32 samples to get an exact amount of heavy metal concentration in ppm.
Analysis by AAS and HPI 23-24
Atomic Absorption Spectroscopy (AAS) was then used to analyse all the samples again. The results of the concentration measurements are given in parts per million (ppm). The results are summarized in Tables 2, 3, 4 and 5.
Table 2: Metal concentration and HPI values for eight different vegetables at site 1
|
S. No. |
Vegetable Name |
Cd |
Cu |
Pb |
Ni |
Cr |
Zn |
Fe |
HPI |
|
1. |
Carrot |
0.033 |
0.1536 |
0.1876 |
0.955 |
0.0026 |
1.4315 |
5.354 |
0.2169 |
|
2. |
Radish |
0.147 |
0.0471 |
1.331 |
0.495 |
0.0041 |
2.583 |
3.462 |
0.2962 |
|
3. |
Tomato |
0.010 |
1.058 |
1.314 |
0.122 |
0.021 |
55.452 |
7.436 |
0.5538 |
|
4. |
Coriander |
0.003 |
0.477 |
1.175 |
0.513 |
0.0043 |
1.753 |
19.59 |
0.2875 |
|
5. |
Spinach |
0.020 |
0.5036 |
1.078 |
0.317 |
0.0049 |
1.5161 |
13.50 |
0.3285 |
|
6. |
Radish leaves |
0.002 |
0.3694 |
1.2459 |
0.587 |
0.0040 |
2.290 |
11.46 |
0.2609 |
|
7. |
Mustard Leaves |
0.006 |
0.384 |
0.9340 |
0.109 |
0.0067 |
1.845 |
6.779 |
0.2227 |
|
8. |
Wild spinach |
0.034 |
0.406 |
1.4163 |
0.7108 |
0.0023 |
2.930 |
7.985 |
0.3653 |
Table 3: Metal concentration and HPI values for 8 different vegetables at site 2
|
S. No. |
Vegetable Name |
Cd |
Cu |
Pb |
Ni |
Cr |
Zn |
Fe |
HPI |
|
1. |
Carrot |
0.073 |
0.199 |
0.5077 |
0.411 |
0.0040 |
2.011 |
4.306 |
0.2774 |
|
2. |
Radish |
0.028 |
0.023 |
0.8325 |
0 |
0.01264 |
4.169 |
2.7743 |
0 |
|
3. |
Tomato |
0.024 |
0.344 |
1.791 |
0.661 |
0.006 |
26.99 |
4.451 |
0.4997 |
|
4. |
Coriander |
0.034 |
0.599 |
1.559 |
0.533 |
0.0055 |
1.717 |
14.031 |
0.4258 |
|
5. |
Spinach |
0.024 |
0.472 |
1.210 |
0 |
0.0064 |
2.625 |
11.363 |
0 |
|
6. |
Radish leaves |
0.028 |
0.344 |
0.840 |
0.341 |
0.0037 |
1.382 |
11.67 |
0.2959 |
|
7. |
Mustard leaves |
0.036 |
0.335 |
1.5159 |
0.252 |
0.00527 |
2.883 |
12.777 |
0.3743 |
|
8. |
Wild spinach |
0.023 |
0.473 |
0.9951 |
1.146 |
0.0043 |
3.184 |
11.756 |
0.4189 |
Table 4: Metal concentration and HPI values for 8 different vegetables at site 3
|
S. No. |
Vegetable Name |
Cd |
Cu |
Pb |
Ni |
Cr |
Zn |
Fe |
HPI |
|
1. |
Carrot |
0.150 |
0.210 |
1.363 |
0.2995 |
0.00511 |
1.628 |
5.5671 |
0.3536 |
|
2. |
Radish |
0.0415 |
0.039 |
0.8214 |
0.2041 |
0.0199 |
5.0239 |
3.6696 |
0.2752 |
|
3. |
Tomato |
0.023 |
0.942 |
1.7346 |
0.486 |
0.032 |
52.859 |
5.637 |
0.7829 |
|
4. |
Coriander |
0.0222 |
0.6974 |
0.9195 |
2.291 |
0.0244 |
2.668 |
27.80 |
0.6729 |
|
5. |
Spinach |
0.051 |
0.460 |
0.5851 |
0.3677 |
0.0086 |
3.137 |
11.709 |
0.4058 |
|
6. |
Radish leaves |
0.027 |
0.3595 |
0.966 |
0.9275 |
0.0134 |
1.976 |
19.184 |
0.4681 |
|
7. |
Mustard leaves |
0.0309 |
0.4906 |
1.28 |
1.20 |
0.0043 |
1.6611 |
19.083 |
0.4469 |
|
8. |
Wild spinach |
0.029 |
0.6511 |
1.67 |
18.622 |
0.065 |
2.976 |
15.028 |
1.0777 |
Table 5: Metal concentration and HPI values for 8 different vegetables at site 4
|
S. No. |
Vegetable Name |
Cd |
Cu |
Pb |
Ni |
Cr |
Zn |
Fe |
HPI |
|
1. |
Carrot |
0.55 |
1.318 |
0.345 |
0.050 |
0.038 |
2.757 |
8.690 |
0.5344 |
|
2. |
Radish |
0.234 |
0.174 |
0.732 |
0.893 |
28.5342 |
7.230 |
15.265 |
1.8589 |
|
3. |
Tomato |
0.220 |
1.648 |
0.589 |
1.363 |
0.0625 |
0.798 |
2.590 |
0.6317 |
|
4. |
Coriander |
0.031 |
1.296 |
0.330 |
0.081 |
0.042 |
1.078 |
4.166 |
0.3040 |
|
5. |
Spinach |
0.052 |
1.040 |
0.294 |
0.063 |
0.022 |
1.010 |
8.081 |
0.2990 |
|
6. |
Radish leaves |
0.238 |
0.510 |
0.560 |
0.587 |
1.928 |
0.962 |
12.655 |
0.9909 |
|
7. |
Mustard leaves |
0.127 |
0.821 |
0.702 |
0.411 |
0.4089 |
3.029 |
23.245 |
0.9801 |
|
8. |
Wild spinach |
0.121 |
0.814 |
0.758 |
0.639 |
0.0198 |
2.645 |
12.965 |
0.6187 |
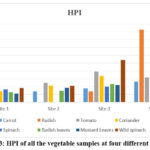 |
Figure 3: HPI of all the vegetable samples at four different sites. |
Table 6: Variations in the HPI of heavy metal ions observed in the vegetables
|
Metals |
Permissible limits in ppm for vegetables |
The mean concentration of metal ions for all sites (ppm) |
Increased Percentage (%) |
Diseases caused by excess metal concentration |
|
Cd |
0.003 |
0.0659 |
2096.67 |
It can cause cancer. |
|
Cu |
1 |
0.4972 |
Within limits |
Vomiting, jaundice, depression, fatigue |
|
Pb |
0.3 |
0.9797 |
226.57 |
Muscular, skeletal and neurological disorders |
|
Ni |
0.5 |
0.8505 |
70.1 |
Headache, gastrointestinal and respiratory disorders |
|
Cr |
0.05 |
0.6571 |
1214.2 |
Cardiac, neurological, and gastrointestinal disorders |
|
Zn |
5.15 |
5.0439 |
Within limits |
Vomiting, nausea, diarrhoea |
|
Fe |
0.3 |
9.5518 |
3083.93 |
Diabetes, hemochromatosis, stomach problems and nausea |
|
HPI |
0.2376 |
0.4208 |
|
|
Analysis of vegetable samples by AAS
Cadmium
Cadmium levels in vegetables averaged 0.0659 parts per billion. The mean concentration of all four sites per vegetable was -Radish leaves>Carrot>Radish>Tomato>Wild Spinach>Mustard leaves>Spinach> Coriander.
The site-wise cadmium concentration was – Site4> site3> site2 > site1
Copper
The copper concentrations in the vegetables were within safe limits and averaged 0.4972 ppm. The mean concentration of copper concentration at all the four sites per vegetable was –
Tomato >Coriander >Spinach>Wild spinach>Mustard leaves>Carrot>Radish leaves> Radish
The site-wise copper concentration was -Site4> site3 > site1> site2
Lead
This research revealed that among eight types of vegetables sampled across four sites, tomato had the highest lead content (1.791 ppm) at site 2. The average amount of lead found in vegetables was 0.9797 parts per billion. The mean concentration of all four sites per vegetable was -Tomato> Coriander >Wild spinach >Mustard leaves>Radish >Radish leaves>Spinach >Carrot.
The site-wise Lead concentration was -Site3> site2> site1> site4
Nickel
The highest nickel content was discovered in wild spinach (18.622 ppm) at site three among the eight types of vegetables tested at four sites. The average nickel content of vegetables suitable for human consumption was 0.8505 ppm. The mean concentration of all four sites per vegetable was Wild spinach>Coriander >Tomato >Radish leaves >Mustard leaves >Carrot>Radish >Spinach.
The site-wise Nickel concentration was -Site3> site4> site1> site2
Chromium
Radish had the highest chromium levels (28.5342 ppm) at site 4 out of the eight vegetable groups tested. Wild spinach at the first site had the lowest concentration (0.0023 ppm). The average chromium content of vegetables suitable for human consumption was 0.6571 ppm. The mean concentration of all four sites per vegetable was -Radish>Radish leaves > Wild spinach >Mustard leaves> Tomato >Coriander >Carrot >Spinach.
The site-wise chromium concentration was -Site4> site3> site1> site2
Zinc
The highest quantity of zinc was discovered in tomatoes (55.45 ppm) at site 1 out of the eight vegetable groups tested. However, at site 4, the concentration was lowest in tomatoes (0.798% ppm). Zinc levels in consumable veggies averaged 5.0439 ppm. The mean concentration of all four sites per vegetable was-
Tomato>Mustard leaves>Radish>Wild spinach >Spinach >Carrot >Coriander >Radish leaves
The site-wise Zinc concentration was- Site3> site1> site2> site4
Iron
Coriander had the highest zinc levels (27.80 ppm) at site 3 out of the eight vegetable groups tested across the four locations. Site 4’s tomato sample had the lowest value (2,590 ppm). Zinc levels in vegetables that may be consumed averaged 9.5518 ppm. The mean concentration of all four sites per vegetable was-
Radish>Coriander >Mustard leaves >Radish leaves >Wild spinach >Spinach >Carrot >Tomato
The site-wise Iron concentration was- Site3> site4> site1> site2
Heavy Metal Pollution Index (HPI). 23-24
HPI of all sites vegetable-wise is represented in Fig-3. It is based on the heavy metal ion concentrations obtained by AAS and it evaluates the total metal content in each variety of vegetables grown at different sites; using the formula initially proposed by Usero et al.
The HPI was calculated as the geometric mean of the metal concentrations in the edible sections of the plants at each site 24.
HPI = (Cf1× Cf2×Cf3×……….Cfn) ^1/n
Cf is the Concentration of ‘nth‘ heavy metal in vegetable samples. So, in our study, n=7, we analysed 8 vegetable samples for seven metals. Results are given in [Tables 2,3,4, 5] and [Figure 3] for all four sites. The HPI indicated the following order for site-wise heavy metal toxicity-
Site 4>Site 3> Site 2>Site 1, which was also confirmed by the high frequencies of heavy metal ions observed in the same areas.
Conclusion
The study was based on HPI, AAS and ICP-MS studies. The range of HPI in carrot, radish, tomato, coriander, spinach, radish leaves, mustard and wild spinach was between 0.2169-0.5344, 0-1.8589, 0.4997-0.7829, 0.2875-0.6729, 0-0.4058, 0.2609-0.9909, 0.2227-0.9801 and 0.3653-1.0777 respectively. Site 4 samples were the most toxic, and the highest levels of heavy metals were found in radish among all the sites. The overall order of observed heavy metal concentration site-wise was- site 4 > site 3> site 2 > site 1. This was also confirmed by the AAS and ICP-MS analysis. In our study, Zn and Cu were found within limits, whereas Fe, Cd, Cr, Pb, and Ni were found 3-10 times more in concentration than the prescribed limits.
There has been an alarming increase in cancer, bronchial issues, and neurological disorders in Jodhpur City in the past few years25-28 Site four where vegetables were most toxic is a slum area, where mostly lower-income group people reside, they buy these toxic cheap vegetables from local vendors near residential areas, small shops, and community markets where vegetables are brought from the areas irrigated with toxic effluent waters could well be due to severe and pressing issues of heavy metal toxicity exposure among the general population. Enforcing a strict ban on irrigation with effluent water should be the utmost priority. We also recommend continuous monitoring of these heavy metals in vegetables sold in the local market to keep a check on the toxicological changes. People should be aware of the health-related issues from heavy metals consumption in vegetables. Implementing these measures can save people from life-threatening diseases caused by toxic vegetables.
Acknowledgement
The authors thank the Defense Laboratory Jodhpur, the Pollution Control Board Jodhpur and the Department of Chemistry, JNVU Jodhpur, for their support in facilitating the AAS and ICP-MS used in our experiments.
Conflict of Interest
The authors declare no conflict of interest in the present work.
References
- Ahmad W.; Alharthy R. D.; Zubair M.; Ahmed M.; Hameed A.; Rafique S., Toxi and heavy metals contamination assessment in soil and water to evaluate human health risk Sci. Rep., 2021, 11(1), 17006.
CrossRef - Qasemi M.; Shams M.; Sajjadi S. A.; Farhang M.; Erfanpoor S.; Yousefi M., Cadmium in groundwater consumed in the rural areas of Gonabad and Bajestan, Iran: occurrence and health risk assessment, Biol. Trace Elem. Res., 2019, 192(2), 106.
CrossRef - Pipoyan D.; Beglaryan M.; Sireyan L.; Merendino N., Exposure assessment of potentially toxic trace elements via consumption of fruits and vegetables grown under the impact of Alaverdi’s mining complex. Hum. Ecol. Risk Assess., 2019, 25(4), 819.
CrossRef - Manea D. N.; Ienciu A. A.; Ştef R.; Şmuleac I. L.; Gergen I. I.; Nica D. V., Health risk assessment of dietary heavy metals intake from fruits and vegetables grown in selected old mining areas-a case study: the Banat area of Southern Carpathians. Int. J. Environ. Res. Public Health, 2020, 17(14), E5172.
CrossRef - Roba C.; Roşu C.; Piştea I.; Ozunu A.; Baciu C., Heavy metal content in vegetables and fruits cultivated in Baia Mare mining area (Romania) and health risk assessment. Environ. Sci. Poll. Res. Int., 2016, 23(7), 6062.
CrossRef - Onakpa M. M.; Njan A. A.; Kalu O. C., A Review of Heavy Metal Contamination of Food Crops in Nigeria. Ann. Glob. Health, 2018, 84(3), 488.
CrossRef - Mishra S.; Bhargava R. N.; More N.; Yadav A.; Zainith S.; Mani S., Environmental biotechnology: for sustainable future. Singapore: Springer; 2019, 103.
CrossRef - Parween A.; Khani M.M.; Upadhyay T.; Tripathi R.V., Prevalence of elevated blood Lead level in children of India, Nat. Env. Poll. Tech., 2018, 17, 703.
- Yadav G.; Chambial S.; Agrawal N.; Gothwal M., Blood lead levels in antenatal women and its association with iron deficiency anaemia and adverse pregnancy outcomes, J. Family Med. Prim. Care, 2020. 9(6), 3106.
CrossRef - Manwani S.; Vanisree C.R.; Jiman V.; Heavy Metal Contamination in Vegetables and Their Toxic Effects on Human Health, Intech Open,2022, 1.
CrossRef - Rani J.; Agarwal T.; Chaudhary S., Health risk assessment of heavy metals through the consumption of vegetables in the National Capital Region, India, Research Square, 2021, 1.
CrossRef - Fonge B.A.; Larissa M.T.; Egbe A.M.; Afanga Y.A.; Fru N.G.; Ngole-Jeme V.M., assessment of heavy metal exposure risk associated with consumption of cabbage and carrot grown in a tropical Savannah region, Sustainable Environment. 2021, 7(1), 1.
CrossRef - M. G.; Tinkov A. A.; Lobanova Y. N.; Chang J. S.; Skalny A. V., Serum Levels of Copper, Iron, and Manganese in Women with Pregnancy, Miscarriage, and Primary Infertility. J. Trace. Elem. Med. Biol., 2019, 56, 124.
CrossRef - Sankhla M. S.; Kumar R.; Agrawal P., Arsenic in water contamination & toxic effect on human health: Current scenario of India. J. Forensic Sci. Crim. Investig. 2018, 10(2), 001.
- Ali H.; Khan E., Bioaccumulation of non-essential hazardous heavy metals and metalloids in freshwater fish. Risk to Human Health. Environ. Chem. Lett., 2018, 16(3), 903.
CrossRef - Rai P. K.; Lee S. S.; Zhang M.; Tsang Y. F.; Kim K. H., Heavy metals in food crops: Health risks, fate, mechanisms, and management. Environ. Int., 2019, 125, 365.
CrossRef - Mishra P.; Soni R.; Kachhwaha V.; Giri N., Assessment of toxic metals in common food grains grown in Jodhpur city. Ras. J. Chem., 2020, 13(1), 210.
- Mishra P.; Kachhwaha V., Assessment of Heavy Metal Pollution Index (HPI) In The Vegetables Collected From The Local Markets, Fields and Beras in The Jodhpur City, Rajasthan (India). Bull. Env. Pharmacol. Life Sci., 2022, Sp. Issue 1: 1096.
- Asdeo A.; Loonker S., A Comparative Analysis of Trace Metals in Vegetables. Res. J. Env. Toxicol., 2011, 5(2), 125.
CrossRef - Sharma R.K.; Agrawal M.; Marshall F., Heavy metal (Cu, Zn, Cd and Pb) contamination of vegetables in urban India: A case study in Varanasi. Environ. Poll., 2008, 154(2), 254.
CrossRef - Khan K.; Amani S.; Rohim Bacha A.; Nabi I., Assessment of heavy metals among auto workers in metropolitan city, a case study, Front. Health Health, 2023, 11, 01.
CrossRef - Thomas R., 2004, Practical guide to ICP-MS (NY: M. Dekker),2004
CrossRef - Mohan V. S.; Nithila P.; Reddy S.J., Estimation of heavy metals in drinking water and development of heavy metal pollution index, J. Environ. Sci. Health, 1996, A31(2), 283.
CrossRef - Opong R.A.; Ofori A.; Ofosuhene M., Heavy metals concentration and pollution index (HPI) in drinking water along the southwest coast of Ghana. Appl Water Sci, 2021, 11(57), 1.
CrossRef - Goyal T.; Mitra P.; Singh P., Assessment of Blood Lead and Cadmium Levels in Occupationally Exposed Workers of Jodhpur, Rajasthan, Ind. J. Clinical Biochem., 2020, 36, 100.
CrossRef - Chambial S.; Mitra P.; Bhardwaj P., Blood lead level in school-going children of Jodhpur, Rajasthan, India, Turk. J. Biochem., 2021, 46(4), 393.
CrossRef - Singh P.; Mitra P.; Goyal T., Evaluation of DNA damage and expressions of DNA repair gene in occupationally lead-exposed workers, (Jodhpur, India), Bio. Trace Elem. Res., 2021, 199(6), 1707.
CrossRef

This work is licensed under a Creative Commons Attribution 4.0 International License.
About The Author
![]()
A New Edition of Web of Science
Journal Impact Factor
2022: 0.5
Five Year: 0.8
Journal is Indexed in

Cabells Whitelist
![]()


