Hydrothermal Synthesis, Structural Analysis and Photoluminescence Study of Nd3+/Ho3+ Doped Nanophosphors
Girija Venkateswara Koneru1 , Venkata Nagendra Kumar Putta1* and Sirisha Bandi1,2
1Department of Chemistry, GITAM Deemed to be University, Rudraram, Hyderabad, Telangana, India.
2B V Raju Institute of Technology, Narsapur, Telangana, India.
Corresponding Author E-mail: pvenkatanagendrakumar@gmail.com
DOI : http://dx.doi.org/10.13005/ojc/400106
Article Received on : 18 Dec 2023
Article Accepted on :
Article Published : 15 Feb 2024
Reviewed by: Dr. Mahdi Rezaei Sameti
Second Review by: Dr. Sofi Ashaq Hussain
Final Approval by: Dr. Tanay Pramanik
Through photoluminescence (PL) investigations, this work shows that the hydrothermal technique of nanomaterial synthesis can successfully produce GdPO4:Nd3+/Ho3+ nanophosphors that display luminescence properties. Down-conversion peaks that produce green and red light arise at certain wavelengths (465, 550, and 674 nm) in response to stimulation at 300 nm. The analysis indicates the P-O CT band of Ho3+ ions and non-radiative resonance energy transfer, which boosts Ho3+ ion emission. GdPO4:Nd3+/Ho3+, an up-conversion (UC) nanophosphor, exhibits efficient luminescence output, with Ho3+ ions being attributed to distinct peaks in the up-conversion emission spectra (465 nm, 550 nm, and 674 nm). Nd3+ ions under strong 808 nm laser irradiation promote these peaks. The study produces well-crystalline nanoparticles with diameters ranging from a few nanometers to tens of nanometers by using the hydrothermal synthesis approach. Under PLE tests, the nanophosphors show an impressive quantum yield, suggesting a wide range of possible uses in the field of nanophosphor materials.
KEYWORDS:Hydrothermal synthesis; Gadolinium ion; Holmium ion; Neodymium ion; Photoluminescence
Download this article as:| Copy the following to cite this article: Koneru G. V, Putta V. N. K, Bandi S. Hydrothermal Synthesis, Structural Analysis and Photoluminescence Study of Nd3+/Ho3+ Doped Nanophosphors. Orient J Chem 2024;40(1). |
| Copy the following to cite this URL: Koneru G. V, Putta V. N. K, Bandi S. Hydrothermal Synthesis, Structural Analysis and Photoluminescence Study of Nd3+/Ho3+ Doped Nanophosphors. Orient J Chem 2024;40(1). Available from: https://bit.ly/49vD7w9 |
Introduction
In the field of materials science, rare earth elements (RE) have attracted a lot of attention because of their easy manufacturing processes and wide range of uses. Temperature sensors, spectrum converters, solar cells, medicinal applications, high-tech enterprises, and other fields have all made extensive use of the integration of RE-doped nanomaterials. Standardised processes for the large-scale synthesis of dual-mode nanomaterials are yet unattainable, despite their great potential. Rare earth orthophosphates are unique among RE compounds in that they exhibit exceptional thermal stability and chemical resistance, withstanding temperatures as high as 2200°C 1-5. These materials also have visually pleasing properties, low solubility, and are widely acknowledged as excellent hosts for radioactive waste adsorption. This work presents a new hydrothermal synthesis technique for producing GdPO4:Nd3+/Ho3+ dual-mode conversion nanomaterials. When stimulated by a continuous wave (CW) laser, the luminous features of the synthesised material are enhanced due to the precise control of size and shape achieved by this process. GdPO4 nanoparticles exhibit both up-conversion (UC) and down-conversion (DC) characteristics, making them an effective luminescence host. Permitted transitions, such the 300 nm light-absorbing charge transfer (CT) process from O2− to Gd3+, are responsible for this dual-mode behaviour. When excited by UV radiation, the emission spectra show distinct peaks at around 465 nm, 550 nm, and 674 nm that correspond to Ho3+ ions, suggesting that down-conversion has occurred. In addition, Nd3+ acts as a sensitizer by increasing the material’s emission intensity of Ho3+ ions. The upconversion emission spectra of room temperature GdPO4 shows emissions from both Ho3+ and Nd3+ under near-infrared (IR) light at 808 nm 6-10. By using an 808 nm laser to excite the sample, it is possible to analyse down-conversion, up-conversion, and energy transfer efficiency processes in detail. These nanomaterials’ activated functional groups provide fascinating sensing properties that increase their potential use in a variety of applications, such as bio imaging, security, and optical and display systems11-14. Thus, our study adds to the growing body of knowledge on RE-based nanomaterials with customised dual-mode luminous characteristics. From previous synthesis, activation, and characterisation of upconversion crystals doped with Yb3+ and Ho3+ are covered in brief in this study37. The difficulties and developments in nanotechnology for use in biomedical applications, with an emphasis on the creation of an innovative, very sensitive luminous nano thermometer that has been verified for bio safety38.The crystals’ surface modification with hydrophilic dextran improves their applicability for cell fluorescence imaging applications, and they exhibit promising upconversion fluorescence features. Results in the literature show that different applications and in the present study GdPO4:Nd3+/Ho3+ photoluminescent materials are attractive options for many technological and biological applications because of their dual-mode luminescence, tunability, efficient energy transfer, and carefully regulated synthesis.
Chemical Substances and the Process of Synthesis
Chemicals Used: Reactants for the synthesis process were highly pure analytical grade reagents. Among these was Hydrated Gadolinium (III) acetate (Gd(ac)3).XH2O, Hydrated Holmium (III) Acetate (Ho(ac)3) .XH2O, Ammonium Dihydrogen Phosphate ((NH4)2H2PO4, Hydrated Neodymium(III) Acetate (Nd(ac)3).XH2O, polyol ethylene glycol (6000), Con. sodium hydroxide (NaOH), diluted hydrochloric acid (HCl), and deionized water.
GdPO4 Synthesis: Ho3+/Nd3+ Nanoparticles
The hydrothermal procedure was adopted to prepare the sample.
Synthesis Methodology
Nd3+/Ho3+ doped GdPO4 by hydrothermal synthesis was made to create the nanoparticles. The following is how the sample was made: GdPO4 luminous nanoparticles (GdPO4:Ho3+, Nd3+) with 1% Ho3+ and 20% Nd3+ were created by doping GdPO4 with Ho3+. The hydrothermal technique was employed in the synthesis of this compound. In a traditional synthesis, 5 ml of concentrated HCl was mixed with 730.76 mg of (CH3CO2)3Gd.XH2O, 8.7 mg of (CH3CO2)3Ho.XH2O, and 178.48 mg of (CH3CO2)3Nd.XH2O. The mixture was then heated until the materials were dissolved. As a consequence, metal ions were dissolved and formed a clear, transparent solution.10 ml of deionized water was alternatively added, heated to 80°C at least five times, and the evaporation procedure was repeated in order to eliminate any remaining HCl. There were 298.2 mg of (NH4)2HPO4 dissolved in 10 ml of deionized water. Drop by drop, 2.64 g of dissolved NaOH was added to 10 ml of deionized water until the (NH4)2HPO4 solution became translucent, resulting in a transparent solution15-20. Next, 20 millilitres of PEG(6000) were added to the evaporated metal ion solution, which had been transferred to a 100 millilitre round-bottom flask. At 80°C, it was refluxed for a minimum of 10 minutes before the (NH4)2HPO4 solution was added dropwise. A faint yellow colour was seen when the (NH4)2HPO4 solution was added; however, after two hours of heating at 120°C, the colour became white. This suggested that a white precipitate was forming. After allowing the mixture to cool to ambient temperature, it was centrifuged for five minutes at 5000 rpm, twice washed with 10 ml of acetone, then dried under an infrared light to extract the white powder. The prepared sample was then heated for four hours at 900°C. By Hydrothermal-mediated synthesis technique with PEG (6000), a GdPO4: Nd3+/Ho3+ nanophosphor compound with a well-defined product morphology was synthesised from Fig. 1.
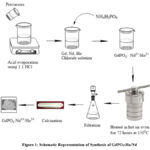 |
Figure 1: Schematic Representation of Synthesis of GdPO4:Ho/Nd. |
Result and discussion
XRD Analysis
Fig. 2. XRD analysis can elucidate the successful incorporation of dopants, such as Nd and Ho, into the crystal lattice. Alterations in the diffraction pattern or shifts in peak positions serve as indicators of the presence of dopant ions and their impact on the crystal structure. Additionally, XRD is a valuable tool for evaluating the phase purity of the material21-25.The emergence of distinct peaks or the absence of anticipated peaks may hint at the occurrence of impurities or the existence of multiple phases. In cases where a monoclinic phase transformation takes place, XRD typically reveals sharp peaks associated with this structural change. As a result, the XRD pattern of GdPO4:Ho/Nd shows distinct peaks at 20 and 35 degrees, which are compatible with the material having a monoclinic crystal structure and matching up with certain crystallographic planes. Because the crystal lattice is non-orthogonal, the Miller indices -101, 210, and -112 indicate a collection of crystallographic planes in a monoclinic structure, with particular intercepts along the a, b, and c axes.
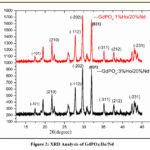 |
Figure 2: XRD Analysis of GdPO4:Ho/Nd. |
SEM Analysis
To summarise, the SEM picture presented in Fig. 3. offers important insights into the morphology of the GdPO4:Ho3+/Nd3+ nanophosphor material that was annealed at 900°C. It also shows a wide variety of nanoparticle morphologies 26-30. By displaying the elemental distribution within the nanoparticles, the corresponding compositional images in Figure-3 improve comprehension even more and facilitate the interpretation of the material’s structural and chemical properties.
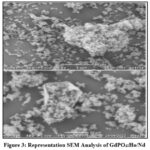 |
Figure 3: Representation SEM Analysis of GdPO4:Ho/Nd |
FT-IR Analysis
Fig. 4. Since GdPO4 is intrinsically a phosphate-based compound, its FT-IR spectra doped with Nd3+ and Ho3+ should exhibit characteristic vibrations linked to the phosphate (PO43-) groups. Specifically, it is expected that the phosphate groups’ symmetric stretching vibrations will appear as a significant peak between 1000 and 1200 cm-1 wavenumber range. The FT-IR spectra provide a comprehensive tool for clarifying different vibrational features of the dopants, spanning a wide range from 4000 cm-1 down to about 400 cm-1. Various portions of the spectrum shed light on the distinct vibrational modes and interactions found in the doped GdPO4, giving rise to a thorough comprehension of its molecular makeup and bonding arrangements. In the end, the presence of certain vibrational modes, maybe connected to O-H stretching vibrations or metal-oxygen bonding, is suggested by the peak at 4400 cm^-1 in the FT-IR spectra of GdPO4 doped with Ho and Nd.
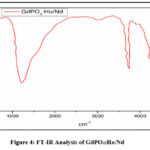 |
Figure 4: FT-IR Analysis of GdPO4:Ho/Nd. |
PL Studies
Studies on photoluminescence (PL) examine how a material emits light (photons) in response to external light sources, usually visible or ultraviolet (UV) light. PL studies in the Fig. 5. of GdPO4:Ho/Nd nanophosphors concentrate on comprehending the material’s luminescent characteristics, particularly the emission of light at particular wavelengths. The PL spectrum exhibits peaks at 465 nm, 550 nm, and 674 nm that reveal important details about the energy levels and electronic transitions of the dopant ions (Ho3+ and potentially Nd3+).
A Explanation of PL studies is provided below
Electron Excitation
The material is first exposed to a light source, usually UV or visible light, in photoluminescence (PL) studies. Higher energy levels are excited in the material’s electrons by this external energy.
Elevations of Energy and Electronic Changes
After being raised to higher energy levels, the excited electrons eventually descend back to their ground state. They release photons, which are units of energy, during this process. The energy differences between various electronic states are indicated by the particular wavelengths at which photons are emitted.
Ho3+ Ions
The observed luminescence may be caused by 808 laser excited yet 300nm certain electronic transitions occurring within the Ho3+ ions, as indicated by the peaks at 465, 550, and 674 nm. Every peak represents a distinct transition in energy levels, and these transitions are frequently connected to the distinctive electronic structure of Ho3+.
Influence of Nd3+
It is necessary to take into account the impact of any Nd3+ dopant ions on the PL spectrum. Changes in energy levels and emission characteristics may result from interactions between Nd3+ and Ho3+ ions as well as from their interactions with the host lattice GdPO4.
Peak at 465 nm
One possible explanation for a peak in the photoluminescence spectra at 465 nm is that it corresponds to an energy level or electronic transition in the Ho3+ ions. Rare-earth ion electronic transitions frequently cause emission peaks in the visible spectrum. One way to determine the precise transition causing this peak is to compare it with known energy levels of Ho3+ in the literature and do to host research.
Peak at 550 nm
It is possible that another electronic transition within the Ho3+ ions is responsible for the peak at 550 nm. In the visible spectrum, distinctive emission peaks are caused by the energy difference between the various electronic states of rare-earth ions. Understanding the nature of this luminescence can be gained by reviewing the literature on Ho3+ transitions in comparable host materials.
Peak at 674 nm
In a similar way, the signal at 674 nm indicates that the Ho3+ ions may undergo one more electronic transition. The literature contains extensive information on the energy levels and transitions of rare-earth ions, and comparing the measured peaks with known transitions can aid in deciphering the material’s luminous characteristics.
Not to be ignored there is a possibility that the presence of Nd3+ dopant ions will also affect the material’s overall photoluminescence behaviour31-36. Changes in energy levels and emission characteristics can result from the interaction between dopants and the host lattice. Literature sources discussing PL studies on GdPO4:Ho/Nd nanophosphors, particularly those focusing on emission peaks around 465nm, 550nm, and 674nm, would provide a more detailed and specific explanation.
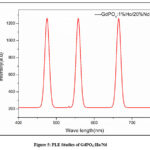 |
Figure 5: PLE Studies of GdPO4:Ho/Nd |
Conclusion
Finally, this work greatly contributes to our understanding of GdPO4:Nd3+/Ho3+ nanomaterials. Together, the morphological information from SEM, the XRD confirmation of dopant incorporation, and the information from FT-IR allow for a thorough characterisation. The photoluminescence experiments’ observed electronic changes highlight the potential uses of these nanomaterials across a range of technological and biological fields. This discovery not only opens up new avenues for future research, but it also offers insightful information on the structural and optical characteristics.
Acknowledgment
My heartfelt appreciation goes to GITAM Deemed to be University(Hyderabad) for providing a facility for synthesis.
Conflicts of Interest
We have no competing interests that could Influence our research or findings.
References
- Bhonsule, S. U.; Wankhede, S. P.; & Moharil, S.V. In AIP Conference Proceedings., 2018, 1953,1.
CrossRef - Perala, R. S.; Singh, B. P.; Putta, V. N. K.; Acharya, R.; & Ningthoujam, R. S. ACS omega., 2021,6, 19517-19528.
CrossRef - Perala, R. S.; Joshi, R.; Singh, B. P.; Putta, V. N. K.; Acharya, R.; & Ningthoujam, R. S. ACS omega., 2021, 6, 19471-19483.
CrossRef - Szczygieł, I.; Macalik, L.; Radomińska, E.; Znamierowska, T.; Mączka, M.; Godlewska, P.; & Hanuza, J. Optical Materials, 2007,29, 1192-1205.
CrossRef - Kumar, V.; & Wang, G. Journal of Luminescence., 2018, 199, 188-193.
CrossRef - Parchur, A.K.; Ningthoujam, R.S., RSC Advances.,2012, 2, 10854-10858.
CrossRef - Niu, C.; Li, L.; Li, X.; Lv, Y.; Lang, X., Optical Materials., 2018, 75, 68-73.
CrossRef - Yu, C.; Yu, M.; Li, C.; Liu, X.; Yang, J.; Yang, P.; & Lin, J., Journal of Solid State Chemistry., 2009, 182, 339-347.
CrossRef - Prorok, K.; Bednarkiewicz, A.; Cichy, B.; Gnach, A.; Misiak, M.; Sobczyk, M.; Strek, W., Nanoscale., 2014, 6, 1855-1864.
CrossRef - AitMellal, O.; Oufni, L.; Messous, M. Y.; Trandafir, M. M.; Chirica, I. M.; Florea, M.; Neațu, F., Journal of Solid State Chemistry., 2021, 301,122310.
CrossRef - Wang, G.; Peng, Q.; Li, Y., Accounts of chemical research., 2021, 44, 322-332.
CrossRef - Kang, X.; Li, C.; Cheng, Z.; Ma, P. A.; Hou, Z.; Lin, J., Wiley Interdisciplinary Reviews: Nano medicine and Nano biotechnology., 2014, 6, 80-101.
CrossRef - Kumar, V.; Rani, P.; Singh, D.; Chawla, S., RSC advances., 2014, 4, 36101-36105.
CrossRef - Suryawanshi, I.; Srinidhi, S.; Singh, S.; Kalia, R.; Kunchala, R. K.; Mudavath, S. L.; Naidu, B.S., Materials Today Communications., 2021, 26, 102144.
CrossRef - AitMellal, O.; Oufni, L.; Messous, M. Y.; Trandafir, M. M.; Chirica, I. M.; Florea, M.; Neațu, F., Journal of Solid State Chemistry., 2021, 301,122310.
CrossRef - Tymiński, A.; Śmiechowicz, E.; Martín, I.R.; Grzyb, T., ACS Applied Nano Materials., 2020, 3, 6541-6551.
CrossRef - Lyu, T.; Dorenbos, P., Journal of Materials Chemistry C., 2018, 6,369-379.
CrossRef - Gavrilović, T.; Periša, J.; Papan, J.; Vuković, K.; Smits, K.; Jovanović, D. J.; Dramićanin, M. D., Journal of Luminescence., 2018,195, 420-429.
CrossRef - Hu, F.; Wei, X.; Qin, Y.; Jiang, S.; Li, X.; Zhou, S.; Yin, M., Journal of Alloys and Compounds., 2016, 674, 162-167.
CrossRef - Thakur, H.; Singh, B.P.; Kumar, R.; Gathania, A.K.; Singh, S.K.; Singh, R.K., Materials Chemistry and Physics., 2020,253,123333.
CrossRef - Frost, R.; Hales, M.; Martens, W., Journal of Thermal Analysis and Calorimetry., 2009, 95, 999-1005.
CrossRef - Ren, W.; Tian, G.; Zhou, L.; Yin, W.; Yan, L.; Jin, S.; Zhao, Y., Nanoscale., 2012, 4, 3754-3760.
CrossRef - Yi, Z.; Lu, W.; Qian, C.; Zeng, T.; Yin, L,; Wang, H.; Zeng, S., Biomaterials Science., 2014, 2, 1404-1411.
CrossRef - Tadge, P.; Yadav, R. S.; Vishwakarma, P. K.; Rai, S. B.; Chen, T. M.; Sapra, S.; Ray, S. Journal of Alloys and Compounds., 2020, 821, 153230.
CrossRef - Fang, Y. P.; Xu, A. W.; Song, R. Q.; Zhang, H. X.; You, L. P.; Yu, J. C.; Liu, H. Q., Journal of the American Chemical Society., 2003, 125,16025-16034.
CrossRef - Haase,M.; Schäfer, H., Angewandte Chemie International Edition., 2011, 50, 5808-5829.
CrossRef - Sukul, P. P.; Kumar, K., Methods and applications in fluorescence., 2016, 4, 044005.
CrossRef - Cesaria,M.; DiBartolo, B., Nanomaterials., 2019,9,1048.
CrossRef - Qu, Z.; Shen, J.; Li, Q.; Xu, F.; Wang, F.; Zhang, X.; Fan, C., Theranostics., 2020, 10, 2631.
CrossRef - Duc-Tin, Q.; Keppler, H., Contributions to Mineralogy and Petrology., 2015, 169, 1-26.
CrossRef - Hudry, D.; Howard, I.A.; Popescu, R.; Gerthsen, D.; Richards, B.S., Advanced Materials.,2019, 31,1900623.
CrossRef - Yada, M., In Inorganic and Metallic Nano tubular Materials. Springer, Berlin, Heidelberg., 2010, 48,97-115.
CrossRef - Runowski, M.; Grzyb, T.; Zep, A.; Krzyczkowska, P.; Gorecka, E.; Giersig, M.; Lis, S., RSC Advances., 2014, 4, 46305-46312.
CrossRef - Bouddouch, A.; Amaterz, E.; Bakiz, B.; Taoufyq, A.; Guinneton, F.; Villain, S.; Benlhachemi, A., Optik., 2021, 238, 166683.
CrossRef - Bandi, S.; Kanuparthy, P. R.; & Putta, V. N. K. Oriental Journal of Chemistry., 2023 ,39.
CrossRef - Bandi, S.; Kanuparthy, P. R.; & Putta, V. N. K. Asian Journal of Chemistry.,2023,35.
- Li, X.; Zhu, J.; Man, Z.; Ao, Y.; & Chen, H. Scientific Reports, 2014, 4, 4446.
CrossRef - Sofi, A. H., & Shah, M. A. Materials Research Express, 2014, 1, 015041.
CrossRef

This work is licensed under a Creative Commons Attribution 4.0 International License.
About The Author
![]()
A New Edition of Web of Science
Journal Impact Factor
2022: 0.5
Five Year: 0.8
Journal is Indexed in

Cabells Whitelist
![]()


