Sequestration of Hexavalent Chromium in Aqueous Media Using Chitosan-Modified Biochar
Pranali I.Choudhari1* , Sarang S. Dhote1 and Mamata R. Lanjewar2
1Shri Shivaji Education Society Amravati's Science College, Nagpur-440033, India.
2Department of Chemistry, R.T.M. Nagpur University,Nagpur-440033, India.
Corresponding Author E-mail: pranalichoudhari21@gmail.com
DOI : http://dx.doi.org/10.13005/ojc/400107
Article Received on : 15 Nov 2023
Article Accepted on :
Article Published : 17 Jan 2024
Reviewed by: Dr. Makeswari R
Second Review by: Dr. Mervate Mohammad Ibrahime
Final Approval by: Dr. hatice karaer yağmur
The impact of toxic heavy metals on the environment is a significant global issue. This study's main goal is to remove Cr(VI) from water by using biodegradable materials like chitosan and mature Plumeria alba leaves as a composite biosorbent. The newly prepared biosorbent is characterized by BET, FTIR, SEM, EDX, and TGA & DTA analysis. The porous morphology, surface characteristics, crystalline nature, and thermal stability were evaluated. To determine the actual mechanism underlying the first stages of the sorption process, several variables, including contact time, solution pH, adsorbent dose, and beginning metal ion concentration, are used to test the biosorbent's adsorption capacity. It was discovered that pH 4, adsorbent dose 0.5g, adsorption time 120 min, and Cr(VI) concentration 25 mg L-1 were the ideal operating conditions. There was a 92% maximum elimination of Cr(VI). The Langmuir model was utilized to obtain a qmax value of 366.3 mg/g. The biosorbent offered a superior match to pseudo-second-order kinetic models and the Langmuir isotherm model. and ΔH0 negative values fell and were shown to be exothermic and spontaneous during the entire process of adsorption. The experimental investigation suggested that the bio-sorbent may have developed into a promising, environmentally friendly adsorbent.
KEYWORDS:Adsorption; Adsorption isotherm; Cr(VI); Chitosan; Mature Plumeria alba leaves; ZnCl2
Download this article as:| Copy the following to cite this article: Choudhari P. I, Dhote S. S, Lanjewar M. R. Sequestration of Hexavalent Chromium in Aqueous Media Using Chitosan-Modified Biochar. Orient J Chem 2024;40(1). |
| Copy the following to cite this URL: Choudhari P. I, Dhote S. S, Lanjewar M. R. Sequestration of Hexavalent Chromium in Aqueous Media Using Chitosan-Modified Biochar. Orient J Chem 2024;40(1). Available from: https://bit.ly/421z0ER |
Introduction
Water is necessary for life and there is no life without water, but nowadays water is getting polluted for many reasons. The untreated wastewater is deteriorating the freshwater resources & is a major environmental hazard to the receivers.
An unfavorable impact on human psychology could result from consuming water with excessive amounts of heavy metals. The most hazardous of these is chromium, which finds its way into rivers and groundwater through the effluent released by industries involved in leather tanning, chrome tanning, metal finishing, and electroplating1. There are two main valence states for chromium: trivalent (Cr[II]) and hexavalent (Cr[VI]), with the latter being more hazardous. Lung cancer, chrome ulcers, brain damage, and kidney damage have all been linked to Cr(VI), which is usually thought to be a thousand times more dangerous than Cr(III)2.According to Indian laws, the permissible limits (ISI 1977) for Cr(VI) in potable and industrial discharge water are 0.05 and 0.1 mg/L, respectively.
Currently, Cr(VI) in effluent is treated through chemical precipitation, biological processes, and ion exchange. The chemical precipitation approach has the benefits of established technology, ease of use, and efficacy, but it also yields sludge containing chromium and requires costly experimental reagents. Strong selectivity, significant elimination, and the ability to recover processed chromic acid are among the benefits of the ion exchange method. However, because of the material’s specific properties and the initial expenditure is excessively large, maintenance is difficult. The biological approach removes chromium while simultaneously benefiting the environment and offers the advantages of low processing costs and no secondary pollution3.
Adsorption technique has the potential to be the most efficient physicochemical technique when compared to the previous three methods. It is simple to use, inexpensive, highly effective in removing waste and produces no hazardous byproducts. To adsorb heavy metals in water4 prepared activated carbon was heated to 4000C along with sulfuric acid5 demonstrating how using fly ash as an adsorbent improved the ability of chitosan to bind to heavy metal ions in solutions containing Pb(II), Cu(II), and Cr(VI).
Waste-derived adsorbent can be used efficiently and inexpensively. Despite having a large surface area and a micro-surface nature, activated carbon is too expensive to be utilized to remove heavy metals from water and a chemical nature to its surface. To remove harmful metals from wastewater, there is a need for material that is less expensive and more commonly available. Adsorbents made from waste materials can be used effectively and affordably.
Activated carbon from this adsorbent is nothing but a carbonaceous material with a large surface area. Physical or chemical activation processes are used to create activated carbon from carbon-based sources. In physical activation, an inert environment is used to first carbonize the precursor material. The carbonized substance is then heated to high temperatures and activated with oxidizing gases including steam, CO, and CO2. Even though it is viewed as an ecological strategy because it doesn’t involve chemicals6. Carbonization and chemical activation are done simultaneously in chemical activation. Compared to physical activation, this has the benefit of saving time and energy7.In both activation methods material is heated at high temperature.
In the literature, various biomasses were chemically and physically activated to produce activated carbon. Evaluation of phosphoric acid-induced chemical activation of corncob-derived activated carbon was studied by al-sayed 8 followed by Langmuir adsorption isotherm. Waste material that has recently been effectively utilized to produce activated carbon includes orange peel9 , Moringa oleifera tree10,Coffee husk11, Coconut shell 12, Imperata cylindrical waste leaf 13 ,Pomegranate waste 14 ,Wild apple Fruit dust 15 ,Fig leaves16 , Potato peel17,Rice husk18 etc. To treat wastewater containing chromium, chitosan was chosen as the carrier for modification as an adsorbent in this work. B-(1-4)-linked D-glucosamine and N-acetyl-D-glucosamine are randomly distributed and combined to form the linear polymer known as chitosan19. By deacetylating chitin, a high molecular weight polymer known as chitosan is produced. Heavy metal ion adsorption is successfully achieved by the molecular surface’s abundance of amines (-NH2) and hydroxyl (-OH) which, depending on the medium’s pH, ionize to some degree when there is water present. As a result of their distinctive qualities, they are valuable in a wide variety of applications. They therefore have a significant function in numerous applications due to their distinct character. Moreover, they permit ion exchange or electrostatic attraction to cause the heavy metal ions’ adsorption. At low pH, the surface possesses a positive surface charge, when the amino group takes up a proton to create -NH3+, the carboxyl group ionizes to provide a negative surface charge at high pH. Chitosan is inexpensive, readily available, safe for the environment, and biodegradable.
As can be seen from the above studies, there is no study done on the production of activated carbon from Plumeria alba leaves powder which is further chemically activated by ZnCl2 & modified with Chitosan. The research aimed to discover a composite material by applying a chitosan coating to APAP, which would then be utilized to extract Cr(VI) from aqueous solutions. With this, we can utilize environmental waste & bring it into the economy. Chitosan was used to bind this natural material, creating a robust skeleton with a variety of functional groups.
Materials and Methods
Materials
From Merk, India, we obtained potassium dichromate, diphenylcarbazide, sulfuric acid, and zinc chloride. Chitosan with an 85% degree of deacetylation was provided by Unioloid Bio-Chemicals India Limited, Hyderabad.Potassium dichromate(K2Cr2O7) was used to create a stock solution of Cr(VI) at a concentration of 100 ppm There was no need for additional purification since every material used in this experiment was of the analytical quality & double distilled water was used to prepare the required solution.
Preparation of Activated Carbon
Matured leaves of Plumeria alba were collected from a nearby agriculture field in Nagpur District, Maharashtra, India. Plumeria alba mature leaves were properly cleaned by utilizing double-distilled water, and after that, they were sun-dried for several days until they were crisp. Finally dried leaves were powdered by using a crusher into required particle size, It is then carbonized at 6000C for 2 hours under a nitrogen atmosphere in a Muffle Furnace & then the carbonised material were activated by using 1 M Zinc chloride in (1:1) proportion. For this carbonized material should be completely dipped in ZnCl2 for 3 days. The carbonized material is then allowed to cool & washed several times using double distilled water until the filtrate’s zinc test result was negative. Then the pre-treated Mature Plumeria alba leaves powder is known as the Acid treated Plumeria alba powder(APAP).
Chitosan gel Preparation
About 3 g of chitosan is gradually added to 50 ml of 2% acetic acid (w/w) while stirring continuously. The liquid is additionally heated to 45–500C to aid in mixing. The mixture of chitosan and acetic acid generated a white, viscous gel at ambient temperature.
Surface coating of CAPAP with Chitosan
chitosan gel of 50 ml is heated to between 45 and 500C after being diluted with water. The diluted gel is gradually mixed with 5 g of APAP, and for 24 hours, it is mechanically shaken at 250 rpm with a rotary shaker. Following a distilled water wash, the gel-coated APAP is dried. The procedure is repeated for three times to form a thick coating of chitosan on the APAP surface[20]. By treating the material with 0.01N NaOH solution for three hours, excess acetic acid can be neutralized. After a thorough rinsing with distilled water, it is dried for 24 hours at 550C. Chitosan-coated acid-treated Plumeria alba powder (CAPAP) is the name given to the chitosan-coated APAP, which is kept in an airtight bottle for later use.
Batch Adsorption Procedure
The ideal factors, such as pH, adsorbent dosage, and adsorption duration, were all kept at room temperature for the adsorption investigations, which were conducted using a range of values for Cr(VI) between 10 mg/L and 100 mg/L21. At equilibrium, an amount of Cr (VI) adsorbed on CAPAP can be estimated.
Where,
Ci = initial Cr (VI) ion concentration
Ce= Cr (VI) equilibrium concentration in mg/L
W = the adsorbent’s weight in grams
V= the Cr (VI) solution’s volume in liters.
The formula below was used to obtain the percentage of removal efficiency.
Characterization
An analysis of surface area at a single point model for the Smart Sorb 92/93, Brunauer-Emmet-Teller (BET), was performed using the nitrogen adsorption-desorption method. Functional groups of PAZCA could be explained based on a Bruker Alpha spectrometer (USA) FT-IR spectra were recorded using it. which operates in the 500–4000 cm–1 wavelength range. A scanning electron microscope was used to study the CAPAP’s surface morphology (SEM). In addition, electronic composition was examined using energy-dispersive X-rays (EDX). Utilizing a Hitachi TGA-DTA 7200 analyzer with a 200 c/min heating rate in a nitrogen medium, a thermal study of CAPAP was carried out.
Result and Discussion
Characterization of CAPAP
The adsorption experiment’s surface is its most crucial component. The nitrogen adsorption-desorption method was used to calculate the pore volume and BET surface area of CAPAP at 77 K. It was discovered that the pore volume was 2.33 cm3/g and the surface area was 413.517 m2/g. Fig. 1 depicts the FT-IR spectra for CAPAP. The 3650 cm-1 peak indicates -OH group stretching 22. There is a strong peak at 3385 cm-1 caused by pectin, cellulose, and lignin, “water molecules with stretching vibration in -OH23. The signal at 3034 cm-1 indicates that a hydroxyl (carboxylic group) may be present. The methyl group’s C-H bond’s stretching and vibration were attributed to the peaks seen at 2944 cm-1 24. Usually, the C-C stretching vibration of alkyne groups is responsible for the peak at 2354cm-1 25. The signal at 1740 cm-1 is due to the stretching characteristics of the carbonyl group 26. There is a phosphate functional group present, as indicated by the peak at 1078 cm-1 27. N-H bending vibration is in charge of causing the peak at 1520 cm-1 28. For CAPAP, SEM analysis was performed for structural and morphological characteristics. SEM revealed a heterogeneous morphology of the adsorbent surface, which was irregular and highly porous at both 3000X and 4000X (Fig. 2a), observed that there are many active sites for the adsorption of the metal chromium (VI) on the surface of the biosorbent. Pores, heterogeneity of the adsorbent, and large cavities indicate their greater adsorption ability due to their extended surface area29. By using EDX, it was to confirm the elements that were visible on the surface of CAPAP. In CAPAP’s EDX spectrum (Fig. 3), carbon peaks C, O, Si, and Cl can be detected. To investigate the thermal deterioration of the CAPAP, TGA, or thermogravimetric analysis, was used. [Fig. 4(a)] shows the CAPAP’s thermogram. There are three phases of the sample weight loss with increasing temperature. CAPAP at 50–1000C lost 0.53% of its weight in the first stage as a result of surface and adsorbed water evaporating and the material becoming dehydrated. On the DTA curve, there was an endotherm that coincided with this. [Fig.4(b)]
Due to the CAPAP’s thermal deterioration and loss of organic matter content, between 200 and 6000C, a second weight loss of 0.55% was observed. This decomposition was endothermic. In the last stage, from 600-9000C the weight loss gradually decreased, indicative of carbon optimization in CAPAP. This decomposition is exothermic, as shown by the DTA curve30.
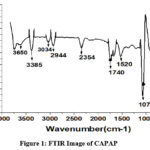 |
Figure 1: FTIR Image of CAPAP |
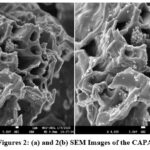 |
Figures 2: (a) and 2(b) SEM Images of the CAPAP. |
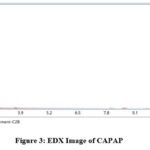 |
Figure 3: EDX Image of CAPAP. |
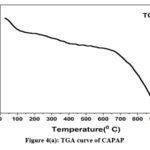 |
Figure 4(a): TGA curve of CAPAP |
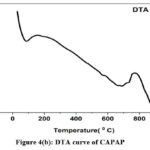 |
Figure 4(b): DTA curve of CAPAP. |
Batch Adsorption Experiments
Effect of pH
“The solution medium’s pH allows the adsorption sites on the surface of biosorbent particles to ionize more easily” 31. Figure 5A illustrates how pH affects the extraction of ions Cr(VI) from CAPAP. Initial adsorption is mostly caused by the ion exchange process, and the removal effectiveness was reduced with the metal solution’s pH rising. Due to protonation at lower pH levels, the biosorbent becomes positively charged, As an anion, the dichromate ion generates an electrical pull between them. Deprotonation begins as soon as the metal solution’s pH rises, which lowers the removal effectiveness.
The ratio of any given species is determined by the solution’s pH and the concentration of ions. The decrease in adsorption that is seen as pH rises might be the result of a reduction in the metal ions’ and sorbent’s electrostatic force of attraction. The solubility of the Cr2O72- ions increases with decreasing pH levels. The hydronium ions that surround the sorbent surface at very low pH values additionally strengthen the stronger attractive force of chromium ion interaction with the binding sites of the biosorbent. When anionic species such as HCrO41-, Cr2O72-, CrO42-, etc. occupy the adsorption sites, they decrease the speed at which these ions approach the sorbent surface. It could explain the sudden drop in adsorption seen above pH 4.0 32. The degree of amine group protonation in chitosan varies when the pH falls below 4.0. The primary cause of Cr(VI) adsorption is the chitosan’s NH3+ group. The functional groups’ degree of protonation in chitosan steadily dropped the elimination decreased when pH rose from 5.0 to 9.0. It is impossible to conduct sorption investigations at pH values higher than 7.0 because the solution starts to precipitate insoluble chromium hydroxide.
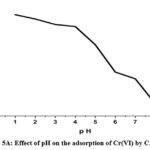 |
Figure 5A: Effect of pH on the adsorption of Cr(VI) by CAPAP |
Effect of Amount of adsorbent dosage
The effect of the dosage of the adsorbent on the removal efficacy could be determined using a 25 mg/L Cr(VI) solution with different CAPAP doses for 120 minutes at ambient temperature and the ideal pH of 4. It can be demonstrated that when 0.1 to 1 gram of CAPAP is added, the percent of Cr (VI) elimination rises. the percentage of Cr (VI) removal increases. Adsorption rises as a consequence of growing surface area and adsorption sites. There are many options for binding site adsorption on the CAPAP’s surface to adsorb Cr (VI). As a result of equilibrium being reached, the amount of Cr (VI) taken from the environment did not significantly alter.
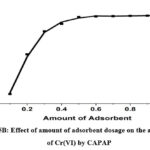 |
Figure 5B: Effect of amount of adsorbent dosage on the adsorption of Cr(VI) by CAPAP |
Effect of Contact Time
The effect of contact time on the percentage of Cr(VI) removed by CAPAP was investigated. With an initial adsorbent concentration of 0.5 g Cr(VI) and a contact time ranging from 20 to 180 minutes at 303 K temperature. It was determined that the greatest adsorption took place after 120 minutes, additionally, it was shown that the initial extension of contact duration increased the efficiency with which Cr (VI) is eliminated. This is because the CAPAP surface initially has more accessible adsorption sites, This results in their loading with Cr(VI) as the duration of contact rises.
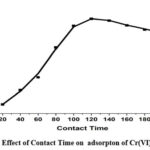 |
Figure 5C: Effect of Contact Time on adsorpton of Cr(VI) by CAPAP. |
Effect of Initial Cr(VI) Concentration
A range of metal ion concentrations between 10 ppm -100 ppm starting metal ion concentration was examined for the CAPAP ‘s ability to bind Cr(VI). Even though initial adsorption happens quickly, It has been observed that the extent of adsorption diminishes as the concentration of metal ions rises, specifically due to the increase in Cr(VI) ion concentration.
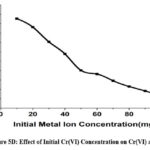 |
Figure 5D: Effect of Initial Cr(VI) Concentration on Cr(VI) adsorption. |
Adsorption Isotherm
The adsorption isotherm is determined by how the adsorbate and adsorbents interact. Adsorption isotherms are utilized to ascertain the degree of affinity between the adsorbate molecules and the surface properties of the adsorbent. Adsorption is believed to occur on a homogenous surface. The Langmuir adsorption isotherm states adsorbent Surface thickness is considered to be unimolecular, where the adsorption surface locations that have a similar attraction for adsorbate molecules are identical adsorption sites regarding the binding energies. [Langmuir (1888)].
The equation representing the Langmuir isotherm in linear form is as follows.
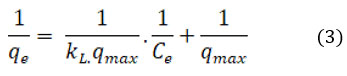
The affinity of CAPAP for Cr (VI) is shown by the Langmuir isotherm constant, where the maximal adsorption capacity that can be attained is expressed in mg/g as qmax. KL represents the maximal constant of adsorption (in L/mg). The maximum adsorption capacity value, denoted as m, was discovered to be 366.6 mg/g.
The best fit of the linear regression model to the data is shown in (Figure 6A). indicating R2, or linear regression coefficient, is higher at 0.993.
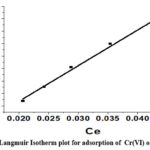 |
Figure 6A: Langmuir Isotherm plot for adsorption of Cr(VI) onto CAPAP |
The adsorbent surface is heterogeneous and the adsorbent sites are unevenly distributed, according to the Freundlich adsorption isotherm. (Freundlich, 1906)
An equation can be used to represent the Freundlich isotherm’s linear form

Freundlich constant is denoted by Kf that is used to determine an object’s capacity for adsorption, Where, “1/n” represents whether the adsorption process is favorable (0.1˂ 1/n ˂ 0.5) or adverse (1/n ˃ 2). R2 was found to be equal to 0.9792, while 0.3685, indicating positive adsorption, was found to be the value of 1/n. It is represented graphically in Fig. 6B.
The result is represented in Table 1. Upon examining the linear regression coefficient values, The Langmuir model provided the best description of Cr(VI) ion adsorption onto the CAPAP surface. A monolayer adsorption of Cr (VI) onto the surface of CAPAP was demonstrated.
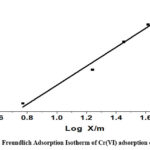 |
Figure 6B: Freundlich Adsorption Isotherm of Cr(VI) adsorption onto CAPAP |
Table 1: Study of Various Adsorption Isotherm models of Cr(VI) adsortpion
|
Types of Isotherm |
Parameters |
CAPAP |
|
Langmuir |
qm(mg/g) |
366.300366 |
|
KL (L/mg) |
0.048 |
|
|
RL |
0.455698 |
|
|
R2 |
0.993 |
|
|
Freundlich |
K |
60.72 |
|
1/n |
0.36859 |
|
|
R2 |
0.9792 |
Kinetic Study
To assess the rate of Cr (VI) adsorption on CAPAP, pseudo-first-order and pseudo-second-order kinetic models were applied. Equation (5) represents the pseudo-first order.
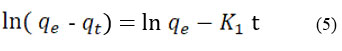
K1 (min-1) represents the equilibrium rate constant, while t denotes the adsorption capacity (mg/g) and is represented by qt. Equation (6) illustrates pseudo-second order.
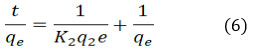
The equilibrium rate constant in this instance is K2 (g mg-1 min-1).
Table 2 contains the findings for the corresponding kinetic parameters. The fitting of two kinetic models to the equilibrium data for Cr(VI) is illustrated in Figures 6C and 6D.
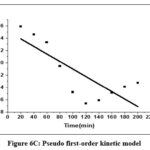 |
Figure 6C: Pseudo first–order kinetic model. |
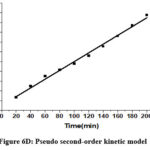 |
Figure 6D: Pseudo second–order kinetic model |
It was shown that a pseudo-second-order kinetic model described the Cr(VI) metal ion adsorption on CAPAP more accurately. Because its linear regression coefficient (R2 = 0.992) was greater. It implies that chemisorption is the method by which Cr (VI) metal ions adsorb onto CAPAP.
The rate-determining phase of adsorption is intraparticle diffusion, which supports the Weber-Morris model. Eq (7) represents the intraparticle diffusion model
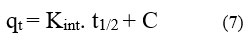
Intraparticle diffusion is more than just the rate-determining step intraparticle diffusion model within, the fact that the plot of qt vs t1/2 does not cross the origin is indicative of this. Kint, measured in mg-1 g-1, is the rate constant of intraparticles. The slope, denoted by the intraparticle rate constant Kint (mg-1 g-1 min), signifies the rate is influenced by factors other than diffusion, as indicated by the non-zero intercept.
 |
Figure 6E: Intraparticle diffusion model of Cr(VI) adsorption onto CAPAP |
Table 2: Kinetic data associated with Cr(VI) adsorption process.
|
Order of reaction |
Parameters |
CAPAP |
|
Pseudo first-order |
K1 (min-1) |
-3.055 x 10⁻⁴ |
|
R2 |
0.5851 |
|
|
Pseudo second-order
|
– |
– |
|
K2 (g mg-1 min-1) |
0.019 |
|
|
|
0.9925 |
|
|
Intrapartical diffusion |
Kint(mg g-1min1/2) |
0.13 |
|
|
R2. |
0.753 |
Thermodynamics of Adsorption
At temperatures of 298 K, 303 K, 308 K, and 313 K, the effect of temperature on Cr (VI) adsorption was investigated under thermodynamic assumptions. Eq. (8) represents the adsorption-free energy change (G0)
Using the ratio of Cr (VI) adsorbed on CAPAP to that in the solution, The determination of the equilibrium constant K was accomplished.
To obtain the entropy values, the Van’t Hoff Equation is utilized. This is described in Eq. (9).
As T denotes the absolute temperature, R represents the gas constant (8.314 J mol-1 K-1). By calculating the values of ΔH0 and ΔS0 from the ln K versus 1/T plot, the intercept and slope were utilized, respectively. The values were ascertained by employing the intercept and slope values of the ln K versus 1/T plot. (Figure 6F) provides an illustrative representation of the Van’t Hoff plot. Table 3 displays the thermodynamic parameters.
The adsorption process was spontaneous given that every temperature had a negative Gibb’s free energy shift. Adsorption is an exothermic process, as indicated by the negative enthalpy change. Increased uncertainty at the boundary between solid and liquid, however, was reflected in the increase in positive entropy that happens during the adsorption process.
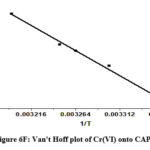 |
Figure 6F: Van’t Hoff plot of Cr(VI) onto CAPAP |
Table 3: Thermodynamic parameter of Cr(VI) on CAPAP
|
Parameters |
Temperature |
|
|
ΔG0 (K Jmol-1) |
298 K/250c |
-3.78 |
|
303 K/30 |
-4.00 |
|
|
308 K-35 |
-4.17 |
|
|
ΔH0 (K J mol-1) |
-8.08 |
|
|
ΔS0 (J mol-1 K-1) |
39.83 |
|
Table 4: Comparison of Cr(VI)’s maximum adsorption capability on different adsorbent.
|
Bioadsorbent |
Maximum capacity for adsorption(mg/g) |
References |
|
Chitosan |
22.09 |
33 |
|
“Tamarind seeds” |
29.70 |
34 |
|
Macadamia nutshell |
22.3 |
35 |
|
Lantana camara |
26.25 |
36 |
|
Corncob |
34.48 |
37 |
|
Coconut shell |
54.348 |
38 |
|
Alternanthera philoxeroides |
90.68 |
39 |
|
sewage sludge biochar |
205.18 |
40 |
|
Sugarcane beggase |
277.78 |
41 |
|
“Ulva lactuca” |
344.83 |
42 |
|
CAPAP |
366.3 |
This research |
Conclusion
In this study, Cr (VI) is adsorptively extracted from an aqueous solution. A significant part of Cr(VI)’s binding to the surface of CAPAP was played by its functional groups, which include amino, carboxyl, and hydroxyl groups. To extract Cr (VI) from an aqueous media, CAPAP exhibits a greater adsorption capacity of 366.3 mg/g, as shown by the qm values obtained from the data on the adsorption isotherm. The ideal pH level for Cr (VI) adsorption was 4.0. A total of 120 minutes were needed to reach the equilibrium state. 0.5g was determined to be the adsorbent dose. The adsorption process was most accurately described by the Langmuir isotherm model (R2 = 0.99). K, with the RL factor values indicating a strong binding at the active areas of the CAPAP. It was discovered that Langmuir monolayer adsorption was followed by Cr(VI) adsorption. The exothermic and impulsive nature of the adsorption process was indicated by the negative Gibbs free energy value. The positive value of entropy change indicates the increase in randomness during adsorption at a solid-liquid interface. As a result, CAPAP is thought to be one of the most effective and promising adsorbents and is a good choice.
Acknowledgment
This research was supported by Rashtrasant Tukadoji Maharaj Nagpur University, Nagpur, India. The authors are thankful to Rashtrasant Tukadoji Maharaj Nagpur University, Nagpur, India, and Shivaji Education Society Amravati’s Science College, Congress Nagar, Nagpur. This research is not funded by any agency.
Conflict of Interest
As the authors explicitly state, no conflicts of interest exist.
References
- Nomanbhay S. M. and Palanisamy K, Electron. J. Biotechnol., vol. 8, no. 1, pp. 43–53, 2005.
CrossRef - Zendehdel R. , Shetab-Boushehri S. V., Azari M. R., Hosseini V., and Mohammadi H., Drug Chem. Toxicol., vol. 38, no. 2, pp. 174–179, 2015.
CrossRef - Blumgart E., Tran Y., and Craig A., Depress. Anxiety, vol. 27, no. 7, pp. 687–692, 2010,
CrossRef - Kobya M., Demirbas E., Senturk E., and Ince M., Bioresour. Technol., vol. 96, no. 13, pp. 1518–1521, 2005.
CrossRef - Alinnor I.J, Fuel, vol. 86, no. 5–6, pp. 853–857, 2007.
CrossRef - Bicil Z.and Doğan M., Energy and Fuels, vol. 35, no. 12, pp. 10227–10240, Jun. 2021,
CrossRef - Heidarinejad Z., Dehghani M.H., Heidari M, Javedan G., Ali I., and Sillanpää M., Environmental Chemistry Letters, vol. 18, no. 2. Springer, pp. 393–415, Mar. 2020.
CrossRef - El-Sayed G.O, Yehia M.M, and Asaad A.A, Water Resour. Ind., vol. 7–8, pp. 66–75, Sep. 2014.
CrossRef - Akinhanmi T.F, Ofudje E.A, Adeogun A.I, Aina P., and Joseph I.M., Bioresour. Bioprocess., vol. 7, no. 1, Dec. 2020.
CrossRef - Bello O.S, Adegoke K.A, and Akinyunni O.O., Appl. Water Sci., vol. 7, no. 3, pp. 1295–1305, Jun. 2017.
CrossRef - Alhogbi B.G., Sustain. Chem. Pharm., vol. 6, pp. 21–25, Dec. 2017.
CrossRef - Song C., Wu S., Cheng M.,Tao P.,Shao M., and Gao G., Sustain., vol. 6, no. 1, pp. 86–98, 2014.
CrossRef - Li Z., Teng T.T., Alkarkhi A.F.M., Rafatullah M., and Low L.W., Water. Air. Soil Pollut., vol. 224, no. 4, Apr. 2013.
CrossRef - Bellahsen N., Varga G., Halyag N., Kertész S., Tombácz E., and Hodúr C., Int. J. Environ. Sci. Technol., vol. 18, no. 3, pp. 711–722, Mar. 2021.
CrossRef - Pavlić B., Naffati A., Hojan T., Vladić J., Zeković Z., and Vidović S., J. Food Process Eng., vol. 40, no. 4, Aug. 2017.
CrossRef - Gebreslassie Y.T, J. Anal. Methods Chem., vol. 2020, 2020.
CrossRef - El-Azazy M.., J. Chem., vol. 2019, 2019.
CrossRef - Ahmaruzzaman M.and Gupta V.K, Ind. Eng. Chem. Res., vol. 50, no. 24, pp. 13589–13613, Dec. 2011.
CrossRef - Druet J., El Achari A., and Isaad J, Res. Chem. Intermed., vol. 41, no. 11, pp. 8855–8876, 2015.
CrossRef - Malarvizhi R.,Venkateswarlu Y.,Ravi Babu V., and Syghana Begum S., Water Sci. Technol., vol. 62, no. 10, pp. 2435–2441, 2010.
CrossRef - Kahu S.S, Shekhawat A., Saravanan D., and Jugade R.M., Carbohydr. Polym., vol. 146, pp. 264–273, Aug. 2016
CrossRef - Vithalkar S., Jugade R.M., and Saravanan D., Aqua Water Infrastructure, Ecosyst. Soc., vol. 71, no. 10, pp. 1148–1158, 2022.
CrossRef - Bachmann S.A.L., Calvete T., and Féris L.A., Sci. Total Environ., vol. 767, p. 144229, 2021.
CrossRef - Gupta N., Kushwaha A.K., and Chattopadhyaya M.C, J. Taiwan Inst. Chem. Eng., vol. 43, no. 4, pp. 604–613, 2012.
CrossRef - Sadare O.O. and Daramola M.O, Chem. Eng. Commun., vol. 206, no. 3, pp. 333–345, 2019.
CrossRef - Gebrehawaria G.,Hussen A., and Rao V.M., Int. J. Environ. Sci. Technol., 2015.
- Deka J., Barman P., Singh A., Das H., and Bhattacharyya K.G., Sep. Sci. Technol., vol. 57, no. 17, pp. 2718–2734, 2022.
CrossRef - Kahu S.,Saravanan D., and Jugade R., Water Sci. Technol., vol. 70, no. 12, pp. 2047–2055, 2014.
CrossRef - Chowdhury S., Mishra R., Saha P., and Kushwaha P., Desalination, vol. 265, no. 1–3, pp. 159–168, 2011.
CrossRef - Hu Z., M. P. Srinivasan, and Y. Ni, Carbon N. Y., vol. 39, no. 6, pp. 877–886, 2001.
CrossRef - Mahmood T., Saddique M.T., Naeem A., Westerhoff P., Mustafa S., and Alum A., Ind. Eng. Chem. Res., vol. 50, no. 17, pp. 10017–10023, 2011.
CrossRef - Dönmez G.and Aksu Z., Process Biochem., vol. 38, no. 5, pp. 751–762, 2002.
CrossRef - Aydin Y. A.and Aksoy N.D., AIP Conf. Proc., vol. 1247, pp. 340–348, 2010.
- Gupta S. and Babu B.V., Chem. Eng. J., vol. 150, no. 2–3, pp. 352–365, 2009.
CrossRef - Pakade V.E., Nchoe O.B., Hlungwane L., and Tavengwa N.T., Water Sci. Technol., vol. 75, no. 1, pp. 196–206, 2017.
CrossRef - Ravulapalli S. and Ravindhranath K., Water Sci. Technol., vol. 78, no. 6, pp. 1377–1389, 2018.
CrossRef - Tang S., Chen Y., R. Xie R., Jiang W., and Jiang Y., Water Sci. Technol., vol. 73, no. 11, pp. 2654–2661, 2016.
CrossRef - Piriya R.S., Jayabalakrishnan R.M., Maheswari M., Boomiraj K., and Oumabady S., Water Sci. Technol., vol. 83, no. 5, pp. 1167–1182, 2021.
CrossRef - Fan L., Luo C., Sun M., Li X., Lu F., and Qiu H., Bioresour. Technol., 2012.
- Kang X., Xiao F., Zhou S., Zhang, Qiu L., and Wang L., Water Sci. Technol., vol. 86, no. 7, pp. 1821–1834, 2022.
CrossRef - El Nemr A., Aboughaly R.M., El Sikaily A., Ragab S. Masoud M.S., and Ramadan M.S., Biomass Convers. Biorefinery, vol. 13, no. 3, pp. 1581–1600, 2023.
CrossRef - El Nemr A., Shoaib A.G.M., El Sikaily A., Mohamed A.E.D.A., and Hassan A.F., Environ. Process., vol. 8, no. 1, pp. 311–332, 2021.
CrossRef

This work is licensed under a Creative Commons Attribution 4.0 International License.
About The Author
![]()
A New Edition of Web of Science
Journal Impact Factor
2022: 0.5
Five Year: 0.8
Journal is Indexed in

Cabells Whitelist
![]()


