Fly Ash-based Adsorption for Hexavalent Chromium Removal in Aqueous Systems: A Promising Eco-Friendly Technique
Sashi Yadav1 , Abhilasha Yadav2, Gunjan Goyal3, Monika Dhawan1, Vineet Kumar1, Azad Yadav1, Rajesh Dhankhar1, Nitu Sehrawat4 and Sunil Kumar Chhikara1*
1Maharshi Dayanand University, Rohtak, Haryana, India.
2Deenbandhu Chhotu Ram University of Science and Technology, Murthal Sonipat, Haryana, India.
3Department of Botany, University of Rajsthan, Jaipur, Rajasthan, India.
4Applied Science, Bharati Vidyapeeth’s Collage of Engineering, Pashchim Vihar, New-Delhi, India.
Corresponding Author E-mail: sashi.rs.uiet@mdurohtak.ac.in
DOI : http://dx.doi.org/10.13005/ojc/400123
Article Received on : 01 Dec 2024
Article Accepted on : 02 Feb 2024
Article Published : 14 Feb 2024
Reviewed by: Dr. Ali fadae
Second Review by: Dr. Prawit Nuengmatcha
Final Approval by: Dr. Hatice karaer yağmur
Heavy-metal pollution has been and continues to be significantly influenced by excessive Cr(VI) emissions; recently, there has been a lot of interest in the emergence of a low-cost, secure, and effective technology for removing of Chromium from wastewater. Fly ash has been used in the present study for Hexavalent chromium adsorption. Characterized for their elemental composition, functional groups, and surface morphology, the impacting aspects of the adsorbent were explored. In this study, the chromium adsorption parameters were optimized and the prediction models were strengthened using the response surface methodology (RSM) and box behnken design (BBD). High regression coefficient (R2>0.98), insignificant lack of fit (0.52), high F-value, and low P-value (0.05) were all indicators of the quadratic model's good agreement with the predicted values. Adsorbent dose of 200 mg/100 ml, initial Cr (VI) concentration of 20 mg/L, contact time of 90 min, and pH of 1.0 were the optimal adsorption conditions. The cost-effectiveness, ease of modification, and high efficiency of fly ash make it a promising candidate for large-scale applications in addressing chromium pollution in wastewater.
KEYWORDS:Adsorption; Fly Ash; Hexavalent Chromium; Pollution; Treatment
Download this article as:| Copy the following to cite this article: Yadav S, Yadav A, Goyal G, Dhawan M, Kumar V, Yadav A, Dhankhar R, Sehrawat N, Chhikara S. K. Fly Ash-based Adsorption for Hexavalent Chromium Removal in Aqueous Systems: A Promising Eco-Friendly Technique. Orient J Chem 2024;40(1). |
| Copy the following to cite this URL: Yadav S, Yadav A, Goyal G, Dhawan M, Kumar V, Yadav A, Dhankhar R, Sehrawat N, Chhikara S. K. Fly Ash-based Adsorption for Hexavalent Chromium Removal in Aqueous Systems: A Promising Eco-Friendly Technique. Orient J Chem 2024;40(1). Available from: https://bit.ly/499kH3U |
Introduction
Even though water is one of the planet’s most abundant natural resources, only approximately 1.0% of it may be consumed by human. As a result of population increase, industrialization, urbanization, and over exploitation of water resources, pressure on the world’s water supply is drastically increasing. By 2025, 2.8 billion people in 48 countries are anticipated to be affected by acute water scarcity, up from the current half a billion people who experience it year-round. In addition to the physical effects of water shortage, a variety of organic and inorganic pollutants are being produced and released into the environment as a result of multiple anthropogenic activities1.
Groundwater and surface water heavy metal pollution continue to constitute significant environmental problems. In addition, chromium compounds, which are widely in-use in a number of industry like leather tanning, leather tanning, printing, electroplating, polishing, and pigments industries as well as released from landfill leachate, lead to the discharge of Cr(VI) and thereby contributes to heavy-metal pollution. Unfortunately, the presence of heavy metals, even at low concentration, in potable water is harmful to human health. More precisely, large quantities of Cr(VI) are frequently found in the wastewater produced by these sectors and the leachate produced by landfills. The two main states of Cr are Cr(III) and Cr(VI). Even though humans only require trace amounts of Cr(III), which has negligible toxicity, Cr(VI) is extremely hazardous to them. In fact, the International Agency for Research on Cancer has classified Cr(VI) as a group I human carcinogen. Accordingly, any process that may turn Cr(VI) into Cr(III) is highly desired2.
The adsorption method has drawn much attention considering its low cost and great efficacy for removing Cr(VI) from water, along with electrochemical oxidation, ion exchange/complexation and biological treatment. Metal oxidants, biomass, fly ash, clay minerals, etc. are common adsorbents25.
There are now two main ways to lower the Cr(VI) content of water. First, reducing chemicals are added to convert the highly poisonous Cr(VI) to its less toxic form, Cr(III). Cr(III) can eventually oxidize back to Cr(VI) in the presence of oxides and dissolved oxygen, though this process fails to eliminate Cr from the system3. Additionally, it is now quite expensive to remove the Cr precipitate. The second method uses mineral adsorbents like bentonite, montmorillonite, and medical stone along with biomass adsorbents like peanut shells, rice straw, fly ash, banana peels, and wheat straw to absorb Cr(VI) and lower its concentration in wastewater4,5. This technique has a high effectiveness of adsorption and is simple to use28. However, it is insufficient to lessen Cr(VI) toxicity.
The production of fly ash (FA) is harmful to the environment. FA, a byproduct of the burning of coal in power plants, is utilized in cementitious composites, geopolymer concrete, filler in rubber and plastic, etc. as an additional cementitious ingredient. However, the rate of its generation greatly outpaces the rate of consumption. It is regarded as a waste substance, producing 600 million tonnes annually, of which 80% are disposed in landfills and ash dams6.
One of the main causes of India’s expanding carbon footprint is FA, the main solid waste released from coal-fired power stations. Additionally, incorrect FA disposal results in poisoned habitats and ruined lands. FA is utilised for water purification due to its high porosity, enormous surface area, and remarkable properties. It is also inexpensive, simple to modify, and highly effective7. The majority of the particles, which range in size from 1 to 100 m, are made up of the oxides SiO2, Al2O3, CaO, and Fe2O3. By complexation, ion exchange, and chemical bonding, the hydroxyl groups attached to these oxides bind metal ions8. The removal efficiencies of Hg(II), Zn(II), Ni, Pb, Fe, Mn, Al, Cr(VI), and COD have been significantly improved by fly ash, according to recent studies. Therefore, FA can be applied for possible purposes rather than being just discarded9-11. Its potential for the recovery of water contaminated with heavy metals has been reactivated attributed to its excellent adsorption and affordable abundance. As a result, FA, Cr(VI) can be eliminated from wastewater while also having its environmental toxicity decreased. The advantages of using fly ash in the adsorption of chromium encompass its abundance, cost-effectiveness, environmental benefits, versatile modification capabilities, and effective adsorption capacity, making it a promising material for water treatment applications.
The present study examined an adsorption technique to remove Cr(VI) from aqueous solution.
Experimental details
The chemical and regents used in the study such as potassium dichromate, 1, 5-diphenyl carbazide, sulphuric acid, sodium hydroxide 99% pure. All chemicals used were of pure analytical grade during the experiments. Fly ash was collected from Panipat Thermal Power Station (Khukhrana, Panipat, Haryana. Coordinates: 29°23′50″N 76°52′52″E). Raw fly ash sample was directly used as adsorbent in present study.The stock solution of potassium dichromate is made by dissolving 2.828g of powdered potassium dichromate, and reagent in 1L double distilled water.
Fly ash characterized using SEM, EDX and FTIR. SEM used for morphological study, EDX for elemental composition and FTIR used for the analysis of functional group present on the adsorbent’s surface. FTIR for function group using Bruker Alpha model with OPUS software. Zeta potential using Malvern zeta potential analyzer. Surface morphology was analyzed using FE- SEM (Field Emission Scanning Electron Microscopy) 7610F Plus/ JEOL and elemental analysis by EDS.
In this study, the powerful technology of scanning electron microscopy (SEM) was utilized to investigate the morphological characteristics of fly ash. SEM offers comprehensive insights into the surface topography and structure of the adsorbent material through high-resolution imaging. SEM enables the observation of particle size, shape, and surface imperfections in the context of fly ash characterisation.
The elemental composition of fly ash is ascertained in this work by using Energy-Dispersive X-ray Spectroscopy (EDX). Using an electron distribution cross (EDX), a material’s concentration and presence of different elements can be quantitatively determined by measuring the X-rays that are released from the sample when it is subjected to an electron beam. By identifying the fundamental components of fly ash, this approach provides important information about its chemical makeup.
Fourier-Transform Infrared Spectroscopy (FTIR), the functional groups on the fly ash adsorbent’s surface are examined. Finding chemical bonds and molecular vibrations with FTIR is especially helpful in determining the types of functional groups that are present on a material’s surface, both organic and inorganic.
Batch studies were conducted to determine the optimum combination of the following variables: adsorbent dose (50-800 mg), pH (1-8), time (30-120min), concentration (10-80mg/L), and temperature (5-55°C). The experimental design of the BBD of RSM using Expert Design software 8.6 then employed the batch optimized condition. 100 ml of synthetic solution (20 mg/L), 90 minutes of contact time, and a temperature of 25 °C were utilized to collect the data for optimization. A UV-VIS Spectrophotometer was used to calculate the concentration of Cr(VI) ion present.
The adsorption efficiency and adsorption capacity were calculated using the following formulas:
Where Ci and Cf is initial and equilibrium concentration of Cr(VI) ion in solution (mg/L), V is volume (ml), and m mass of sorbent in mg.
RSM model of Expert Design 8.6 version was used to conduct the batch process Hexavalent chromium ion adsorption from synthetic solution. Response Surface Methodology (RSM) is a statistical technique used to examine the relationship between a response of interest and several variables in order to optimize and analyse complicated processes. RSM is used in the current work to determine the ideal conditions for maximal adsorption efficiency in the context of hexavalent chromium (Cr(VI)) adsorption utilizing fly ash. RSM entails planning a series of tests, analyzing the model to find the ideal parameter values, and then fitting a mathematical model to the experimental data. BBD is used to create a series of experiments with three levels of each variable in the context of the chromium adsorption study, enabling the investigation of quadratic response surfaces. The low, middle, and high values of the variables under study are used to choose which three levels to use. In order to effectively estimate the reaction and identify the ideal circumstances for chromium adsorption, BBD systematically modifies these levels.
By minimizing the number of experiments, RSM was utilized in this study to reduce or completely eliminate systematic errors12. In order to determine the association between the independent factors and the response, the Hexavalent chromium adsorption experiments were carried out using the Box-Behnker Design (BBD). In order to predict the optimal values of responses, BBD can also optimize the settings for the appropriate factors. In order to obtain the best values for the selected variables, the regression equation must be solved at the favorable outcome of the process response, which serves as the optimization condition. Table 1 lists the independent variables (pH, conc, dose, time, and temperature) that were used for BBD and their higher, mean, and lower ranges. By providing the optimization value as shown in table 1 BBD gives 46 runs using software and then the experiment performed for 46 runs and the values of resulted obtained is compared with the software predicted values.Table 2 shows that 46 experiment runs were conducted using BBD.
Table 1: Experimental range and levels of independent variables
|
|
Fly Ash |
||
|
Variables |
Low |
Middle |
High |
|
pH |
1 |
2 |
3 |
|
Adsorbent dose (mg) |
100 |
200 |
300 |
|
Conc(mg/L) |
10 |
20 |
30 |
|
Time (min) |
60 |
90 |
120 |
|
Temperature (°C) |
15 |
25 |
35 |
Table 2: BBD Design Matrix for model.
|
|
Factor 1 |
Factor 2 |
Factor 3 |
Factor 4 |
Factor 5 |
Adsorption % |
|
|
Run |
A:pH |
B:Adsorbent dose |
C:Conc |
D:Time |
E:Temp |
Observed |
Observed |
|
1 |
2.00 |
200.00 |
30.00 |
120.00 |
25.00 |
79.1 |
79.9 |
|
2 |
2.00 |
200.00 |
30.00 |
90.00 |
15.00 |
81.4 |
80.8 |
|
3 |
2.00 |
300.00 |
20.00 |
90.00 |
35.00 |
82.4 |
83.35 |
|
4 |
2.00 |
100.00 |
10.00 |
90.00 |
25.00 |
80.9 |
82.38 |
|
5 |
1.00 |
300.00 |
20.00 |
90.00 |
25.00 |
85.4 |
86.17 |
|
6 |
2.00 |
200.00 |
20.00 |
90.00 |
25.00 |
83.9 |
82.38 |
|
7 |
2.00 |
200.00 |
30.00 |
90.00 |
35.00 |
79.9 |
78.82 |
|
8 |
3.00 |
200.00 |
20.00 |
90.00 |
15.00 |
62.4 |
61.58 |
|
9 |
2.00 |
300.00 |
20.00 |
120.00 |
25.00 |
83.4 |
82.23 |
|
10 |
1.00 |
200.00 |
20.00 |
90.00 |
35.00 |
82.4 |
83.43 |
|
11 |
2.00 |
300.00 |
10.00 |
90.00 |
25.00 |
84.3 |
84.30 |
|
12 |
3.00 |
100.00 |
20.00 |
90.00 |
25.00 |
61.5 |
61.17 |
|
13 |
3.00 |
200.00 |
20.00 |
60.00 |
25.00 |
61 |
61.39 |
|
14 |
1.00 |
200.00 |
20.00 |
120.00 |
25.00 |
83.6 |
82.80 |
|
15 |
2.00 |
200.00 |
20.00 |
90.00 |
25.00 |
82 |
82.38 |
|
16 |
2.00 |
100.00 |
20.00 |
60.00 |
25.00 |
81.6 |
81.29 |
|
17 |
2.00 |
100.00 |
20.00 |
90.00 |
15.00 |
82.7 |
81.98 |
|
18 |
1.00 |
200.00 |
20.00 |
60.00 |
25.00 |
84.9 |
83.8 |
|
19 |
3.00 |
200.00 |
10.00 |
90.00 |
25.00 |
63 |
62.48 |
|
20 |
2.00 |
200.00 |
20.00 |
90.00 |
25.00 |
83.5 |
82.38 |
|
21 |
2.00 |
200.00 |
20.00 |
90.00 |
25.00 |
82.5 |
82.38 |
|
22 |
2.00 |
200.00 |
20.00 |
120.00 |
35.00 |
79.6 |
79.41 |
|
23 |
1.00 |
200.00 |
30.00 |
90.00 |
25.00 |
82.6 |
82.90 |
|
24 |
1.00 |
200.00 |
10.00 |
90.00 |
25.00 |
85.1 |
83.97 |
|
25 |
2.00 |
100.00 |
20.00 |
120.00 |
25.00 |
82.1 |
80.56 |
|
26 |
1.00 |
200.00 |
20.00 |
90.00 |
15.00 |
83.9 |
83.51 |
|
27 |
2.00 |
200.00 |
20.00 |
120.00 |
15.00 |
80.2 |
80.95 |
|
28 |
3.00 |
200.00 |
20.00 |
120.00 |
25.00 |
59.1 |
59.76 |
|
29 |
2.00 |
300.00 |
20.00 |
60.00 |
25.00 |
84.1 |
84.15 |
|
30 |
2.00 |
200.00 |
10.00 |
90.00 |
35.00 |
83.1 |
82.23 |
|
31 |
3.00 |
200.00 |
20.00 |
90.00 |
35.00 |
59.3 |
59.89 |
|
32 |
2.00 |
200.00 |
30.00 |
60.00 |
25.00 |
79.9 |
79.34 |
|
33 |
2.00 |
100.00 |
20.00 |
90.00 |
35.00 |
80.9 |
80.19 |
|
34 |
2.00 |
200.00 |
10.00 |
60.00 |
25.00 |
83.6 |
83.60 |
|
35 |
2.00 |
200.00 |
20.00 |
60.00 |
35.00 |
81.1 |
81.39 |
|
36 |
2.00 |
200.00 |
20.00 |
90.00 |
25.00 |
81 |
82.38 |
|
37 |
2.00 |
300.00 |
20.00 |
90.00 |
15.00 |
82.4 |
83.34 |
|
38 |
1.00 |
100.00 |
20.00 |
90.00 |
25.00 |
81.9 |
83.20 |
|
39 |
2.00 |
200.00 |
20.00 |
60.00 |
15.00 |
80.4 |
81.62 |
|
40 |
2.00 |
200.00 |
10.00 |
120.00 |
25.00 |
78.9 |
80.33 |
|
41 |
2.00 |
300.00 |
30.00 |
90.00 |
25.00 |
83 |
82.33 |
|
42 |
3.00 |
200.00 |
30.00 |
90.00 |
25.00 |
58 |
58.92 |
|
43 |
2.00 |
200.00 |
10.00 |
90.00 |
15.00 |
82.4 |
82.02 |
|
44 |
2.00 |
200.00 |
20.00 |
90.00 |
25.00 |
81.4 |
82.38 |
|
45 |
2.00 |
100.00 |
30.00 |
90.00 |
25.00 |
78.9 |
79.72 |
|
46 |
3.00 |
300.00 |
20.00 |
90.00 |
25.00 |
63.6 |
62.73 |
Result and Discussion
Characterization of adsorbents
SEM
Fly ash can be thoroughly examined using SEM31, which provides information on the material’s morphological characteristics, particle size distribution, surface roughness, and aggregation state. The morphological structure of fly ash was shown in the Fig 1. The size of fly ash was ranged around 100nm. SEM reveals the agglomeration state of fly ash particles, indicating loosely dispersed particles.
The EDS of fly ash was done for determining the chemical composition. Its analysis creates data as a spectra, with peaks corresponding to the components of the analyzed sample. Its spectrum shows intense peaks of oxygen, silicon, aluminium, and iron. The lower peaks in the spectrum were copper, zinc, potassium, and calcium (Fig. 2). The atomic percentage in fly ash represented by EDS spectrum were O (51%), C (26%), Si (5.4%), Al (2.4%) and Fe (12.4%), respectively.
FTIR spectrum is depicting the function groups present in fly ash (Fig. 3). The adsorption at 1083cm-1 is due to the vibration of the Fe-O bond, while the band near 901cm-1 is attributed to the asymmetric stretching vibration of T-O (T = Si, Al) bonds13. The existence of hydroxyl compounds is suggested by the newly created bond in the fly ash spectra at 3522cm-1, which corresponds to the O-H stretching vibration and deformation vibration bonds, respectively. The presence of Al atoms in the tetrahedral forms of the silica frame work may have contributed to the formation of the strong peak at 901cm-1, as shown in this spectrum14. The fly ash’s quartz content correlates with the strong band for fly ash that is found at 775, 753, and 7147cm-1. The band that appears between 800 cm-1 and 500 cm-1 is entirely dependent on the tetrahedral vibrations produced by what are known as secondary building units (SBU) and pieces of the alumina silicate system. These bands exhibit the typical properties of double or single rings as well as the TO4 (T = Si, Al) tetrahedral connections, according to the material’s structure15.
The peak, which was located at 1545cm-1, was connected to the H-O-H bending vibration and might have been caused by free water. In addition to increasing the capacity for adsorbing Cr(VI), the simultaneous loss of water from the fly ash surface and structural skeleton during calcination reduced the water film’s barrier to contaminant adsorption. A shift in all bands revealed the involvement of all functional groups in the interaction between heavy metal ions and the surface of the adsorbent.
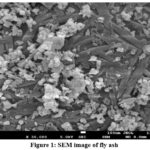 |
Figure 1: SEM image of fly ash |
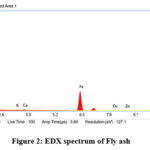 |
Figure 2: EDX spectrum of Fly ash. |
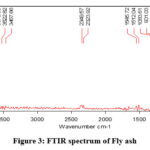 |
Figure 3: FTIR spectrum of Fly ash |
Where Cr(VI) ions chemically bond, active sites appear as surface irregularities like pits, fissures, or exposed reactive sites. The adsorption of Cr(VI) ions on the fly ash surface may be facilitated by certain elements or functional groups, such as oxygen-containing groups, which are linked to active sites. Functional groups such as hydroxyl (-OH), carboxyl (-COOH), or other oxygen-containing groups are examples of active sites for Cr(VI) adsorption. Through chemical interactions, these groups create complexes with Cr(VI) ions. Active sites are created by porous structures seen by SEM, allowing Cr(VI) ions to physically adsorb or permeate into the fly ash matrix. The adsorption of Cr(VI) ions is facilitated by electrostatic interactions at charged sites.
The XRD30 examination indicate a strong correlation between the compressive strength and the amorphous products of reaction. It is demonstrated that XRD is a potent technique that can be utilised to investigate how process variables affect variations in the glassy phase content of fly ash as well as the development of reaction products in alkali activated siliceous fly ash29.
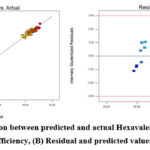 |
Figure 4: (A) Correlation between predicted and actual Hexavalent Chromium removal efficiency, (B) Residual and predicted values |
Statistical analysis
In this study, Hexavalent chromium was removed from synthetic solutions using fly ash, and the interactive effects of independent components were evaluated using the Box-Behnker design (BBD) model. The main benefit of RSM over factor-at-a-time techniques is its capacity to investigate the interactions between several variables concurrently, resulting in a more accurate and efficient optimisation. Modelling the response surface and optimising many parameters with fewer experimental runs is possible with Box-Behnken Design (BBD), a particular experimental design technique within RSM. When there are moderately many factors involved and the objective is to reduce the number of experimental trials while maintaining a sufficient level of response surface capture, (BBD) are especially helpful. The actual and predicted values of 46 runs (Table-2) were determined to be suited to a reliable quadratic model based on the summary analysis fit. Additionally, it was established that the Cr(VI) values acquired from the trials were proportionate to the quadratic model through calculations in Equation, which represent the models with the coded parts. It was therefore researched and evaluated because it was the model selected for the current study. Y represents the empirical relationship between the independent variable, the response, and the amount of Cr(VI) ion sorbed per unit mass of adsorbent. The positive effect of a factor in equation, which shows that increasing factor level enhances the adsorption efficiencies of the pollutants under consideration, reveals the direct impact of increase in factor level on adsorption efficiency16. However, the negative effect of the component states that as the degree of the factor increases, efficiency does not. The equation demonstrates that the coefficients of the factors disclose the significance of each factor; based on the coefficients obtained, the first chromium compounds had the most significance in the elimination of Hexavalent chromium.
Y =+82.38-11.37A+1.13 B-1.16 C-0.66D-0.44E-0.35 AB-0.63AC-0.15AD-0.40 AE+0.18BC-0.30BD
+0.45BE+0.97CD-0.55 CE-0.32DE-9.59A2+0.53B2-0.73 C2 -0.85D2-0.69E2
A greater value of F indicates that the regression equation can explain the majority of the response’s variables, and probability values (p values) under 0.005 are regarded as statistically significant, according to Analysis of Variance (ANOVA 22,23) (Table 3). A second-order polynomial equation would successfully represent the relationship between the response variable, or adsorption %, and many independent parameters such pH, resin dose, Cr(VI) ion concentration, temperature, and contact time, according to the ANOVA results17.
The quadratic model was found to significantly explain the Cr(VI) ion adsorption mechanism18. The coefficient term significance is impacted by the p and F values. As opposed to an insignificant term, a significant model term has a p value (prob > F) 0.0519. Model terms A, B, C, D, A2, and D2 had an impact on the response Y (% removal of Cr(VI)). The model’s F value of 110.67 indicates that the terms are significant. As the coefficient of determination, the modified R2 value (0.97) is in good agreement with the projected R2 value (0.96). The outcomes further confirmed the suitability of the selected quadratic model.
Table 4 shows model summary statistics and lack-of-fit tests. The coefficient of regression was used to assess how well the regression model fit the data (Table 5). The noise value to ratio of the model was determined to be in a desired range20 as evidenced by the standard deviation being found to be 1.18 and the adeq accuracy ratio being 34.32 greater than 4. For the purpose of estimating the regression model’s accuracy, parity and residual plots were utilized (Fig. 4).
The majority of the results point towards a straight line, indicating that both the predicted value and the actual data for the experimental analysis of Hexavalent chromium removal are equivalent (Fig. 4A). The largest difference between the actual and anticipated Cr(VI) adsorption in Fig. 4B is less than 4%, and there is a strong link between the two.
Table 3: Analysis of Variance(ANOVA) results for Cr(VI) removal
|
Source |
Sum of Squares |
Df |
Mean Square |
FValue |
p-value |
|
|
Model |
3056.51 |
20 |
152.83 |
110.67 |
< 0.0001 |
significant |
|
A-pH |
2067.98 |
1 |
2067.98 |
1497.52 |
< 0.0001 |
|
|
B-Adsorent dose |
20.48 |
1 |
20.48 |
14.83 |
0.0007 |
|
|
C-Conc |
21.39 |
1 |
21.39 |
15.49 |
0.0006 |
|
|
D-Time |
7.02 |
1 |
7.02 |
5.09 |
0.0331 |
|
|
E-Temp |
3.15 |
1 |
3.15 |
2.28 |
0.1435 |
|
|
AB |
0.49 |
1 |
0.49 |
0.35 |
0.5567 |
|
|
AC |
1.56 |
1 |
1.56 |
1.13 |
0.2976 |
|
|
AD |
0.090 |
1 |
0.090 |
0.065 |
0.8006 |
|
|
AE |
0.64 |
1 |
0.64 |
0.46 |
0.5023 |
|
|
BC |
0.12 |
1 |
0.12 |
0.089 |
0.7683 |
|
|
BD |
0.36 |
1 |
0.36 |
0.26 |
0.6141 |
|
|
BE |
0.81 |
1 |
0.81 |
0.59 |
0.4509 |
|
|
CD |
3.80 |
1 |
3.80 |
2.75 |
0.1095 |
|
|
CE |
1.21 |
1 |
1.21 |
0.88 |
0.3582 |
|
|
DE |
0.42 |
1 |
0.42 |
0.31 |
0.5851 |
|
|
A2 |
802.91 |
1 |
802.91 |
581.43 |
< 0.0001 |
|
|
B2 |
2.41 |
1 |
2.41 |
1.74 |
0.1989 |
|
|
C2 |
4.59 |
1 |
4.59 |
3.32 |
0.0803 |
|
|
D2 |
6.31 |
1 |
6.31 |
4.57 |
0.0426 |
|
|
E2 |
4.18 |
1 |
4.18 |
3.02 |
0.0944 |
|
|
Residual |
34.52 |
25 |
1.38 |
|
|
|
|
Lack of Fit |
27.93 |
20 |
1.40 |
1.06 |
0.5253 |
not significant |
|
Pure Error |
6.59 |
5 |
1.32 |
|
|
|
|
Cor Total |
3091.03 |
45 |
|
|
|
|
Table 4: Lack-of-fit stastiatics and model summary statistics
|
Lack-of-fit tests |
||||||
|
Source |
Sum of square |
Df |
Mean square |
F-value |
P value |
|
|
Linear |
964.43 |
35 |
27.56 |
20.91 |
0.0015 |
|
|
2FI |
954.92 |
25 |
38.20 |
28.99 |
0.0007 |
|
|
Quadratic |
27.93 |
20 |
1.40 |
1.06 |
0.5253 |
Suggested |
|
Cubic |
7.34 |
5 |
1.47 |
1.11 |
0.4543 |
Aliased |
|
Pure Error |
6.59 |
5 |
1.32 |
|
|
|
|
Model summary statistics |
||||||
|
Linear |
4.93 |
0.6859 |
0.6466 |
0.5791 |
1300.91 |
|
|
2FI |
5.66 |
0.6889 |
0.5334 |
0.2002 |
2472.06 |
|
|
Quadratic |
1.18 |
0.9888 |
0.9799 |
0.9608 |
121.23 |
Suggested |
|
Cubic |
1.18 |
0.9955 |
0.9797 |
0.8450 |
479.25 |
Aliased |
Table 5: Standard Fit Statistics
|
Std. Dev. |
1.18 |
R-Squared |
0.9888 |
|
Mean |
78.44 |
Adj R-Squared |
0.9799 |
|
C.V. % |
1.50 |
Pred R-Squared |
0.9608 |
|
PRESS |
121.23 |
Adeq Precision |
34.320 |
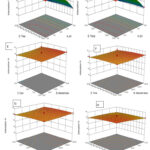 |
Figure 5: 3D surface plots showing the interactions between independent variables to response: |
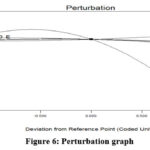 |
Figure 6: Perturbation graph |
Interactive effect of variables and 3D response surface plots
To assess the individual and combined effects of various independent factors (pH, dose, conc, time, and temperature) on response (% Cr(VI) removal), 3D response plots were developed21. The response surface plot (Figs. 5A–J) shows the removal of Hexavalent chromium as a percentage when three variables were held constant and the other two varied within the experimental range. The main factor affecting the availability of active sites for metal sorption on an adsorbent’s surface is pH, which is related to the ionisation state of the functional group of the sorbent and metal chemistry in the aqueous media19,24. Figure 5A illustrates that pH and sorbent dosage affect the amount of Hexavalent chromium ion removal. The percentage of Cr(VI) ions removed increases with dosage and declines with pH; pH 1 with 300 mg of resin removed 85.4% of Cr(VI) ions, whereas pH 3 with 300 mg of dosage had a 63.6% removal efficiency. Increase in both variables reduces the removal of Cr(VI), as shown in Fig. 5B with pH and initial Cr(VI) ion concentration. A 3Dimensional graph for contact time and pH is shown in Fig. 5C. At 1 pH and 60 minutes, only 84.9% removal was successful, and that percentage increased as the time passed. When the temperature was 15°C and the pH was 1, almost 83.9% removal was accomplished (Fig. 5D). Overall, as per the ANOVA result pH is the major factor which affect the adsorption capacity.
Initial ion concentration and dosage effect was shown (Fig 5E) on adsorption capacity. The adsorption capacity increases as the dosage of adsorbent increases. Figure 5F depicts the effect of adsorbent dose and contact time, adsorption reached to its maximum, when both the variables increase. Contact time highly effect the adsorption process20 as shown (Fig. 5H and 5J). Temperature also play important role in Cr(VI) adsorption; adsorption increases upto 25°C temperature than no significant increase was observed. Figure 5G shows, interactive effect of temperature and fly ash dose on adsorption study. At 30mg/L concentration with temperature of 15°C shows removal of 81.4% and at 30mg/L with 35°C temperature results in 79.9% removal efficiency (Fig. 5I). Effect of time with temperature was shown in fig 5J.
For processes involving numerous responses, optimization can be utilized to produce the ideal result for the variables being considered simultaneously. For all of the runs examined in these conditions, numerical optimization aims to get the maximum responses. The minimal adsorbent dosage and the higher initial Cr(VI) ion concentration for the maximal response are the condition selected. The optimum condition such as 2pH, adsorbent dosage 200mg, Cr(VI) conc 20mg/L, 90minute of contact time and 25°C temperature with 83.9% of removal efficiency 24. Fig 6 showing the perturbation plot for these constrains and depicted that factor (A) pH significantly affecting the adsorption study. The more curved parameter (A) depicts its potential impact as shown in Fig-6 and parameter A represents pH.
Garlic stem26 adsorbent efficiency for hexavalent Chromium removal was 72%, green tea leaves27 having 99%; whereas present study shows 85%.
Conclusion
The experiment work has detailed the probability of RSM for analyzing the interactive effect of different independent factors on Cr(VI) sorption using fly ash. Fly ash has high ability to bind Cr(VI) in aqueous solution and it is useful for industrial and domestic wastewater treatments also. The fly ash’s quartz content correlates with the strong band for fly ash that is found at 775, 753, and 7147cm-1.and SEM used for morphological structure and size of fly ash particles found around 100nm.The atomic percentage in fly ash represented by EDS spectrum were O (51%), C (26%), Si (5.4%), Al (2.4%) and Fe (12.4%), respectively. The BBD of RSM model shows higher removal(85.4%) of Cr(VI) (run 5) at the optimum conditions such as pH 1, 300mg adsorbent dose, 20mg/L concentration, 90minute of contact time and 25°C temperature . The present study shows significant model study and lack of fit not significant; (R2 0.98) higher the value of correlation coefficient depicted that the experimental data fit well to the model as per the ANOVA results. The major control on the adsorption of Cr(VI) was by pH and dosage of fly ash with p value <0.0001 in the model. The higher the removal efficiency of fly ash shows its scale-up for industrial purpose. Investigating the long-term stability and regeneration potential of fly ash, coupled with pilot-scale studies, will validate its practical applicability. Exploring modifications to enhance specific adsorption sites and extending the study to real-world scenarios with diverse water compositions will broaden its practical relevance for wastewater treatment. Additionally, the long-term stability and regeneration potential of fly ash need extensive exploration for sustained industrial use. Further, the study’s extrapolation to larger-scale applications should consider potential challenges in maintaining optimal conditions and economic feasibility.
Acknowledgement
Authors are thankful to Central Instrumentation Laboratory, MDU, Rohtak.
Conflict of Interest
There is no conflict of interest.
Funding Sources
There are no funding sources.
References
- Farah, A. A. (2023). The use of agro-waste-based adsorbents as sustainable, renewable, and low-cost alternatives for the removal of ibuprofen and carbamazepine from water. Heliyon.
- Jiang, X., Fan, W., Li, C., Wang, Y., Bai, J., Yang, H., & Liu, X. (2019). Removal of Cr (VI) from wastewater by a two-step method of oxalic acid reduction-modified fly ash adsorption. RSC advances, 9(58), 33949-33956.
CrossRef - Liu, G., Yu, R., Lan, T., Liu, Z., Zhang, P., & Liang, R. (2019). Gallic acid-functionalized graphene hydrogel as adsorbent for removal of chromium (iii) and organic dye pollutants from tannery wastewater. RSC advances, 9(46), 27060-27068.
CrossRef - Ravina, Yadav, S., Chhikara, S. K., (2023). Usability of Rice Straw as Biosorbent for the Removal of Phosphate from Aqueous Solution: Isotherms, Kinetics and Thermodynamics, Asian Journal of Chemistry, 2 (35), 461-467,
CrossRef - Wang, J., & Guo, X. (2020). Adsorption kinetic models: Physical meanings, applications, and solving methods. Journal of Hazardous materials, 390, 122156.
CrossRef - Murali, M., Mohammed, B. S., Abdulkadir, I., Liew, M. S., & Alaloul, W. S. (2021). Utilization of crumb rubber and high-volume fly ash in concrete for environmental sustainability: RSM-based modeling and optimization. Materials, 14(12), 3322
CrossRef - .Jayakumar, R., Rajasimman, M., & Karthikeyan, C. (2014). Sorption of hexavalent chromium from aqueous solution using marine green algae Halimeda gracilis: Optimization, equilibrium, kinetic, thermodynamic and desorption studies. Journal of Environmental Chemical Engineering, 2(3), 1261-1274.
CrossRef - Jiang, C. L., Wang, R., Chen, X., Zheng, L. G., & Cheng, H. (2021). Preparation of chitosan modified fly ash under acid condition and its adsorption mechanism for Cr (VI) in water. Journal of Central South University, 28(6), 1652-1664.
CrossRef - Sahoo, P. K., Tripathy, S., Panigrahi, M. K., & Equeenuddin, S. M. (2013). Evaluation of the use of an alkali modified fly ash as a potential adsorbent for the removal of metals from acid mine drainage. Applied Water Science, 3, 567-576.
CrossRef - Zhang, H., Gan, S., Sun, H., Yang, H., & Xie, S. (2022). Fly‐Ash‐Based Hierarchical MCM‐41 Molecular Sieve as an Efficient Adsorbent for Methylene Blue Removal from Wastewater over a Wide pH. ChemistrySelect, 7(41), e202203213.
CrossRef - Liu, F., Huang, X., Zhao, H., Hu, X., Wang, L., Zhao, X., … & Ji, P. (2021). Stabilization of Cd and Pb in the contaminated soils by applying modified fly ash. Soil Ecology Letters, 3, 242-252.
CrossRef - Binaeian, E., Maleki, S., Motaghedi, N., & Arjmandi, M. (2020). Study on the performance of Cd2+ sorption using dimethylethylenediamine-modified zinc-based MOF (ZIF-8-mmen): optimization of the process by RSM technique. Separation Science and Technology, 55(15), 2713-2728.
CrossRef - Wang, Z., Shen, R., Ji, S., Xie, L., & Zhang, H. (2021). Effects of biochar derived from sewage sludge and sewage sludge/cotton stalks on the immobilization and phytoavailability of Pb, Cu, and Zn in sandy loam soil. Journal of Hazardous Materials, 419, 126468.
CrossRef - Movasaghi, Z., Rehman, S., & ur Rehman, D. I. (2008). Fourier transform infrared (FTIR) spectroscopy of biological tissues. Applied Spectroscopy Reviews, 43(2), 134-179.
CrossRef - Javadian, H., Ghorbani, F., Tayebi, H. A., & Asl, S. H. (2015). Study of the adsorption of Cd (II) from aqueous solution using zeolite-based geopolymer, synthesized from coal fly ash; kinetic, isotherm and thermodynamic studies. Arabian Journal of Chemistry, 8(6), 837-849.
CrossRef - Dargahi, A., Samarghandi, M. R., Shabanloo, A., Mahmoudi, M. M., & Nasab, H. Z. (2021). Statistical modeling of phenolic compounds adsorption onto low-cost adsorbent prepared from aloe vera leaves wastes using CCD-RSM optimization: effect of parameters, isotherm, and kinetic studies. Biomass Conversion and Biorefinery, 1-15.
CrossRef - Singh, R., & Bhateria, R. (2020). Optimization and experimental design of the Pb2+ adsorption process on a nano-Fe3O4-based adsorbent using the response surface methodology. ACS omega, 5(43), 28305-28318.
CrossRef - Guo, C., Ding, L., Jin, X., Zhang, H., & Zhang, D. (2021). Application of response surface methodology to optimize chromium (VI) removal from aqueous solution by cassava sludge-based activated carbon. Journal of Environmental Chemical Engineering, 9(1), 104785.
CrossRef - Jawad, A. H., Abdulhameed, A. S., Kashi, E., Yaseen, Z. M., ALOthman, Z. A., & Khan, M. R. (2022). Cross-linked chitosan-glyoxal/kaolin clay composite: parametric optimization for color removal and COD reduction of remazol brilliant blue R dye. Journal of Polymers and the Environment, 30(1), 164-178.
CrossRef - Alabi, O., Olanrewaju, A. A., & Afolabi, T. J. (2020). Process optimization of adsorption of Cr (VI) on adsorbent prepared from Bauhinia rufescens pod by Box-Behnken Design. Separation Science and Technology, 55(1), 47-60.
CrossRef - Xu, S., Liang, M., Ding, Y., Wang, D., Zhu, Y., & Han, L. (2021). Synthesis, optical characterization, and adsorption of novel hexavalent chromium and total chromium sorbent: a fabrication of mulberry stem biochar/Mn-Fe binary oxide composite via response surface methodology. Frontiers in Environmental Chemistry, 2, 692810.
CrossRef - Yadav, S., Bajar, S., Hemraj et al. Assessment of groundwater quality near municipal solid waste landfill by using multivariate statistical technique and GIS: a case study of Bandhwari (Gurugram) landfill site, Haryana, India. Sustain. Water Resour. Manag. 9, 174 (2023). https://doi.org/10.1007/s40899-023-00964-6
CrossRef - Yadav, S., Dhankhar, R., & Chhikara, S. K. (2022). Significant Changes in Urban Air Quality during Covid-19 Pandemic Lockdown in Rohtak City, India. Asian Journal of Chemistry, 3189-3196.
CrossRef - Singh, A., Arora, D., Bala, R., Khokhar, A., & Kumar, S. (2023). Lanthanum nanoparticle (La2O3)–loaded adsorbents for removal of hexavalent chromium: a kinetics, isotherm, and thermodynamic study. Environmental Science and Pollution Research, 30(48), 105415-105428.
CrossRef - Singh, A., Kumar, S., & Panghal, V. (2021). Adsorption of chromium (Cr6+) on dead biomass of Salvinia molesta (Kariba weed) and Typha latifolia (broadleaf cattail): isotherm, kinetic, and thermodynamic study. Applied Water Science, 11(9), 149.
CrossRef - Serife P, Erol P. Natural biosorbents (garlic stem and horse chesnut shell) for removal of chromium (VI) from aqueous solutions. Environ Monit Assess. 2015;187(12):736.
CrossRef - Jeyaseelan, C., & Gupta, A. (2016). Green Tea Leaves as a Natural Adsorbent for the Removal of Cr(VI) from Aqueous Solutions. Air, Soil and Water Research. https://doi.org/10.4137/ASWR.S35227
CrossRef - Karaer, H., & Kaya, İ. (2017). Synthesis, characterization and using at the copper adsorption of chitosan/polyvinyl alcohol magnetic composite. Journal of Molecular Liquids, 230, 152-162.
CrossRef - Bhagath Singh, G., & Subramaniam, K. V. (2016). Quantitative XRD study of amorphous phase in alkali activated low calcium siliceous fly ash. Construction and Building Materials, 124, 139-147. https://doi.org/10.1016/j.conbuildmat.2016.07.081
CrossRef - Yadav, V., Tiwari, D. P., & Bhagat, M. (2021). Separation of copper (II) from aqueous solution using Kigelia africana carbon as adsorbent. Indian Chemical Engineer, 63(1), 1-12.
CrossRef - Yadav, V., Tiwaria, D., Bhagata, M. J. D., & TREATMENT, W. (2020). Isotherm, kinetics and thermodynamic parameters study of arsenic (III) and copper (II) adsorption onto Limonia acidissima shell carbon. Desalination Water Treat, 184, 214-224.
CrossRef

This work is licensed under a Creative Commons Attribution 4.0 International License.
About The Author
![]()
A New Edition of Web of Science
Journal Impact Factor
2022: 0.5
Five Year: 0.8
Journal is Indexed in

Cabells Whitelist
![]()


