Design and Synthesis of Novel Thiophene based Chelator Ligand for Enhanced Sensing of Fe2+ ions: An Experimental and Theoretical Insights
Meenakshi1 , Vijay Dangi1*, Pramod Kumar1, Amardeep1, Minati Baral2 and Brahamdutt Arya3,4
1Department of Chemistry, Baba Mastnath University, Rohtak, Haryana, India.
2Department of Chemistry, NIT, Kurukshetra, Haryana, India.
3Y and Y Nanotech Solutions Pvt. Ltd., Rohtak, Haryana, India.
4Department of Higher Education, Shiksha Sadan, Panchkula, India.
Corresponding Author E-mail: 91dangi@gmail.com, brahm.chem@gmail.com
DOI : http://dx.doi.org/10.13005/ojc/400114
Download this article as:
![]()
In the present study, we have reported the synthesis of a novel thiophene - based dipodal chelator ligand MPT (N1, N3-bis(3-((E)-thiophen-2-yl)methylene)amino)propyl)malonamide). Further, the physio-chemical properties of as-synthesized ligand was analyzed employing state-of-the-art characterization tools such as 1H NMR, 13C NMR, and IR spectroscopy. In order to calculate the protonation constant for the ligand MPT and formation constants for the ligand MPT with Fe2+ metal ion potentiometric and spectrophotometric analysis were carried out. Further, to analyze the coordination behavior of the ligand MPT with Fe2+ metal ion at room temperature in a highly aqueous medium spectrophotometric analysis was carried out. On the other hand, the theoretical studies for the ligand MPT and its complex with Fe2+ ion were performed employing a semi-empirical method and density functional theory. Further, the structure optimization of the ligand MPT was obtained using the PM6 parameter and B3LYP/6-311(d,p) level for ligand and DGDZVP for metal complex calculations respectively.
KEYWORDS:Chelate; DFT; Potentiometric; Spectrophotometric; Stability constant; Sensing; Schiff’s base
Introduction
Iron, being one of the most important elements for human plays a vital role in regulating the smooth functioning of major metabolic pathways/functions in the body such as oxygen transport, DNA synthesis, enzyme catalysis, electron transport, and other metabolic processes1. It is an established fact that human health is affected both due to deficiency and over exposure to various elements2. Specifically, deficiency of iron in the human body leads to a grievous disease called anaemia3. It occurs either when the number of RBCs is found low in blood count or when blood cells have a lower amount of haemoglobin4. It has been seen that deficiency of Fe in either minor or moderate numbers can lead to various functional abnormalities which can severely affect the cognitive development, working capacity, and immunity mechanisms of a person5-7. Further, it has also been seen that iron deficiency during pregnancy can affect both mother and infant and can be associated with an increased rate of sepsis, low birth weight and maternal mortality8. Iron deficiency and anemia are associated with high rates of morbidity and can also reduce learning ability8. Irrespective of its adverse effect, this deficiency can be cured by proper diet and iron supplements9. However, it has also been found that iron overload leads to a condition called hemochromatosis, which causes an increase in the total accumulation of Fe in the human body and induces cytotoxicity10. Further, it has been seen that toxicity caused by Fe is commonly spotted in people with genetic disorders related to Fe metabolism and patients with blood transfusions11. Furthermore, it has also been seen that over concentration of Fe can cause heart failure, chronic liver disease, dysfunction of major metabolic pathways leads to overexpression of various thyroid related hormones like T3, T4 and thyroid stimulation hormone TSH resulting in fatigue, hair loss and infertility, arthritis, and hyperpigmentation (bronze skin) issues in human body12-14. It has also been seen that the toxicity of iron can lead to various neurological dysfunction which certainly results in Alzheimer’s disease12. Iron overload can be treated by reduction therapy which is mainly achieved by means of K therapeutic phlebotomy15-16. In the case of patients that can’t tolerate therapeutic phlebotomy due to their haemoglobin levels, an alternate therapy is iron chelation therapy17.
Schiff bases, owing to their ability to coordinate with metal ions to form stable complexes, have found wide applications in the field of coordination chemistry18. In the past few years, Schiff bases have emerged as a versatile tool for sensing various metal ions due to their unique physiochemical properties like high chemical selectivity, enhanced complexation capability, and stability19. Many groups have reported the Schiff base-based fluorescent sensors for selective detection of various metal ions like Fe2+, Zn2+, Ni2+, Co2+, Au3+, Cu2+ etc.20. In order to design novel Schiff bases and to test their ability to sense the specific metal, there is a critical need to first theoretically access their interactions with desired metal ions. Therefore, it becomes imperative to first test the theoretical interactions of desired Schiff base with specific metal ions using computation methods like density functional theory (DFT) and then systematically design their synthesis employing chemical transformations21.
In the present study, we have designed and synthesized a novel thiophene-based dipodal chelator ligand MPT (N1, N3-bis(3-((E)-thiophen-2-yl)methylene)amino)propyl) malonamide and investigated its physicochemical characteristics using advance spectroscopic techniques. The complexation capabilities of ligand MPT with Fe2+ ions were demonstrated on the virtue of formation constant employing spectrophotometric and potentiometric techniques. Further, in order to support the synthesis of stable MPT-Fe2+ complex, the structures of MPT and MPT-Fe2+ complex were theoretically optimised using semi-empirical and DFT analysis. Further, theoretical insights were developed by analyzing the HOMO – LUMO energies of the proposed optimized structures of ligand MPT and MPT-Fe2+ complex. This study aims to provide the fundamental basis for the complex formation tendency of ligand MPT with Fe2+ ions for various industrial, environmental and biological applications.
Material and Methods
All the chemicals were of ultra-high purity and of laboratory grade. DMSO was purchased from Loba Chemie, while Fe salt was procured from Rankem. For preparation of solutions ultra-pure MilliQ water was used with a molar resistivity of 18.2 MΩcm. For potentiometric titrations, a mixture of H2O: DMSO (9:1, v/v) was used. Further, for optoelectronic analysis of synthesized complexes, Thermo Scientific made Model: Evolution 201 UV-Vis Spectrophotometer with high-quality quartz cuvettes were used. Further, Thermo Scientific made a pH meter model: Orion star A111 with Ross made Ultra-electrode model, 8102BNUWP employed to carry out potentiometric titration analysis. All the electrodes were first calibrated by standard method using buffer solutions.
Synthesis of ligand MPT
The first step is the formation of the intermediate of the ligand MPT. It was prepared by carrying out a nucleophilic substitution reaction between diethyl malonate and propylene as per standard literature method22. Further, condensation reaction was carried out to prepare ligand MPT. Briefly, a 10 ml solution of thiophene aldehyde (4.67 g, 0.01156 moles) in ethanol was added dropwise to 25 ml solution of the intermediate compound (1g, 0.0046 moles) in absolute ethanol with magnetic stirring at 45oC in an inert atmosphere. On stirring the mixture at 1000 rpm for 2 hours, a faded yellow color precipitate of ligand MPT were formed. The obtained precipitates were carefully separated using the rota-evaporator (Buchi Rotavapor R -210) , followed by washing with cold ether. Further, the filtered precipitates were dried in a vacuum, and the melting point of dried precipitates was analyzed and found to be 177 oC with a practical yield of 71 %.
Molecular Modelling
All the theoretical studies were carried out on 11th Gen Intel® Core ™ processor model: i7-11700K @ 3.60 GHz by using Gaussian 09 software23. Molecular structures were optimized by using the semi-empirical method and the DFT method. Further, the PM6 parameter and B3LYP/6-311(d,p) level for ligand and DGDZVP for the metal complex were used for performing calculations. After geometry optimization, the calculation of vibrational frequencies was carried out at the same level as the theory for verification of the true minima of the obtained structures.
Result and Discussions
Design and Synthesis
The synthesis of the ligand MPT was done as shown in scheme 1. The ligand consists of three domains- diethyl malonate (central unit), propylene diamine (spacer), and thiophene (binding units). The binding units were attached to the diethyl malonate via propylene diamine through an imine (-N=CH) and an amide (-NH-CO-) linkage. Briefly, a two-step reaction was performed for the synthesis of the dipodal chelator ligand MPT, where the first one is nucleophilic substitution mechanism followed by condensation to give the final product.
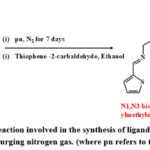 |
Scheme 1: Chemical reaction involved in the synthesis of ligand MPT carried out in an inert atmosphere by purging nitrogen gas. |
In the first step, a reaction was carried out between diethyl malonate and propylene diamine to obtain an intermediate product, through nucleophilic substitution reaction. The compound formed was water soluble and sensitive to air as well as moisture. Further, spectroscopic analysis was carried out to study the physio-chemical characteristics of the synthesized compounds. In Fig 1, the IR spectra for the as-synthesized compound reveal the appearance of a peak around 1633 cm -1 that can be attributed to the presence of amide (-NH-CO-) bonds. Further, the appearance of peaks around ~ 3290 cm-1 and ~1546 cm-1 corresponds to -NH stretching to -NH bending modes of vibration respectively. These results confirm the incorporation of spacer (propylene diamine) moieties through an amide linkage in the synthesized compound. Further, as per the second step, a condensation reaction was carried out in order to bind thiophene to the intermediate compound formed in the previous step. Briefly, the condensation reaction of the intermediate compound was carried out with thiophene aldehyde moieties in an ethanol medium at room temperature. Finally, the obtained precipitates were washed, filtered, and dried in a vacuum. The melting point of the finally dried compound was found to be 177O C. Further, the structural analysis of the synthesized MPT complex was carried out employing state-of-the-art spectroscopic techniques.
Physico-chemical analysis FT-IR Analysis
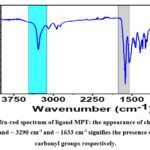 |
Figure 1: Infra-red spectrum of ligand MPT: the appearance of characteristics stretching band ~ 3290 cm-1 and ~ 1633 cm-1 signifies the presence of amide and carbonyl groups respectively. |
In order to determine the functional groups, present in the MPT complex, FT-IR spectroscopy analysis was carried out. Briefly, the spectrum was recorded in the form of a KBr pellet in transmission mode within the Mid-IR range (4000 to 400 cm-1). as depicted in Fig 1. The appearance of a sharp band of strong absorption around ~ 1633 cm-1 for ν(-C=O) can be inferred from the presence of an amide bond formed by the condensation of amino and ester functionalities. Further, the appearance of absorption bands around~ ν=3292 cm-1(due to NH stretching) and ν=1545 cm-1 (due to NH Bending) reveals the presence of an amide group in the intermediate molecule. Further, observation of another band around ~ ν=1639 cm-1 corresponds to the presence of azomethine functionality or -N=CH- group, that was formed by condensation of the intermediate amine and thiophene aldehyde. Lastly, observation of a band around ~ 712 cm-1 can be inferred from the presence of the -CH thiophene group.
1H-NMR Analysis
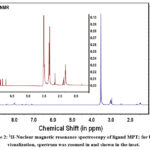 |
Figure 2: 1H-Nuclear magnetic resonance spectroscopy of ligand MPT; for better visualization, spectrum was zoomed in and shown in the inset. |
In order to determine the chemical structure of the synthesized ligand MPT, 1H-NMR spectroscopy was employed. Figure 2 reveals the 1H NMR of the ligand MPT for determining the chemical environment and chemical structure, when recorded in the DMSO solvent. Briefly, a total of nine different kinds of protons and signals appeared in the spectrum. The appearance of different signals in the 1H NMR (DMSO-d6) spectra is as follows: δ 3.0 (t, 4H, HN-CH2-CH2), 1.5 (m, 4H, CH2-CH2-CH2), 3.5 (s, 2H, OC-CH2-CO), 7-7.5 (m, 6H, thiophene H), 3.1 (t, 4H, CH2-CH2-NH), 8 (2H, -HC=N-), 8.3(2H, -C-NH). It has been depicted from Figure 2 that the observation of multiplet signal around ~ 1.5 ppm corresponds to the central methylene group (-CH2-) of propylene diamine moiety. Triplet signals appeared around ~ 3 and 3.1 ppm, corresponding to the -CH2 group adjacent to the amide group and imine group, respectively. Further, the appearance of most deshielded singlet signals at 3.5 ppm can be inferred due to the methylene group of the central unit. As this unit is present between two carbonyl moieties, therefore its signal gets deshielded. All the aromatic protons appear in the range from 7-8.5 ppm. Firstly, the appearance of three signals in the range of 7 to 7.5 ppm can be attributed to protons present on the carbons of thiophene ring. Further, the presence of signals around ~ 8 ppm and ~ 8.3 ppm corresponds to -HC=N imine group and -C-NH groups respectively
13C NMR Analysis
1H NMR (DMSO-d6): δ 3.0 (t, 4H, HN-CH2-CH2), 1.5 (m, 4H, CH2-CH2-CH2), 3.5 (s, 2H, OC-CH2-CO), 7-7.5 (m, 6H, thiophene H), 3.1 (t, 4H, CH2-CH2-NH), 8 (2H, -HC=N-), 8.3(2H, -C-NH). 13C NMR (DMSO-d6): δ 43 (OC-CH2-CO), 31 (CH2-CH2-CH2), 37 (HN-CH2-CH2), 166 (OC-CH2-CO), 59 (CH2-CH2-NH), 157 (-N=CH). IR spectrum (KBr pellet): 3290, 1639, 1633, 1546, 712.
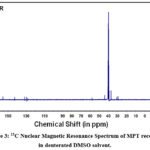 |
Figure 3: 13C Nuclear Magnetic Resonance Spectrum of MPT recorded in deuterated DMSO solvent. |
Carbon skeletal of the ligand MPT was investigated by 13C NMR spectrum recorded in deuterated DMSO as shown in Figure 3. Briefly, the appearance of the signal at 166 ppm can be attributed to the carbonyl group of the central unit. Further, observation of signals at 157 ppm indicate towards the carbon of imine (-N=CH) functionality. The appearance of two signals around~ 59 and ~37 ppm corresponds to the two methylene groups adjacent to imine (-N=CH) and amide functionalities respectively. Another signal was observed at 43 ppm corresponding to -CH2 group of malonate moiety. This signal appeared as the most deshielded one, in comparison to other methylene groups, due to the presence of two carbonyl moieties adjacent to it. Further, the appearance of a signal at 31 ppm is due to middle -CH2 units of the spacer.
Complex Formation AnalysisProtonation Behaviour of Ligand MPT
In order to calculate the value of the protonation constant for ligand MPT, both potentiometric and spectrophotometric titrations were performed according to the standard protocols24. Briefly, for potentiometric titration of ligand MPT of concentration, [MPT] = 1×10⁻⁴ M in a solution made of H2O: DMSO (99:1), a measured amount of 0.1 M HCl was used against 0.1 M KOH at the temperature of 25±1o C. Further, µ = 0.1 M KCl is used to maintain the ionic strength of the solutions, and pH was varied in the range of 2-11 to carry out the whole titration. Figure 4 reveals the pH-dependent potentiometric titration curve for free ligand MPT and MPT-Fe2+ complex, respectively. The potentiometric titration curve obtained for the ligand MPT exhibits two inflection points: one at x=1 and the other at x=1.1, where x is the volume of base (KOH) used in ml. Further, in order to calculate the protonation constant value for ligand MPT, the obtained data points from figure 4 were also analysed by using HYPERQUAD program, after a refinement process and were best fitted according to a defined model25. Theoretically, it was hypothesized that the protonation reaction of the ligand MPT should follow the behavior according to eq. 1, where the value of Kn, signifies the theoretical value of the protonation constant.
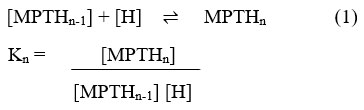
After analyzing the reaction in eq.1, all associated equilibrium constants were determined. Further, after theoretical analysis of MPT structure, it was found that a total of 8 protonation sites could be possible for the ligand MPT, in which two sites are for each of the imine and amide groups whereas four sites for thiophene groups respectively. However, under experimental conditions, the presence of only 4 protonation sites as well as protonation constants (log β) were observed. The obtained protonation constant values with preferred sites of protonation are shown in Table 1.
Table 1: Possible protonation reaction equilibrium at preferred protonation sites with corresponding Log β value (protonation constant) obtained through (A) potentiometric and (B) spectrophotometric at temperature 25±1o C, µ=0.1 M KCl for ligand MPT.
|
Equilibrium |
Log β |
Protonation sites |
|
|
|
A |
B |
|
|
MPT+H ⇌ MPTH |
10.47±0.04 |
10.44±0.02 |
(-SH-) Thiophene Protons |
|
MPT+2H ⇌ MPTH2 |
20.02±0.02 |
20.05±0.03 |
(-SH-) Thiophene Protons |
|
MPTH2+H ⇌ MPTH3 |
26.88±0.03 |
26.88±0.02 |
(-CH=NH-) Protons |
|
MPTH3+H ⇌ MPTH4 |
28.29±0.02 |
28.24±0.04 |
(-CH=NH-) Protons |
|
MPT⇌MPTH-1+H |
-8.85±0.01 |
-8.89±0.03 |
Hydrolysis Species |
|
MPTH-1 ⇌MPTH-2+H |
-18.81±0.04 |
-18.78±0.01 |
Hydrolysis Species |
|
MPTH-2 ⇌MPTH-3+H |
-29.36±0.03 |
-29.39±0.04 |
Hydrolysis Species |
|
MPTH-3 ⇌MPTH-4+H |
-40.76±0.03 |
-40.71±0.04 |
Hydrolysis Species |
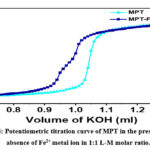 |
Figure 4: Potentiometric titration curve of MPT in the presence and absence of Fe2+ metal ion in 1:1 L-M molar ratio. |
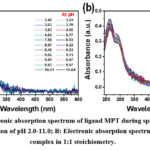 |
Figure 5: A. Electronic absorption spectrum of ligand MPT during spectrophotometric titration as a function of pH 2.0-11.0; B: Electronic absorption spectrum for Fe2+ – MPT complex in 1:1 stoichiometry. |
It was found that the experimentally obtained potentiometric titration curve did not match completely with the theoretical curve for high pH (greater than 9) values. Moreover, it was observed that at higher pH or in basic conditions, there is no protonation behavior observed for ligand MPT, rather there may be a possibility of some other mechanism and hence only four protonation constants were taken into consideration and were shown in Table 1 respectively. A possible explanation for not observing protonation at all eight possible sites is that the deprotonation of the amide group could only take place in highly basic conditions; however, in our present experimental setup, pH ranges from 2-11, and hence, these is little tendency for observation of protonation due to amide groups. On the other hand, there is another possibility of the formation of the additional four hydrolyzed species (due to hydrolysis) viz MPTH-1, MPTH-2, MPTH-3 and MPTH-4 at basic pH conditions. Further, these data points were again incorporated in the model using HYPERQUAD program, and best fitted to the experimental curve after refining. The obtained data indicate towards the observation of MPT ligand hydrolysis as the preferred reaction mechanism at higher pH (i.e. greater than 9) values or in basic conditions, and the formation of respective species with their log β values were arranged in Table 1.
Further, the protonation behavior analysis was examined using spectrophotometric analysis and compared with the results obtained from the potentiometric analysis. Fig. 5a, demonstrates the electronic absorption spectra for the free ligand MPT, in the varying pH ranging from 2-9. The spectra were shown only from 240 -600 nm, because after 600 nm spectra were following the same behaviour. Again, the data points obtained from experimental absorption spectra were analyzed using HYPSPEC software, after global fitting of the spectra with the help of a non-linear least square fitting model26. Further, on the basis of HYPSPEC analysis, the presence of both the protonated species (MPTH, MPTH2, MPTH3 and MPTH4) and hydrolysed species (MPTH-1, MPTH-2, MPTH-3, and MPTH-4) were confirmed. From Figure 5a, the appearance of two absorption bands in acidic conditions, at λ=266 nm (ε=0.21×10⁴ Lmol-1cm-1) and λ=290 nm (ε=0.15×10⁴ Lmol-1cm-1) corresponds to π→ π* and n→ π* transitions respectively for the ligand MPT. After changing the pH of the solution from acidic to basic, there is an observation of a hyperchromic shift in the absorption bands for ligand MPT. Mathematically, the value of ε for the band λ=266 nm is increased to ε=0.23×10⁴ Lmol-1cm-1 and for the second one at λ=290 nm is increased to ε=0.17×10⁴ Lmol-1cm-1.
Further, we have analysed the data points obtained from spectrophotmetric analysis in HYSS software in order to determine the distribution of different species with respect to pH. On observing species distribution curve of the ligand MPT, it can be clearly seen that at pH 2, MPTH4 species exists whereas at pH 4 and pH 8, MPTH3 and MPTH2 species are predominantly seen respectively. At pH 9.5, LH species is formed. On further increase in pH, hydrolysis species are observed as shown in Fig 6.
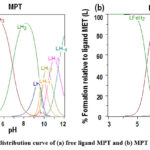 |
Figure 6: Species distribution curve of (a) free ligand MPT and (b) MPT – Fe2+ Complex. |
Fe – MPT Complex Formation Analysis
After the calculation of protonation constants for the ligand MPT, formation constants for the metal-ligand complex were also investigated employing the potentiometric and spectrophotometric analysis. Figure 4 depicts the potentiometric curve as per varying pH for Fe-MPT complex (1:1) where [Fe] =[MPT]= 1×10 -4 M at temperature 25 ±1oC and ionic strength 0.1 M KCl. The deviation of the Fe-MPT curve from the ligand MPT curve near pH 4 indicates towards the possibility of coordination of ligand MPT with Fe2+ ion. After pH≥ 9, turbidity appeared as a result of hydrolysis, so the data points for the Fe-MPT complex were not taken into consideration above pH ≥ 9. Further, formation constants for the metal-ligand complex were calculated by using the protonation constant of the ligand, as shown in Table 2. Also, in order to access the possibility of different the metal-ligand species formed during potentiometric titrations, HYPERQUAD 2006 program was used.
Table 2: Formation constants of Metal Ligand complex obtained through (A) potentiometric and (B) spectrophotometric method at temperature 25±1o C, µ=0.1 M KCl.
|
Equilibrium |
Log β |
|
|
|
A |
B |
|
Fe + L ⇌ FeL |
22.11± 0.02 |
22.15± 0.03 |
|
Fe + LH2 ⇌ FeLH2 |
33.39± 0.03 |
33.36±0.02 |
Further, in order to study the coordination behavior of the ligand MPT with Fe2+ ion, where Fe: MPT is 1:1, [Fe]=[MPT]= 4×10 -4 M at temp 25 ±1oC with increasing pH 2-9 and µ= 0.1 M KCl spectrophotometric method was employed. After pH 9, hydrolysis occurs in the metal-ligand complex system. As a result, data points to pH 9 were taken into account. Figure 5b, reveals the electronic absorption spectra for Fe2+– MPT complex under pH ranging from ~ 3-10. It was observed that under acidic conditions, two bands for Fe2+– MPT complex at λ=263 nm with ε=0.39×10⁴ Lmol-1cm-1 (π→ π* transition) and λ=290 nm with ε=0.31×10⁴ Lmol-1cm-1 (n→ π* transition) were appeared. After changing solution conditions from acidic to neutral, i.e. at pH=7, a hyperchromic effect was observed for both absorption bands. The first band appears with absorbance ε=0.44×10⁴ Lmol-1cm-1, and the second band with ε=0.34×10⁴ L mol-1cm-1, indicating the role of pH in modulating the relative molar absorptivity of the ligand metal complex.On further increasing the pH, absorbance decreases (hypochromic effect) with ε=0.38×10⁴ Lmol-1cm-1 and ε=0.29×10⁴ Lmol-1cm-1 for the first and second band respectively indicating towards a reduction of band gap. Further, the computer program HYPSPEC was used for establishing the metal ligand species formed during spectrophotometric titrations.
Further, HYSS software was utilized in order to analyse the different species formed as a function of pH. Figure 6b demonstrates the species distribution curve of the Fe-MPT complex at different pH. It was found that at pH 5, MPTFeH2 species dominate, whereas at pH 6.5 formation of MPTFe species occurs predominantly. Further, it was found that on increasing pH beyond neutral conditions, the formation of hydrolysis species LH-3 and LH4 appeared preferentially.
Molecular Modelling and DFT Analysis
For optimization of the preliminary structures of ligand MPT and Fe2+ – MPT complex, we have employed the molecular mechanics (MM) method and again re-optimized the geometries by a Semi-empirical method using the PM6 parameter. Further, in order to obtain the minimal strain energy structure for ligand MPT and Fe2+ – MPT complex, the pre-optimized structure by the semi-empirical method was again re-analyzed by Density Functional Theory (DFT) employing B3LYP/6-311(d,p) level for ligand and DGDZVP for the metal complex of approximation. In order to ensure the possibility of energy minima geometries, the ligand MPT and its complex with Fe2+, the frequencies were calculated using DFT, and the absence of any imaginary frequencies ensures the full optimization of the geometries of ligand MPT and Fe2+ – MPT complex. All the calculations were carried out in the gaseous phase. Figure 7 reveals the optimized structures of the ligand MPT and Fe2+ – MPT complex. It was calculated that the energy of Fe-MPT complex is E = -3167.83 a.u. and that of MPT is E= -1904.63 a.u. Lower energy value for the Fe-MPT complex indicates towards the greater stability of Fe-MPT complex. Further, using the same theoretical approximations, frontier molecular orbitals (FMO’s) for both ligand MPT and Fe-MPT complex were analysed, and their respective structure with relative electron distribution densities are shown in Fig. 8.
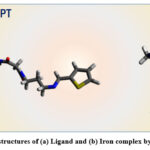 |
Figure 7: Optimized structures of (a) Ligand and (b) Iron complex by semi-empirical/PM6. |
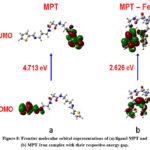 |
Figure 8: Frontier molecular orbital representations of (a) ligand MPT and (b) MPT-Iron complex with their respective energy gap. |
Figure 8 demonstrates the optimized electron distribution density on HOMO and LOMO structures for both of ligand MPT and Fe-MPT complexes, respectively. It was depicted from the structures that electron density was specifically distributed around the thiophene side groups of the ligand MPT. On the other hand, there is an appearance of electron density distribution around thiophene side group as well as the spacer moieties present in the Fe-MPT complex. Further, the relative energy gap between HOMO – LUMO for free ligand MPT is 4.713 eV; on the other hand, that for Fe-MPT complex is 2.626 eV, indicating the enhanced stability of Fe-MPT complex as compared to free ligand MPT. Therefore, from the experimental as well as theoretical analysis of the complexation behavior of ligand MPT, it can be inferred that the synthesized ligand MPT shows enhanced interactions with Fe2+ ions and forms stable complex. This study provides the foundation basis for the application of ligand MPT for enhanced sensing of Fe2+ ions through complexation in various industrial, environmental and biological systems.
Conclusion
In this study, we have reported the synthesis of novel thiophene-based dipodal chelator MPT. Further, the physicochemical characteristics of the ligand MPT have been analyzed employing advanced spectroscopic techniques like 1H NMR, 13C NMR and IR spectroscopy. The protonation constant of the ligand MPT and the formation constant of the Fe-MPT complex were calculated using the potentiometric and spectrophotometric techniques. Results indicate the high binding constant (logβ = 33.39) for effective encapsulation of Fe2+ by dipodal chelator MPT in 1:1 stoichiometry. Further, the DFT studies indicate the lower energy of the Fe-MPT complex as compared to the ligand MPT itself, which suggests the enhanced stability of the Fe-MPT complex with a distorted tetrahedral geometry. The excellent binding ability of the ligand MPT towards iron enables it to find applications in metallurgy, chelation therapy, and sensing technology.
Acknowledgement
Dr Vijay Dangi and Dr Brahamdutt Arya duly acknowledge Dr B.K. Kanungo, Professor, Sant Longowal Institute of Engineering and Technology, India and Dr Surinder P. Singh, Senior Principal Scientist, CSIR- National Physical Laboratory, New Delhi for their constant support and guidance.
Conflict of Interest
There is no conflict of interest between any author regarding any financial, personal or relationship with any organization.
References: –
- Gupta, C.P.; IOSR Journal of Applied Chemistry (IOSR-JAC), 2014, 7, 11, 38-46.
- Abbaspour, N.; Hurrell, R.; Kelishadi, R.; J Res Med Sci., 2014, 19, 2, 164–174.
- Sheema, U.K.; Rawekar, A.; J Family Med Prim Care, 2022, 11, 6, 2320-2326.
CrossRef - Allen, L.; de Benoist, B.; Dary, O.; and Hurrell, R.; World Health Organization and Food and Agriculture Organization of the United Nations (WHO/FAO), Guidelines on Food Fortification with Micronutrients, 2006, 1, 1-376.
- Beard, J.L.; Connor, J.R.; Annu Rev Nutr, 2003, 23, 41-58.
CrossRef - Viteri, F.E.; Torun, B.; Clinics in Hematology. 1974, 3, 609–26.
CrossRef - Failla, M.L.; J Nutr., 2003, 133, 5, 1443-47.
CrossRef - Flood, Jeanie L.; Hawaii J Med Public Health, 2013, 72, 3, 81–86.
- Kumar, S.; Anukiruthika, T.; Dutta, S.; Kashyap, A.V.; Moses, J. A.; Anandharamakrishnan, C.; Trends in Food Science & Technology, 2020, 99, 58-75.
CrossRef - Domenico, I De; Ward, D.M.; Kaplan, J.; J Clin Invest, 2007, 117, 7, 1755-58.
CrossRef - McDermid, J.M.; Lonerdal, Bo.; Advances in Nutrition, 2012, 3, 4, 532-533.
CrossRef - Kontoghiorghes, George J.; Int. J. Mol. Sci. 2023, 24,16, 12902-28.
CrossRef - McLaren, G.D.; McLaren, C.E.; Adams, P.C.; Barton, J.C.; Reboussin, D.M.; Gordeuk, V.R.; Acton, R.T.; Harris, E.L.; Speechley, M.R.; Sholinsky, P.; Dawkins, F.W.; Snively, B.M.; Vogt, T.M.; Eckfeldt, J.H.; Can J Gastroenterol, 2008, 22, 11, 923-30.
CrossRef - McLaren, G.D.; Muir, W.A.; Kellermeyer, R.W.; Crit Rev Clin Lab Sci., 1983, 19, 3, 205-66.
CrossRef - Adams, P. C; Jeffrey, G.; Ryan, J.; THE LANCET, 2023, 401, 10390, 1811-1821.
CrossRef - Powell, L.W.; Yapp, T.R.; Clin Liver Dis., 2000, 4, 1, 211-28.
CrossRef - Qasem, M.A. Al; Hanna, F.; Vithanarachchi, U.S.; Khalafallah, A.A.; BMJ Case Rep., 2018, 4,1-4.
- Dangi V.; Baral M.; Kanungo B.K.; Current Analytical Chemistry, 2020, 16, 5, 620-630.
CrossRef - Dangi, V.; Baral, M.; & Kanungo, B.K.; J Appl Spectrosc, 2020, 87, 893–903.
CrossRef - Goshisht, M. K.; Patra, G. K.; and Tripathi, N.; Mater. Adv., 2022, 3, 2612-2669.
CrossRef - Sherif, O. E.; Abdel-Kader, N. S.; Arabian Journal of Chemistry, 2018, 11, 5, 700-713.
CrossRef - Dangi, V.; Baral, M.; and Kanungo, B. K.; J Fluoresc, 2020, 30, 5, 1131-1149.
CrossRef - Frisch, MJ; Trucks, GW; Schlegel, HB; Scuseria, GE; Robb, MA; Chesseman, JR; Scalmani, G; Barone, V; Mennucci, B; Peterson, GA; Nakatsuji, H; Caricato, M; Li, X; Hratchian, HP; Izmaylov, AF; Bloino, J; Zheng, G; Sonnenberg, JL; Hada, M; Ehara, M; Toyota, K; Fukuda, R; Hasegawa, J; Ishida, M; Nakajima, T; Honda, Y; Kitao, O; Nakai, H; Vreven, T; Montgomery, JA; Peralta, Jr. JE; Ogliaro, F; Bearpark, M; Heyd, JJ; Brothers, E; Kudin, KN; Staroverov, VN; Kobayashi, R; Normand, J; Raghavachari, K; Rendell, A; Burant, JC; Iyengar, SS; Tomasi, J; Cossi, M; Rega, N; Millam, JM; Klene, M; Knox, JE; Cross, JB; Bakken, V; Adamo, C; Jaramillo, J; Gomperts, R; Stratmann, RE; Yazyev, O; Austin, AJ; Cammi, R; Pomelli, C; Ochterski, JW; Martin, RL; Morokuma, K; Zakrzewski, VG; Voth, G. A; Salvador, P; Dannenberg, JJ; Dapprich, S; Daniels, AD; Farkas, O; Foresman, JB; Ortiz, JV; Cioslowski, J; Fox, DJ; Gaussian 09, Revision A.I. Gaussian Inc, Wallingford, CT., 2009, 1-125.
CrossRef - Dangi, V.; Kandhal, J.; Gupta, A.; Baral, M.; and Kanungo, B. K.; Methods, 2023, 220, 79-89.
CrossRef - Gans, P.; Sabatini, A.; Vacca, A.; Talanta., 1996, 43, 1739-1753.
CrossRef - Gans, P.; Sabatini, A.; Vacca, A.; Ann. Chim. (Rome), 1999, 89, 45-49.
Accepted on: 17 Jan 2024
Second Review by: Dr. Guna Shekar
Final Approval by: Dr. Ioana Stanciu


![]()


