Synthesis, Characterization, Density Functional Theory Studies and Antioxidant Activity of Novel Hydrazone Ligands and their Metal Complexes
Veyan Taher Suleman1* and Abdul Ghany Mohammed Al-Daher2
1Department of Chemistry, College of Science, University of Dohuk, Dohuk, Iraq.
2Al-Noor university college, Mosul, Iraq.
Corresponding Author E-mail: veyan.suleman@uod.ac
DOI : http://dx.doi.org/10.13005/ojc/390624
Article Received on : 08 Sep 2023
Article Accepted on :
Article Published : 06 Dec 2023
Reviewed by: Dr. Tasneem Mohammed
Second Review by: Dr. Bhubon Singh Rajkumar
Final Approval by: Dr. Selvan Angusamy
Novel hydrazone ligands (HL) derived from 2,5-hexandione and benzoyl hydrazine (HDBH), 2-furoyl hydrazine (HDFH), or 2-picolinoyl hydrazine (HDPH) were used to synthesize mononuclear Mn(II), Co(II), Ni(II), Cu(II), and Zn(II) complexes of the general formula [M(L)2].xH2O (x= 0-3). The hydrazone ligands and the isolated complexes were characterized by, spectral, thermal analysis, molar conductance, and magnetic moment measurements. Beside, density functional theory (DFT) computations have been to study structures and energetic of the ligand and its complexes. The IR spectral information suggests that the ligands exhibit monobasic tridentate behavior through their ONO donor atoms. The metal complexes were determined to possess monomeric octahedral geometry. The DPPH antioxidant capability of both the ligand and their metal complexes was evaluated.
KEYWORDS:Antioxidant activity; DFT calculation; Hydrazone Complexes
Download this article as:| Copy the following to cite this article: Suleman V. T, Al-Daher A. G. M. Synthesis, Characterization, Density Functional Theory Studies and Antioxidant Activity of Novel Hydrazone Ligands and their Metal Complexes. Orient J Chem 2023;39(6). |
| Copy the following to cite this URL: Suleman V. T, Al-Daher A. G. M. Synthesis, Characterization, Density Functional Theory Studies and Antioxidant Activity of Novel Hydrazone Ligands and their Metal Complexes. Orient J Chem 2023;39(6). Available from: https://bit.ly/4a9lId0 |
Intruduction
In general, hydrazones are created via a condensation process involving an acid hydrazide and an aldehyde or ketone, conducted within an alcoholic solvent1. Various aspects, including the pH of the environment, substituent characteristics, and the positioning of the hydrazone group concerning other functional groups, impact the coordination tendencies of hydrazones. Furthermore, the removal of a proton from the NH group, a phenomenon possible in the ligand complexes, is produced in the creation of tautomeric anionic entities (=N-N−C=O or =N-N=C-O−), which exhibit unique coordination characteristics2
In recent times, there has been an increasing fascination with investigating hydrazones possessing donating properties. This surge in interest stems from research indicating that their pharmacological effects are linked to their capacity to create chelates with essential metal ions in biological systems. Consequently, a multitude of hydrazones and their complexes were identified to exhibit antibacterial, antifungal, antiviral, ant oxidative, and antitumor activities. The coordination geometry, the nature of donor atoms existing in the ligands, the sort of metallic ion, and its oxidation state all have a significant role in influencing the biological outcomes of these compounds3.
In view of the above mentioned significant importance of hydrazone metal complexes in various fields and on continuation of our studies of hydrazone metal complexes4, we were motivated to synthesis Co(II), Ni(II), Cu(II) and Zn(II) Complexes with novel aroyl hydrazone ligands (Scheme 1) and to describe their structural and antioxidant properties.
 |
Scheme 1: Synthesis and Tatumeric forms of hydrazine ligands. |
Experimental
Equipments
The CHN analysis was carried out at the microanalytical unite elemental analyzer and mass spectroscopy MSDCHEM of the University of Iran. Perkin-Elmar (AA500G) atomic absorption spectrophotometer was used to obtain metal content. FT-IR spectra were obtained for KBr discs containing the organic ligands and their complexes in the 4000-400 cm-1 range using a Perkin-Elmer FT-IR 660 spectrophotometer. The 1H and 13C NMR spectra of the organic ligands were collected using a Bruker Advance II 400 NMR spectrometer. The measurements were carried out in DMSO-d6 or CDCl3 solvents, utilizing a superconducting NMR spectrometer operating at frequencies ranging from 13000 to 64 MHz. The internal standard used was TMS. The UV-visible absorption spectra were measured within a quartz cell with a diameter of 1cm and a concentration of 10–3 M in dimethylsulfoxide within a range of 1100–200nm via a Unicam HEIOS UV-VIS spectrophotometer. Magnetic susceptibility readings were obtained using a Johnson Matthey MSB/AUTO balance. Conductivity assessments for complexes were measured at a concentration of 10–3 M in methanol and DMSO and at a temperature of 25 ᵒC, employing a conductivity meter marked as model 430 PH. DFT calculations were performed utilizing the B3LYP/6-311++G(d,p) methodology. Specifically in a gas-phase environment. The thermal analyses were performed at department of chemistry, college of basic education , Mosul university using a METTLER TOLEDO TGA\DSC instrument, along with STARe evaluation software version 16.3. The measurements were taken in the temperature range of 25 to 600°C, employing a heating ramp rate of 5°C/min.
Synthetic Methods
Synthesis of hydrazone ligands
Hydrazide compounds BH, FH, and PH were prepared by refluxing Ethylbenzoate (15g, 0.1 mole) for (BH), Ethyl-2-furate (14.0 g, 0.1 mole) for (FH), or Ethylpicolenate (15.1 g, 0.1 mole) for (PH) in 25 mL of ethanol with a slight excess of hydrazine hydrate NH2NH2.H2O (6.0 g, 0.12 mole) for 5 hours. The compounds crystallize when left overnight in a freezer, after which they are filtered and subsequently washed with ethanol and ether. The pure hydrazides were obtained through recrystallization from hot ethano5.
The hydrazone ligands HDBH, HDFH, and HDPH were prepared by a condensation reaction between an ethanolic solution (50 mL) of 2,5-hexandione (1.14 g, 0.01 mole) and acid hydrazide (BH, FH, PH) (0.01 mole) in a 1:1 molar ratio. The mixture was magnetically stirred and then refluxed in a water bath for 5 hours. After evaporating the liquid left, a white hydrazone precipitate was obtained. The resulting solid was filtered, rinsed softly with cold ethanol, and dried using a vacuum desiccator containing anhydrous calcium chloride. The substance was then recrystallized from chloroform, and the reactions were verified by employing thin-layer chromatography (TLC) on silica gel sheets (Scheme-1-)
Synthesis of complexes
The compounds were produced by adding 0.23 g (0.002 mole) of triethylammine to a hot solution containing each of the ligands (HDBH, HDFH, or HBPH) (0.002 mole) in 25 mL of methanol .The color of the solution became yellow. A solution containing 0.001 mole of metal acetate hydrate in 25 mL of methanol, maintaining a molar ratio of (1:2) metal:ligand , was then added. The reaction mixtures were then refluxed for 4 hours. Afterward, the volume of the mother liquor was reduced by half and cooled. The obtained solid was filtered, washed repeatedly with methanol and ether, and then dried using a vacuum desiccator along with anhydrous calcium chloride.
Computational methods
DFT calculations were carried out using Gaussian 09 software, utilizing the B3LYP/6-311++G(d,p) approach in a gas-phase context2. These calculations were executed on the refined structures of the generated compounds to evaluate their structural characteristics and stability. This analysis included examining thermodynamic properties, bond lengths, angles, and the characteristics of frontier molecular orbitals.
Antioxidant activity
The free radical scavenging effect was estimated by treating the DPPH radical with a methanolic solution of the tested compounds. Freshly prepared methanolic solution of 2,2-diphenyl-1-picrylhydrazyl (0.5 mmol), giving a violet solution that changes to a faint yellow color when combined with the various concentrations of the investigated substances (20, 40, and 60 ppm). The reaction mixture will be left to incubate in darkness at room temperature for 30 minutes. The absorbance at 517 nm will be gauged using a UV-Vis spectrometer to gauge the effectiveness of DPPH radical scavenging. The percentage inhibition will be computed using the subsequent formula6:
DPPH scavenging ability (%) = (Abs control – Abs sample /Abs control) * 100
Where: Abs control = Absorbance of the DPPH radical + methanol.
Abs sample = Absorbance of the tested sample with DPPH after 30 minutes.
Table 1: Physical and elemental analysis results of the ligands and their metal complexes.
|
No |
Comp. |
color |
M.P. ˚C |
Yield% |
Ω ohm1cm2mol-1 |
Elemental analysis% cal./found |
||||
|
|
||||||||||
|
Me OH |
DMSO |
C% |
H% |
N% |
M% |
|||||
|
HL1 |
HDBH C13H16O2N2 |
White |
176-178 |
86.0 |
—- |
—- |
67.24/67.20 |
6.89/6.43 |
12.06/12.00 |
— |
|
1 |
[Mn(HDBH-H)2].H2O |
Reddish-brown |
156-157 |
71.0 |
17.2 |
7.4 |
58.32/58.01 |
5.98/5.56 |
10.46/10.01 |
10.26/10.23 |
|
2 |
[Co(HDBH-H)2].3H2O |
Dark- brown |
164-166 |
74.4 |
13.1 |
6.7 |
54.27/54.07 |
6.26/6.12 |
9.74/9.04 |
10.24/10.10 |
|
3 |
[Ni(HDBH-H)2] |
Olive green |
246-250 |
77.6 |
15.2 |
8.9 |
59.91/59.33 |
5.76/5.21 |
10.75/10.54 |
11.27/11.02 |
|
4 |
[Cu(HDBH-H)2].H2O |
Black-brown |
254-256 |
78.0 |
11.7 |
11.4 |
57.40/57.11 |
5.88/5.18 |
10.30/10.21 |
11.68/11.12 |
|
5 |
[Zn(HDBH-H)2].H2O |
Pale yellow |
208-210 |
66.6 |
17.7 |
13.0 |
57.21/57.06 |
5.86/5.33 |
10.26/10.17 |
11.97/11.64 |
|
HL2 |
HDFH C11H14O3N2 |
White |
218-220 |
85.0 |
— |
— |
59.45/59.11 |
6.30/6.10 |
12.61/12.23 |
— |
|
6 |
[Mn(HDFH-H)2] |
Black |
238-240 |
79.0 |
9.8 |
8.6 |
53.12/53.09 |
5.23/5.20 |
11.26/11.45 |
11.04/11.0 |
|
7 |
[Co(HDFH-H)2].2H2O |
Dark brown |
244-245 |
65.0 |
14.6 |
13.1 |
49.17/49.08 |
5.58/5.36 |
10.43/10.14 |
10.97/10.57 |
|
8 |
[Ni(HDFH-H)2].2H2O |
Pale-olive-green |
251-253 |
65.0 |
13.8 |
10.6 |
49.18/49.06 |
5.58/5.43 |
10.43/10.11 |
10.93/10.44 |
|
9 |
[Cu(HDFH-H)2].3H2O |
green |
289-292 |
72.3 |
11.6 |
12.0 |
47.18/47.09 |
5.71/5.21 |
10.00/9.87 |
11.34/11.15 |
|
10 |
[Zn(HDFH-H)2].H2O |
Pale Yellow |
290-293 |
70.0 |
14.8 |
10.1 |
50.25/50.15 |
5.33/5.18 |
10.66/10.41 |
12.43/12.11 |
|
HL3 |
HDPH C12H15O2N3 |
White |
210-212 |
79.0 |
— |
— |
61.80/61.17 |
6.43/6.11 |
18.02/18.00 |
— |
|
11 |
[Mn(HDPH-H)2].H2O |
Yellow – brown |
227-230 |
69.5 |
19.0 |
13.2 |
53.64/53.17 |
5.58/5.28 |
15.64/15.11 |
10.22/10.08 |
|
12 |
[Co(HDPH-H)2].2H2O |
Dark brown |
270 |
77.6 |
18.2 |
9.2 |
51.52/50.57 |
5.72/5.67 |
15.02/14.56 |
10.53/10.20 |
|
13 |
[Ni(HDPH-H)2].2H2O |
Dark-brown |
223-225 |
70.0 |
20.0 |
8.5 |
51.54/51.04 |
5.72/5.45 |
15.03/14.87 |
10.50/10.20 |
|
14 |
[Cu(HDPH-H)2] |
Olive green |
280 d |
68.8 |
16.0 |
11.5 |
54.59/54.87 |
5.30/5.18 |
15.92/15.48 |
12.03/11.98 |
|
15 |
[Zn(HDPH-H)2].2H2O |
Orange -yellow |
251-255 |
65.0 |
15.0 |
16.1 |
50.94/50.43 |
5.66/5.27 |
14.85/14.66 |
11.55/11.32 |
d = decomposed
Results and Discussion
The hydrazones of 2,5-hexandion were efficiently synthesized by direct condensation of 2,5-hexandion with benzoyl hydrazine (HDBH), 2-furoyl hydrazine (HDFH), and picolinoyl hydrazine (HDPH) in a 1:1 molar ratio in absolute ethanol (Scheme 1). These hydrazones, when reacted with metal(II) acetate in presence of triethylamine in a 1:2:1 molar ratio in methanol, yielded 1:2 complexes. Analytical data showed that the ligands underwent enolization and deprotonation during complex formation. The complexes display intense colors and maintain their solid state at room temperature, unaffected by air or moisture. Generally, they exhibit low solubility in water and non-polar organic solvents but readily dissolve in ethanol, methanol, DMF, and DMSO. The complexes demonstrate low conductivity values in methanol (9.8-20.0 ohm-1mol-1cm2) and in DMSO (6.7-16.1 ohm-1mol-1cm2) solutions, indicating their non-electrolytic character, some physical properties as shown in Table17,8.
FT-IR analysis
The significant infrared spectra of the synthesized compounds, as shown in Figures 1and 2, were measured using KBr disks and are outlined in Table 2. The frequencies of functional groups in the free ligands are indicated by bands in the specific region. (3329-3217), (1693-1658) and (1640-1620) cm-1, are consigned to the ʋ(N-H), ʋ(C=O)dione and ʋ(C=O)hydrazide respectively. The disappearance of the ʋ(N-H), and ʋ(C=O)Hydrazide bands of ligands in metal complexes and the appearance of anew bands ʋ(C-O)enol on (1188–1138)cm-1 ranges indicating the complexation of the ligands in enol form resulted the involving these bands in coordination with metal ions9. The ʋ(C=O)dione were slight shifted to lower frequencies of all metal complexes to (1651-1620)cm-1 confirming the participation of ʋ(C=O)dione in coordination 10 The additional strong bands appeared in the region (1601-1585) cm-1are corresponding to the stretching vibrational of azomethin group ʋ(C=N) of free ligands but are moved to lower frequency ranges (1581-1527) cm-1on their complexes, indicating the participation C=N group in coordination to metal ions 11 The bonding of nitrogen with the metal atom causes a reduction in electron density within the azomethine group, leading to a shift of the ν(C=N) vibration band towards lower frequencies. Interestingly, the stretching vibration of (N-N) in the ligand’s spectrum at (1007-995) cm-1 experiences a shift to higher frequencies by (69-21) cm-1 in their corresponding complexes. This alteration acts as an additional indicator of coordination between the metal and the nitrogen within the azomethine group12. The rise in frequency of the (N-N) stretching vibration results from the diminished repulsion between lone pair electrons of neighboring nitrogen atoms, facilitated by electron sharing with the metal ion. The weak absorption bands around 618 cm-1, attributed to the pyridine ring’s (py) deformation vibration in the spectrum of the free ligand (HDPH), were identified at nearly the same or lower frequencies. This implies that the pyridine nitrogen atom did not engage in coordination within the HDPH complexes13.The appearance of extra bands in the complex spectra spanning the ranges of (556-432) cm-1 and (497-412) cm-1 can tentatively be linked to (M-O) and (M-N) interactions, respectively. This offers supplementary confirmation of the ligand’s bonding with the metal ions14.
Due to the presence of symmetric and asymmetric stretching modes demonstrated by the non-coordinated water molecule, some complexes show a band in their spectra that is centered about 3745–3600 cm-1. Additionally, there are no bands in the areas where coordinated water is bending and deforming. The results of the thermal analysis investigation affirm the existence of lattice water molecules in certain complexes. However, all of these complexes release water when subjected to heating up to 600 °C15.
Table 2: Infrared spectral assignment (cm-1) of the prepared ligands and their complexes.
|
No. |
Comp. |
ν(N-H) |
ν(C=O) dione |
ν(C=O) hydrazide |
Ʋ(C=N) |
ν(C-O) enol |
ⱱ(N-N) |
⸹(py) |
v(M-O) |
ν(M-N) |
|
HL1 |
HDBH C13H16O2N2 |
3217m |
1658sh |
1640s |
1601sh |
– |
1003m |
— |
— |
— |
|
1 |
[Mn(HDBH-H)2].H2O |
— |
1638sh |
— |
1554s |
1169m |
1024m |
— |
513w |
435m |
|
2 |
[Co(HDBH-H)2].3H2O |
— |
1628sh |
— |
1573s |
1165m |
1032m |
— |
519w |
459w |
|
3 |
[Ni(HDBH-H)2] |
— |
1651m |
— |
1546s |
1138m |
1058m |
— |
513m |
451w |
|
4 |
[Cu(HDBH-H)2].H2O |
— |
1631m |
— |
1581s |
1141m |
1068m |
— |
551w |
495w |
|
5 |
[Zn(HDBH-H)2].H2O |
— |
1643s |
— |
1547s |
1141m |
1030m |
— |
459w |
417w |
|
HL2 |
HDFH C11H14O3N2 |
3283s |
1658sh |
1631s |
1585sh |
– |
1007m |
— |
– |
— |
|
6 |
[Mn(HDFH-H)2] |
— |
1640sh |
— |
1552s |
1167m |
1038m |
— |
513w |
436m |
|
7 |
[Co(HDFH-H)2].2H2O |
— |
1601s |
— |
1549sh |
1180m |
1045m |
— |
556w |
497w |
|
8 |
[Ni(HDFH-H)2].2H2O |
— |
1643s |
— |
1527s |
1188m |
1035m |
— |
536w |
424w |
|
9 |
[Cu(HDFH-H)2].3H2O |
— |
1651s |
— |
1537s |
1184m |
1061m |
— |
546w |
497w |
|
10 |
[Zn(HDFH-H)2].H2O |
— |
1643s |
— |
1539s |
1188m |
1053m |
— |
432w |
412w |
|
HL3 |
HDPH C12H15O2N3 |
3329s |
1693sh |
1620s |
1585m |
– |
995m |
617m |
— |
– |
|
11 |
[Mn(HDPH-H)2].H2O |
|
1616 m |
— |
1550m |
1145m |
1045m |
617w |
509w |
420m |
|
12 |
[Co(HDPH-H)2].2H2O |
— |
1639m |
— |
1550m |
1142m |
1044m |
613w |
520w |
418w |
|
13 |
[Ni(HDPH-H)2].2H2O |
— |
1632s |
— |
1536s |
1157m |
1064m |
617m |
540w |
420w |
|
14 |
[Cu(HDPH-H)2] |
— |
1643s |
— |
1558sh |
1168m |
1062sh |
618m |
516m |
482w |
|
15 |
[Zn(HDPH-H)2].2H2O |
— |
1634s |
— |
1545s |
1143m |
1064m |
617w |
530w |
420w |
sh=sharp, s = strong, m = medium, w= weak
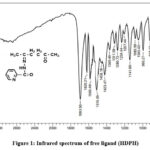 |
Figure 1: Infrared spectrum of free ligand (HDPH). |
 |
Figure 2: Infrared spectrum of [Mn(HDPH-H)2].H2O. |
Analysis of the ligands using 1H and 13C HNMR spectroscopy
In DMSO-d6 and CDCl3 solvents, the 1H-NMR and 13C-NMR spectra of the free ligands HDBH, HDFH, and HDPH were recorded as in Figures 3 and 4. They show singlet signals at (2.043–1.365 ppm) that are attributed to the proton of aliphatic methyl (6H, s, 2CH3). The multiple signals at (3.708–2.106 ppm) are due to the protons of (4H, m, 2CH2) aliphatic , Aromatic protons of the ligands exhibit a multiple of signals throughout the ranges (8.641–6.517ppm) corresponding to aromatic protons of benzene, furan and pyridine rings of the ligands. The ligands also reveals a singlet signal peak at (10.529-10.023ppm) are confirm to the (1H, s, NH) proton. In13C-NMR, the signals at 18.43–11.2 ppm is attributed to CH3 groups, while the signals at 104.1–22.971 ppm are confirmed to be from the two CH2 groups. The aromatic phenyl carbon atoms of all three ligands occurred within 148.47–126.44 ppm. The signals at 164.39–144.91 ppm and 199.65–184.92 parts per million (ppm) are attributed to (C=N) and (C=O), respectively; these results are consistent with prior reports for similar compounds16,17
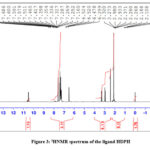 |
Figure 3: 1HNMR spectrum of the ligand HDPH |
 |
Figure 4: 13C NMR spectrum of the ligand HDPH |
Mass spectroscopy
The mass spectra of the hydrazone ligands HDBH, HDFH, and HDPH are illustrated. In the mass spectrum of each ligand, a peak is observed at m/z = 232.4, 221, and 233.2, respectively, corresponding to the molecular ion peak. The fragmentation pattern was investigated, which displayed various peaks. All these results provide evidence of the chemical structure of the prepared ligands and, thus, their successful synthesis as in Figure 5.
 |
Figure 5: Mass spectrum of the free HDPH ligand |
Electronic absorption spectra and magnetic moments
The magnetic moments were measured at room temperature, and the electronic absorption bands of all synthesized compounds were recorded in DMSO solution within the specified range of 1100–250 nm using quart cuvettes with a 1 cm path length, as shown in Table 3. The absorption of HDBH, HDFH, and HDPH appeared within regions (37077–32786) and (31645–29154) cm-1, which have been attributed to π→⁕π and n→⁕π transitions, respectively18.
The electronic spectra of the complexes were recorded in DMSO and compared with those of the respective ligands. Mn(II) electronic spectrum complexes 1, 6, and 11 appeared within the specified range (24390–2389 cm-1), referring to the n→⁕π transition; however, d-d transitions were not seen, most likely due to the low intensities of these forbidden transitions . This was matched with magnetic moment values of (5.7–5.5) BM, which confirmed a high-spin d5-system containing five unpaired electrons and suggested octahedral Mn(II) complexes19. The Co(II) complexes 2, 7, and 12 spectra have visible three bands located at (9744-9596) cm-1, (16006-15497.6) cm-1, and (20468-18903) cm-1, which correspond to 4T1g →4T2g(F)(v1), 4T1g →4A2g(F)(v2), and 4T1g(F) →4T2g(P)(v3), respectively, together with a magnetic moment value (5.0-4.5) BM affording the octahedral geometry20. Three absorption peaks were observable within the electronic absorption spectra of the Ni(II) complexes 3, 8, and 13, the peaks at (9794-9531)cm-1, (19551-14300)cm-1, and (23641-22474)cm-1 corresponding to 3A2g →3T2g (F)(v1), 3A2g →3T1g (F)(v2), and 3A2g→ 3T1g (P) (v3) transitions. This was consistent with (3.2-2.7) BM magnetic moment values confirming to two unpaired electrons in the d8-system in octahedral Ni(II) complexes21. Whereas complexes 4,9,14 of Cu(II) displayed a single broad band in the range of (14598-13210) cm-1, which can be attributed to 2Eg→2T2g that exhibit comparable energy levels, resulting in a single broad absorption band. The width of this band might arise from forceful Jahn-Teller distortion and magnetic moment values ranging from (2.3-1.87) BM. Collectively, these data strongly suggest an octahedral geometry round the Cu(II) ion22. In the electronic spectra of the diamagnetic Zn(II) complexes 5,10,15 only one band was observed due to the LMCT transition23.
Table 3: Magnetic moments and electronic absorption spectra for the complexes.
|
No. |
Compound |
μeffc(B.M) |
Band position (cm-1) |
Assignment |
Geometry |
||
|
1 |
[Mn(HDBH-H)2].H2O |
5.7 |
23809.6 |
n→⁕π |
Octahedral |
||
|
6 |
[Mn(HDFH-H)2] |
5.5 |
24390.8 |
||||
|
11 |
[Mn(HDPH-H)2].H2O |
5.7 |
24096.7 |
||||
|
|
|
|
V1 |
V2 |
V3 |
|
|
|
2 |
[Co(HDBH-H)2].3H2O |
5.0 |
96333.4 |
16006.6 |
19417.5 |
4T1g →4T2g(F)(ʋ1) 4T1g →4A2g(F)(ʋ2) 4T1g(F)→4T2g(P)(ʋ3) |
Octahedral |
|
7 |
[Co(HDFH-H)2].2H2O |
4.8 |
9596.4 |
15722.2 |
20468.4 |
||
|
12 |
[Co(HDPH-H)2].2H2O |
4.5 |
9794.7 |
15497.6 |
1890.8 |
||
|
3 |
[Ni(HDBH-H)2] |
3.2 |
9784.5 |
14300.7 |
23474.8 |
3A2g → 3T2g (F) ʋ1 , 3A2g → 3T1g (F) ʋ2 3A2g → 3T1g (P) ʋ3 |
Octahedral |
|
8 |
[Ni(HDFH-H)2].2H2O |
2.7 |
9531.4 |
19551.6 |
23641.3 |
||
|
13 |
[Ni(HDPH-H)2].2H2O |
3.1 |
9794.9 |
16778.6 |
22390.7 |
||
|
4 |
[Cu(HDBH-H)2].H2O |
2.2 |
14598.4 |
2Eg→2T2g |
Octahedral |
||
|
9 |
[Cu(HDFH-H)2].3H2O |
1.87 |
14492.5 |
||||
|
14 |
[Cu(HDPH-H)2] |
2.2 |
13210.9 |
||||
|
5 |
[Zn(HDBH-H)2].H2O |
Dia Dia Dia |
24396.6 |
LMCT |
Octahedral |
||
|
10 |
[Zn(HDFH-H)2].H2O |
24390.8 |
|||||
|
15 |
[Zn(HDPH-H)2].2H2O |
24271.6 |
|||||
Thermal analysis
Thermal analysis investigations, encompassing thermogravimetry (TG) and differential thermogravimetry (DTG), were undertaken on several synthesized complexes spanning temperatures from 50-600°C. The decomposition patterns and the associated theoretical percentage mass losses for each complex are detailed in Table 4 as well as visualized in Figure 6 24,25.
The calculated weight loss percentages, derived from the TG data, closely corresponded with the proposed molecular formula of the studied complexes. The thermal decomposition curves of the reported complexes are characterized by multiple steps, indicating a multi-stage decomposition process. The TG curve displays a reduction in weight within the temperature interval of 50–130 °C. This decline in mass corresponds to the elimination of water molecules in hydrated state molecules: 1H2O hydrate molecule for complexes [Zn(HDBH)2].H2O, [Zn(HDFH)2].H2O, and 2H2O molecules for complex [Co(HDPH)2].2H2O. Within the TG curve, the subsequent decrease in weight occurs between 150 -350°C, aligning with the degradation of ligand fragments. Specifically, the fragments are C9H8ON2 for [Zn(HDBH)2].H2O, C9H8O2N for [Zn(HDFH)2].H2O, and C17H17O2N4 for [Co(HDPH)2].2H2O. The third decomposition step occurs between the temperatures of 360 – 600 ˚C, with further weight losses attributed to the remaining organic hydrazone ligands. These fragments are C17H22O2N2 for [Zn(HDBH)2].H2O, C13H18O3N3 for [Zn(HDFH)2].H2O, and C7H11ON2 for [Co(HDPH)2].2H2O. The final residues obtained from the thermal decomposition of the complexes were pure metal oxides, specifically ZnO and CoO. These residues remained stable even at a temperature of 600 °C. Regarding the complex [Cu(HDFH)2].3H2O, its thermal decomposition occurred in a single step, starting at 50 ˚C and ending at 800 ˚C. This decomposition process resulted in the formation of the metal oxide CuO, corresponding to the weight loss of the 3H2O hydrate and the complete degradation of the hydrazone ligand.
Table 4: Thermal degradation of the ligand and its corresponding metal complexes.
|
No. |
Complexes |
Temp. range (˚C) |
Estimated /calculated |
|
|
Mass loss (%) |
Assignment |
|||
|
5 |
[Zn(HDBH)2].H2O C26H32O5N4Zn |
50-130 |
3.3 /3.3 |
Loss of hydrated water (1 H2O) |
|
|
|
150-350 |
28.8/29.3 |
C9H8ON2 |
|
|
|
360-600 |
51.0/52.4 |
C17H22O2N2 Residu ZnO |
|
9 |
[Cu(HDFH)2].3H2O C22H32O9N4Cu |
50-800 |
85.8/85.7 |
Losses C22H32O8N4 and (3H2O) hydrate water Residue CuO |
|
10
|
[Zn(HDFH)2].H2O C22H28O7N4Zn |
50-130 |
3.2 /3.4 |
Loss of hydrated water (1 H2O) |
|
|
|
150-350 |
30.0/30.8 |
C9H8O2N |
|
|
|
360-600 |
49.8/50.2 |
C13H18O3N3 Residue ZnO |
|
12
|
[Co(HDPH)2].2H2O C24H32O6N6Co |
50-130 |
5.6/6.4 |
Loss of hydrated water (2 H2O) |
|
|
|
150-350 |
54.4/55.2 |
C17H17O2N4 |
|
|
|
360-600 |
25.0/24.8 |
|
 |
Figure 6: Thermo gravimetric analysis (TGA) for complexes (5, 9, 10, 12) |
Computational studies (DFT)
To enhance our understanding of how metal ions influence the electronic properties of ligands, we performed computational DFT calculations using Gaussian 09 software at the DFT-B3LYP/6-311++G(d,p) method . This computational approach has become a valuable tool for determining various properties, including molecular construction, bond angles, bond lengths, thermodynamic parameters, and electronic properties, which were analyzed using DFT computations Figure 7. The results reveal that changing the central atom significantly affects the energy of the frontier molecular orbitals26
 |
Figure 7: Optimized Structures of the Ligands and Complexes. Metal atoms are shown in purple, Nitrogen in blue, Oxygen in Red, Carbon in Grey, and Hydrogen in White. |
Thermodynamics parameter for prepared compounds
Thermodynamic parameters for the complexes were computed to establish coherent connections between their energetic, structural, and reactive characteristics, and the energy of a system. This fundamental statement is justified by the calculated zero-point energy, Gibbs free energy (∆G), enthalpy (∆H), internal energy (E), entropy (∆S), and specific heat (Cv) for all prepared compounds. These experimental data shown in Table 5 are essential parameters in describing the reaction pathways and relative energies for the compounds 27.
Table 5: Thermodynamic parameters of ligands and their complexes were computed using Density Functional Theory (DFT) with the B3LYP method at a temperature of 298.15K and a pressure of 1 atm.
|
No. Compounds |
Zero-point vibrational energies (a.u) |
Gibbs free energy (a.u) |
Enthalpy (a.u) |
Internal energy (a.u) |
Entropy (calmol-1K – 1 ) |
Specific heat, Cv (calmol-1K -1 |
|
HL1 |
-3069.66 |
-3069.72 |
-3069.62 |
-3069.62 |
199.12 |
122.73 |
|
1 |
-3124.27 |
-2381.79 |
-3497.20 |
-3487.75 |
134.76 |
111.51 |
|
2 |
-2910.88 |
-2910.93 |
-2910.85 |
-2910.85 |
179.45 |
114.62 |
|
3 |
-3101.62 |
-3001.98 |
-3001.85 |
-3001.42 |
201.92 |
116.21 |
|
4 |
-3168.67 |
-3168.73 |
-3168.64 |
-3168.64 |
203.32 |
118.70 |
|
5 |
-3307.54 |
-3307.62 |
-3307.51 |
-3307.51 |
226.69 |
131.39 |
|
HL2 |
-762.07 |
-762.12 |
-762.05 |
-762.05 |
143.06 |
58.60 |
|
6 |
-2674.76 |
-2674.83 |
-2674.72 |
-2674.72 |
224.05 |
123.91 |
|
7 |
-2907.09 |
-2907.16 |
-2907.06 |
-2907.06 |
224.19 |
124.43 |
|
8 |
-3032.63 |
-3032.70 |
-3032.59 |
-3032.59 |
222.00 |
123.94 |
|
9 |
-3164.26 |
-3164.31 |
-3164.23 |
-3164.23 |
181.41 |
105.56 |
|
10 |
-3303.68 |
-3303.75 |
-3303.64 |
-3303.64 |
228.42 |
125.47 |
|
HL3 |
-780.92 |
-780.96 |
-780.90 |
-780.90 |
139.80 |
61.93 |
|
11 |
-2712.35 |
-2712.41 |
-2712.31 |
-212.32 |
195.66 |
119.52 |
|
12 |
-2944.19 |
-2944.25 |
-2944.16 |
-2944.16 |
201.72 |
122.03 |
|
13 |
-3069.66 |
-3069.72 |
-3069.62 |
-3069.62 |
199.12 |
122.73 |
|
14 |
-3201.88 |
-3201.94 |
-3201.84 |
-3201.94 |
200.49 |
118.38 |
|
15 |
-3340.71 |
-3340.78 |
-3340.68 |
-3340.68 |
216.90 |
127.71 |
The tables (6 and 7) present data on the bond lengths and angles of prepared combinations. In these complexes, from the chelate ligand, two nitrogen and four oxygen donor atoms create a coordination polyhedron. The observed bond lengths and bond angles are typical of six-coordinated M(II) complexes containing a monohydrazone, which involves the contribution of six donor atoms, complexes with a metal-ligand ratio of 1:2, which are provided by two tridentate chelate ligands designated as HL, and coordinated by two nitrogen atoms from azomethine (N5 and N6), and two oxygen atoms from carbohydrazide (O2 and O3), as well as two oxygen atoms from ketones (O1 and O4), and these atoms are arranged in an octahedral structure. The bond lengths within (M-O1) of (2.74-1.81), (M-O2) of (2.19-1.84), (M-O3) of (2.72-1.13), (M-O4) of (2.27-1.84), (M-N5) of (2.34-1.87) and (M-N6) of (2.22-1.84).The (N5-N7), (N6-N8), (O1-C) and (O3-C) bond length are enlarged owing to coordination of azomethane nitrogen carbohydrazide oxygen, and carbonyl oxygen atoms, and formation of M-N and M-O bond as shown in Table 6. These observed bond lengths are in agreement with the bond distances found in similar six-coordinated structures reported in the literature 28,29,30.
Upon coordination, the angles formed by the bonds within the hydrazone moiety of the ligands undergo some changes. Notably, the bond angles (-O=C-N-N=C-) are either reduced or increased during complex formation, depending on the bonding sequence. However, the detected bond angles in the complexes lie within the normal range for octahedral geometry. This suggests that the bonding of these complexes likely involves sp3d2 or d2sp3 hybridization30.
Table 6: Computation of geometric bond lengths in synthesized compounds using the B3LYP/6-311++G(d,p) technique. Bond length are given in Å
|
No. Compounds |
M-O1 |
M-O3 |
M-O2 |
M-O4 |
M-N5 |
M-N6 |
N5-N7 |
N6-N8 |
O1-C |
O3-C |
|
HL1 |
—- |
—- |
—- |
—- |
—- |
—- |
1.29 |
—- |
1.21 |
1.22 |
|
1 |
1.81 |
1.85 |
1.84 |
1.84 |
1.87 |
1.84 |
1.39 |
1.39 |
1.24 |
1.43 |
|
2 |
2.15 |
2.72 |
2.09 |
1.87 |
2.02 |
1.99 |
1.38 |
1.39 |
1.23 |
1.27 |
|
3 |
2.74 |
1.88 |
1.87 |
2.27 |
1.91 |
1.91 |
1.40 |
1.40 |
1.21 |
1.30 |
|
4 |
2.13 |
1.59 |
1.94 |
1.94 |
2.03 |
2.03 |
1.39 |
1.39 |
1.21 |
1.30 |
|
5 |
2.13 |
1.74 |
2.00 |
1.98 |
2.17 |
2.11 |
1.43 |
1.42 |
1.25 |
1.32 |
|
HL2 |
—- |
—- |
—- |
—- |
—- |
—- |
1.29 |
—- |
1.21 |
1.22 |
|
6 |
2.07 |
2.67 |
1.90 |
1.90 |
2.02 |
2.02 |
1.44 |
1.44 |
1.24 |
1.36 |
|
7 |
1.96 |
2.09 |
1.94 |
1.92 |
2.04 |
1.94 |
1.39 |
1.39 |
1.26 |
1.28 |
|
8 |
2.11 |
1.90 |
1.90 |
1.58 |
1.98 |
1.98 |
1.41 |
1.41 |
1.24 |
1.32 |
|
9 |
2.23 |
1.13 |
1.95 |
1.95 |
2.03 |
2.03 |
1.43 |
1.42 |
1.24 |
1.34 |
|
10 |
2.38 |
2.01 |
1.97 |
1.96 |
2.03 |
2.04 |
1.43 |
1.42 |
1.21 |
1.30 |
|
HL3 |
—- |
—- |
—- |
—- |
—- |
—- |
1.37 |
—- |
1.22 |
1.24 |
|
11 |
2.28 |
2.31 |
2.15 |
2.20 |
2.34 |
2.22 |
1.38 |
1.37 |
1.22 |
1.26 |
|
12 |
2.10 |
2.45 |
1.95 |
1.99 |
2.24 |
2.11 |
1.38 |
1.38 |
1.23 |
1.29 |
|
13 |
2.28 |
2.31 |
2.15 |
2.20 |
2.34 |
2.22 |
1.38 |
1.37 |
1.22 |
1.26 |
|
14 |
2.56 |
2.20 |
2.19 |
2.17 |
2.03 |
2.04 |
1.38 |
1.38 |
1.22 |
1.26 |
|
15 |
2.07 |
2.18 |
1.98 |
2.02 |
2.24 |
2.17 |
1.37 |
1.37 |
1.23 |
1.30 |
Table 7: The geometric bond angles given in (˚) of the synthesized compounds were determined using the B3LYP/6-311++G(d,p) technique.
|
No. Compounds |
M-O1 |
M-O3 |
M-O2 |
M-O4 |
M-N5 |
M-N6 |
N5-N7 |
N6-N8 |
O1-C |
O3-C |
|
HL1 |
—- |
—- |
—- |
—- |
—- |
—- |
1.29 |
—- |
1.21 |
1.22 |
|
1 |
1.81 |
1.85 |
1.84 |
1.84 |
1.87 |
1.84 |
1.39 |
1.39 |
1.24 |
1.43 |
|
2 |
2.15 |
2.72 |
2.09 |
1.87 |
2.02 |
1.99 |
1.38 |
1.39 |
1.23 |
1.27 |
|
3 |
2.74 |
1.88 |
1.87 |
2.27 |
1.91 |
1.91 |
1.40 |
1.40 |
1.21 |
1.30 |
|
4 |
2.13 |
1.59 |
1.94 |
1.94 |
2.03 |
2.03 |
1.39 |
1.39 |
1.21 |
1.30 |
|
5 |
2.13 |
1.74 |
2.00 |
1.98 |
2.17 |
2.11 |
1.43 |
1.42 |
1.25 |
1.32 |
|
HL2 |
—- |
—- |
—- |
—- |
—- |
—- |
1.29 |
—- |
1.21 |
1.22 |
|
6 |
2.07 |
2.67 |
1.90 |
1.90 |
2.02 |
2.02 |
1.44 |
1.44 |
1.24 |
1.36 |
|
7 |
1.96 |
2.09 |
1.94 |
1.92 |
2.04 |
1.94 |
1.39 |
1.39 |
1.26 |
1.28 |
|
8 |
2.11 |
1.90 |
1.90 |
1.58 |
1.98 |
1.98 |
1.41 |
1.41 |
1.24 |
1.32 |
|
9 |
2.23 |
1.13 |
1.95 |
1.95 |
2.03 |
2.03 |
1.43 |
1.42 |
1.24 |
1.34 |
|
10 |
2.38 |
2.01 |
1.97 |
1.96 |
2.03 |
2.04 |
1.43 |
1.42 |
1.21 |
1.30 |
|
HL3 |
—- |
—- |
—- |
—- |
—- |
—- |
1.37 |
—- |
1.22 |
1.24 |
|
11 |
2.28 |
2.31 |
2.15 |
2.20 |
2.34 |
2.22 |
1.38 |
1.37 |
1.22 |
1.26 |
|
12 |
2.10 |
2.45 |
1.95 |
1.99 |
2.24 |
2.11 |
1.38 |
1.38 |
1.23 |
1.29 |
|
13 |
2.28 |
2.31 |
2.15 |
2.20 |
2.34 |
2.22 |
1.38 |
1.37 |
1.22 |
1.26 |
|
14 |
2.56 |
2.20 |
2.19 |
2.17 |
2.03 |
2.04 |
1.38 |
1.38 |
1.22 |
1.26 |
|
15 |
2.07 |
2.18 |
1.98 |
2.02 |
2.24 |
2.17 |
1.37 |
1.37 |
1.23 |
1.30 |
Quantum mechanics
Frontier molecular orbitals (FMO) analysis
The highest occupied molecular orbital energy (EHOMO) and the lowest unoccupied molecular orbital energy (ELUMO) are described in detail by the theory of Frontier Molecular Orbitals (FMO), as seen in Figure 8. These limitations are essential in understanding the electronic structure and reactivity of molecules. Analyzing the FMO energies offers valuable insights into the quantum-level stability and reactivity of molecules.
HOMO and LUMO energies were calculated utilizing the DFT-B3LYP/6-311++G(d,p) method. For both ligands and complexes, we quantified a number of parameters, including E (energy gap), electronegativity (I), global hardness (η), softness (σ), and electrophilicity index (ω). The ionization energy (EHOMO) and electron affinity (A = ELUMO) were used to characterize the ionization potential and electron affinity, respectively (refer to Table 8). These quantum chemical parameters are computed utilizing formulas derived from the HOMO and LUMO energies6.
Ionization energy (I): 𝐼 = −𝐸𝐻𝑂𝑀𝑂 Electrophilicity Index (ω): 𝜔 = ꭓ 2/ 2𝜂
Energy Gap (DEGAP): 𝛥𝐸𝐺𝐴𝑃 = 𝐸𝐿𝑈𝑀𝑂 − 𝐸𝐻𝑂𝑀𝑂
Global Hardness (η): 𝜂 = 𝐸𝐿𝑈𝑀𝑂−𝐸𝐻𝑂𝑀𝑂 /2
Absolute Electronegativity (χ): 𝜒 = 𝐼+𝐴 /2
Chemical Softness (σ): 𝜎 = 1 /𝜂
The HOMO-LUMO energy gap of a molecule can serve as a predictor for various characteristics such as its kinetics, chemical stability, optical polarizability, and chemical hardness-softness. Molecules with a relatively small energy gap are commonly known as “soft molecules.” These soft molecules exhibit a greater degree of polarization, which in turn results in heightened reactivity compared to “hard” molecules. Soft molecules readily donate electrons to acceptors. In the case of complex 14 containing Cu(II), it possesses the smallest energy gap among the studied complexes, suggesting a potentially higher level of reactivity but lower stability when compared to the others30. The negative energies of both HOMO and LUMO signify the stability of the molecules. Ionization energy represents the overall energy required to remove an electron from a molecule. Absolute softness and hardness are crucial parameters for assessing the reactivity and stability of molecules31. The electrophilicity index (ω) is a fundamental quantum chemical property used to explain the reactivity and site selectivity of molecules while also describing their biological efficiency32.
Table 8: Electronic parameters, expressed in atomic units (a.u., where 1 a.u. equals 27.211 electron volts ), were calculated for the synthesized compounds using the DFT/B3LYP theory.
|
Compound |
HOMO |
LUMO |
Egap |
I |
A |
χ |
ɳ |
σ |
ω |
|
HL1 |
-6.47 |
-1.62 |
4.84 |
6.47 |
1.62 |
4.04 |
2.42 |
0.41 |
3.38 |
|
1 |
-4.24 |
-1.99 |
2.25 |
4.24 |
1.99 |
3.11 |
1.12 |
0.89 |
4.31 |
|
2 |
-4.19 |
-2.44 |
1.76 |
4.19 |
2.44 |
3.32 |
0.88 |
1.14 |
6.26 |
|
3 |
-5.67 |
-1.52 |
4.15 |
5.67 |
1.52 |
3.59 |
2.08 |
0.48 |
3.11 |
|
4 |
-6.07 |
-1.69 |
4.37 |
6.07 |
1.69 |
3.88 |
2.19 |
0.46 |
3.44 |
|
5 |
-5.85 |
-1.92 |
3.94 |
5.85 |
1.92 |
3.88 |
1.97 |
0.51 |
3.83 |
|
HL2 |
-6.32 |
-1.44 |
4.88 |
6.32 |
1.44 |
3.88 |
2.44 |
0.41 |
3.09 |
|
6 |
-4.91 |
-1.69 |
3.22 |
4.91 |
1.69 |
3.30 |
1.61 |
0.62 |
3.38 |
|
7 |
-5.99 |
-1.70 |
4.29 |
5.99 |
1.70 |
3.84 |
2.14 |
0.47 |
3.44 |
|
8 |
-5.93 |
-1.96 |
3.97 |
5.93 |
1.96 |
3.94 |
1.98 |
0.50 |
3.92 |
|
9 |
-6.00 |
-1.68 |
4.32 |
6.00 |
1.68 |
3.84 |
2.16 |
0.46 |
3.42 |
|
10 |
-6.03 |
-1.70 |
4.33 |
6.03 |
1.70 |
3.87 |
2.17 |
0.46 |
3.45 |
|
HL3 |
-5.37 |
-3.09 |
2.28 |
5.37 |
3.09 |
4.23 |
1.14 |
0.88 |
7.84 |
|
11 |
-2.80 |
-2.87 |
1.67 |
2.80 |
2.87 |
2.83 |
0.04 |
0.73 |
7.26 |
|
12 |
-5.39 |
-1.48 |
1.91 |
5.39 |
1.48 |
3.43 |
1.96 |
0.51 |
3.01 |
|
13 |
-2.56 |
-1.75 |
0.81 |
2.56 |
1.75 |
2.15 |
0.40 |
2.49 |
5.76 |
|
14 |
-3.13 |
-2.80 |
0.34 |
3.13 |
2.80 |
2.97 |
0.17 |
5.96 |
6.18 |
|
15 |
-2.91 |
-1.76 |
1.15 |
2.91 |
1.76 |
2.33 |
0.58 |
1.74 |
4.72 |
 |
Figure 8: Density Functional Theory (DFT) computed Highest Occupied Molecular (HOMO) and Lowest Unoccupied Molecular Orbital (LUMO) Diagrams of Ligand (HL1) and its Complexes |
Antioxidant activity
Utilizing a free radical scavenging model involving 2,2-diphenyl-1-picrylhydrazyl (DPPH), the antioxidant capacity of the ligands and their metal complexes was determined. The ability of the compounds to scavenge free radicals was assessed based on a mechanism described in reviewer reports 6.33. This model provides a means to demonstrate the capacity of the compounds to effectively neutralize free radicals and exhibit antioxidant activity as in Figure 9.
In the DPPH free radical scavenging test, compounds demonstrated varying efficacy in scavenging the DPPH radical. The results showed that all compounds exhibited antioxidant activity, compared to the standard ascorbic acid, which is a well-known antioxidant. It’s important to highlight that among the compounds investigated, the ligands HDBH, HDFH, and HDPH demonstrated superior antioxidant activity in comparison to the complexes, as outlined in Table 9. This dissimilarity in activity might be attributed to the particular ligand groups present, which can impact the scavenging of the DPPH radical. This phenomenon is a typical trait of antioxidants.
The free ligands exhibited notably higher antioxidant activity compared to the metal complexes, even at the lowest concentration tested (20 ppm), with percentages ranging from 63.95% to 63.45%. However, upon complexation, the antioxidant activity decreased to a range of 46.90% to 25.48%. The enhanced antioxidant activity that was perceived in the free ligands can be attributed to the ease of reduction and re-oxidation of the hydrazone ligands. This ease facilitates the release of hydrogen, which in turn reduces the DPPH radical. The results indicate that the scavenging activity of the investigated chemicals was dependent on their concentration. Among the complexes studied, the complex [Cu(HDBH-H)2] H2O exhibited the highest interaction ability with DPPH compared to the rest of the complexes, and its IC50 values, as shown in Table 9, were lower than those of the standard ascorbic acid, indicating superior antioxidant activity.
Table 9: Absorbance, Antioxidant activity and IC50 of compound at different concentration at 517 nm
|
No. |
Compound |
Absorbance |
%Antioxidant activity |
|
||||||
|
Concentration (μg /mL) |
||||||||||
|
20 |
40 |
60 |
20 |
40 |
60 |
IC50 (μg/mL) |
||||
|
standard |
Ascorbic acid |
0.04 |
0.03 |
0.02 |
97.00 |
97.00 |
98.00 |
44.05 |
||
|
HL1 |
HDBH C13H16O2N2 |
0.50 |
0.49 |
0.44 |
63.95 |
67.00 |
68.32 |
35.76 |
||
|
1 |
[Mn(HDBH-H)2].H2O |
0.69 |
0.67 |
0.65 |
30.15 |
32.18 |
34.41 |
24.56 |
||
|
2 |
[Co(HDBH-H)2].3H2O |
0.65 |
0.64 |
0.60 |
33.90 |
34.92 |
39.28 |
26.04 |
||
|
3 |
[Ni(HDBH-H)2] |
0.65 |
0.63 |
0.62 |
33.60 |
36.04 |
38.47 |
25.92 |
||
|
4 |
[Cu(HDBH-H)2].H2O |
0.52 |
0.50 |
0.49 |
46.90 |
49.03 |
50.45 |
30.63 |
||
|
5 |
[Zn(HDBH-H)2].H2O |
0.64 |
0.62 |
0.60 |
34.61 |
36.64 |
38.88 |
26.31 |
||
|
HL2 |
HDFH C11H14O3N2 |
0.55 |
0.52 |
0.50 |
63.45 |
65.68 |
67.71 |
35.62 |
||
|
6 |
[Mn(HDFH-H)2] |
0.68 |
0.66 |
0.62 |
31.37 |
33.19 |
36.75 |
25.05 |
||
|
7 |
[Co(HDFH-H)2].2H2O |
0.71 |
0.69 |
0.66 |
28.32 |
30.25 |
32.69 |
23.80 |
||
|
8 |
[Ni(HDFH-H)2].2H2O |
0.73 |
0.72 |
0.74 |
26.29 |
27.41 |
28.52 |
22.93 |
||
|
9 |
[Cu(HDFH-H)2].3H2O |
0.73 |
0.72 |
0.71 |
25.48 |
26.59 |
27.71 |
22.57 |
||
|
10 |
[Zn(HDFH-H)2].H2O |
0.72 |
0.70 |
0.69 |
26.59 |
28.73 |
30.05 |
23.06 |
||
|
HL3 |
HDPH C12H15O2N3 |
0.54 |
0.53 |
0.54 |
57.86 |
59.28 |
61.11 |
34.02 |
||
|
11 |
[Mn(HDPH-H)2].H2O |
0.64 |
0.62 |
0.61 |
34.61 |
37.05 |
37.96 |
26.31 |
||
|
12 |
[Co(HDPH-H)2].2H2O |
0.70 |
0.65 |
0.62 |
29.13 |
34.41 |
36.64 |
24.14 |
||
|
13 |
[Ni(HDPH-H)2].2H2O |
0.70 |
0.70 |
0.67 |
28.52 |
29.34 |
31.57 |
23.88 |
||
|
14 |
[Cu(HDPH-H)2] |
0.66 |
0.63 |
0.60 |
33.50 |
35.63 |
39.28 |
25.88 |
||
|
15 |
[Zn(HDPH-H)2].2H2O |
0.66 |
0.63 |
0.61 |
32.58 |
35.93 |
37.76 |
25.53 |
||
 |
Figure 9: Scavenging antioxidant activity of the prepared compounds. |
Conclusions
Hydrazone ligands, namely HDBH, HDFH, and HDPH, derived from 2,5-hexanedione and benzoylhydrazide or 2-furoylhydrazine or 2-picolinoyl hydrazine, were successfully employed to high-yielding synthesis of novel compounds of Mn(II), Co(II), Ni(II), Cu(II), and Zn(II). Based on stoichiometry, thermal analysis, and spectrochemical studies, it was determined that the hydrazone ligands (HDBH, HDFH, and HDPH) exhibit monobasic tridentate characteristics in all of the complexes that were produced, binding through the ONO atoms of the azomethine nitrogen, carbohydrazide oxygen, and carbonyl oxygen atoms. Using the B3LYP/6-311G(d,p) level of the Gaussian 09 program, DFT calculations were performed to investigate the optimal structures of the ligands and their complexes. The proposed geometry for all complexes conforms to an octahedral arrangement, as depicted in Figure 10. Furthermore, investigation of the antioxidant activity against the DPPH radical revealed that the ligands display enhanced radical scavenging capability compared to their respective metal complexes.
 |
Figure 10: Proposed structures for the complexes |
Acknowledgements
The authors are so grateful to the Department of Chemistry, College of Science, and University of Dohuk for giving us adequate support to do all the pivotal research work and use the department’s data.
Conflict of Interest
The authors declare that we have no conflict of interest
References
- Acheampong, K. B. D.; Kirihara, K.; Ogawa R.; Sunatsuki, Y.; Suzuki, T., Inorganica Chim. Acta., 2021, 525(5), 120464.
CrosssRef - Adejumo, T.T.; Tzouras, V.N.; Zorba, P.L.; Radanovi, D.; Pevec, A.; Grubiši, S.; Mitic, D.; Andelkovic, k. K.; Vougioukalakis , C. G.; Cobeljic, B. and Turel, I., Molecules, 2020, 25, 1-18.
CrosssRef - Pahont, E.; Diana-Carolina, I.; Shova, S.;Oprean,C.; Paunescu,V.; Olaru , T.O.; Rădulescu, S. F.; Gulea, A.; Rosu, T. and Drăgănescu, D., Molecules, 2017, 22(650):1-17.
CrosssRef - Alfares, A. A.; Alnuaimy, L. A. and Al-Daher, A.GM., Egypt. J. Chem., 2022, 65(1),271-278.
- Sellitepe, H.E.; Oh, J.M.; Dogan, I.S.; Yildirim ,S.; Aksel , B.A.; Jeong , S.G.; Khames, A.; Abdelgawad, A.M.; Gambacorta, N.; Nicolotti, O.; Mathew, B. and Kim, H., Appl. Sci., 2021,11(5830):1-16.
CrosssRef - Abouzayed, I. F.; Emam, M. S.;Abouel-Enein, A.S., J. Mol. Struct., 2020, 1216, 128314.
CrosssRef - Shaikh, I.; Jadeja, N. R,; Patel, R.; Mevada, V. and Gupta, K.V., J. Mol. Struct., 2021, 1232(130051).
CrosssRef - Kose, M.; Akgün, E. and Ceyhan, G., J. Mol. Struct., 2015, 1101(3), 33-40.
CrosssRef - Gaber, A.; Belal, A.M.A.; El-deen, M.I.; Hassan,N.; Zakaria, R.;Alsanie, F.W.;Naglah, M.A. and Refat, S. M., Crystals., 2021, 300(11), 1-17.
CrosssRef - Abou-Melha, S.K.; Al-Hazmi, A.G.; Althagafi, I.; Alharbi, A.; Shaaban, F.; El-Metwaly, M.N.; El-Bindary, A. A. and El-Bindary, A. M., J. Mol. Liq., 2021,334, 116498.
CrosssRef - Mangalam, A. N.; Kurup, M. R. P.; Suresh, E.; Kaya, S. and Serdaroğlu, G., J.Mol.Struct., 2021,1232,129978.
CrosssRef - Sheeja, S.R.; Mangalam, A. M.; Sithambaresan, M.; Prathapachandra Kurup, R. M.; Kaya, S. and Serdaroğlu, G., J. Mol. Struct., 2021, 1245, 131001.
CrosssRef - Mitu, L.; Ilis, M.; Raman, N.; Imran, M. and Ravichandran, S., E-Journal Chem., 2012, 9(1), 365-372.
CrosssRef - Aly, A. S., J. Radiat. Res. Appl. Sci., 2017,10(2),1-8.
- Zülfikaroğlu, A.; Yüksektepe Ataol, Ç.; Çelikoğlu, E.; Çelikoğlu, U. and İdil, Ö., J.Mol.Struct., 2020, 1199, 127012.
CrosssRef - Jeragh, B. and El-Asmy A. A., Spectrochim. Acta – Part A Mol. Biomol. Spectrosc., 2014, 129, 307-313.
CrosssRef - El-Sayed, E. M. A.; Al-Fulaij, A. O.; Elaasar, A. A.; El-Defrawy, M. M. and El-Asmy, A. A., Spectrochim. Acta – Part A Mol. Biomol. Spectrosc., 2015, 135, 211-218.
CrosssRef - Balapoor, L.; Bikas, R. and Dargahi, M., Inorganica Chim. Acta, 2020, 510(3), 119734.
CrosssRef - Devi, J.; Batra, N. and Malhotra, R., Spectrochim. Acta -Part A Mol. Biomol. Spectrosc., 2012, 97,397-405.
CrosssRef - Singh, P. V.; Singh, S.; Singh, P. D.;Tiwari, K.; Mishra, M. and Butche, R. J., Polyhedron, 2013,56,71-81.
CrosssRef - El-saied, A. F.; Shakdofa, M.E.M.; Al-Hakimi, N.A. and Shakdofa, M. E.A., Appl. Organomet. Chem., 2020,34(11),1-11.
CrosssRef - Halli, B. M. and Sumathi, B. R., J. Mol. Struct., 2012,1022,130-138.
CrosssRef - Santiago, H.O. P.; Santiago, B.M.; Martins, H.G.M. and Gatto,C.C., Inorganica Chim. Acta., 2020,508(3),119632.
CrosssRef - Jeragh, B.; Ali, S.M. and El-Asmy, A.A., Spectrochim. Acta-Part A Mol. Biomol. Spectrosc., 2015,150,504-513.
CrosssRef - Pocrnić, M.; Kontrec, D.; Miljanić, S.; Soldin, Ž.; Budimir, A. and Galić, N., J. Mol. Struct., 2021,1227.
CrosssRef - Cao, W.; Liu, Y.; Zhang, T. and Jia, J., Polyhedron, 2018, 147, 62-68.
CrosssRef - Al-Kadhi, S.N.; Alamro, S. F.; Popoola, A.V.; Gomha, S. M.; Bedowr, N.S.; Al-Juhani, S.S. and Ahmed A.H., Molecules, 2022, 27(14), 1-11.
CrosssRef - Soayed, A.A.; Refaat, M.V. and Sinha, L., J. Saudi. Chem. Soc., 2014,19(2), 217-226.
CrosssRef - Çınarlı, M.; Yüksektepe, Ç. A.; Çınarlı, E. and İdil, Ö., J. Mol. Struct., 2020, 1213, 128152.
CrosssRef - Rakha, H.T.; El-Gammal, A.O.; Metwally, M.H. and Abu El-Reash, M.G., J. Mol. Struct., 2014, 1062, 96-109.
CrosssRef - Shakdofa, M.E.M.; Morsy, A.N.; Rasras, J.A.; Al-Hakimi, N.A. and Shakdofa M.E.A., Appl. Organomet. Chem., 2020, 35(2),1-19.
CrosssRef - Abu-Dief, M.A.; El-khatib, M.R.; Sayed, .M El.S.; Alzahrani,S.; Alkhatib, F.; El-Sarrag, G. and Ismael, M., J. Mol. Struct., 2021,1244, 131017.
CrosssRef - Khalil, E.T.; Dahlous, A.K.; Soliman, M.S.; Khalil, A.N.; El-faham, A. and El-dissouky, A., molecules. 2022, 27,2989.
CrosssRef

This work is licensed under a Creative Commons Attribution 4.0 International License.
About The Author
![]()
A New Edition of Web of Science
Journal Impact Factor
2022: 0.5
Five Year: 0.8
Journal is Indexed in

Cabells Whitelist
![]()


