Synthesis, Characterization and Catalytic application of Mn-MFI prepared by Different Methods
Mohamed Sayed Thabet*
Chemistry Department, College of Science, Jazan University, Jazan, Saudi Arabia.
Corresponding Author E-mail: mthabet@jazanu.edu.sa
DOI : http://dx.doi.org/10.13005/ojc/390627
Article Received on : 29 Sep 2023
Article Accepted on :
Article Published : 07 Nov 2023
Reviewed by: Dr. Hossameldeen Galal Moursy
Second Review by: Dr. Aly Ahmed Soliman
Final Approval by: Dr. Usama. A. Soliman
Utilizing various techniques, the synthesis of silicalite-1 (MFI), Mn-MFIin-situ, and Mn-MFIImp samples derived from rice husk has been studied. Several physico-chemical approaches were used to characterize the produced materials. The results showed that the addition of Mn ions through in-situ preparation methods will result in a rearrangement of Silicalite's structural composition and disappearance of quartz silica. The presence of crystalline MnO2 species was noted in Mn-MFIin-situ, dealumination, and a decrease in cell volume. According to XRD, ESR, and surface texture analyses, all of the samples' FTIR spectra showed MFI structure and good assimilation of Mn species into MFI channels. The catalytic activity of the samples was measured and judged to be toward hydroxylation of benzene at a temperature of 80 degrees Celsius. The data revealed that the catalytic activity occurred in the following order: Silicalite > Mn-MFIimp > Mn-MFIin-situ.
KEYWORDS:Catalytic Activity; Hydroxylation; Rice Husk; Silicalite, Zeolite
Download this article as:| Copy the following to cite this article: Thabet M. S. Synthesis, Characterization and Catalytic application of Mn-MFI prepared by Different Methods. Orient J Chem 2023;39(6). |
| Copy the following to cite this URL: Thabet M. S. Synthesis, Characterization and Catalytic application of Mn-MFI prepared by Different Methods. Orient J Chem 2023;39(6). Available from: https://bit.ly/3MBJYKJ |
Introduction
In the fields of fibers, resins, plasticizers, agrochemicals, antioxidants, and medications, phenol is a crucial chemical. The direct hydroxylation of benzene is extremely interesting from the point of view for both scientific and industrial perspectives1–3. Due to the challenges of direct hydroxylation of energetically stable benzene and production of a ketone as a byproduct in commonly used cumene methods, the one-step hydroxylation of benzene to phenol is a complex reaction. As a result, there is a lot of work being done to create a novel method for benzene oxidation that can be used to synthesize phenol4,5.
Various researches used silica-based molecular sieves as catalysts in a variety of industrial applications from the refinement of crude oil to the fabrication of intermediates and cosmetic chemicals and exhibit extraordinary catalytic capabilities 6,7.
A molecular sieve made of microporous silicon called Silicalite-1 has a tetrahedral MFI structure8,9. It has been noted that new molecular sieves with selective oxidation capabilities can be produced by isomorphous substituting Silicon (vi) ions in framework of silicalite-1 with tetra- and pentavalent ions like Titanium, Vanadium or Tin 10,11. It has been demonstrated that the silica minerals Ti, V and Sn silicalite-1 have special catalytic capabilities in oxidation reactions using H2O2 as the oxidant12,13.
There have been reports of the production of high-quality inorganic membranes for catalytic membrane reactors using isomorphous substituting the trivalent ions Al3+, B3+, Fe3+, and Ge3+ for the Si4+ ions in silicalite-114,15. The high-silica aluminosilicate molecular sieve (zeolites) known as aluminum-containing silicalite-1 (ZSM-5) exhibits significant importance as catalytic materials For the inclusion of manganese into silicalite-1, two synthetic techniques have been described 16,17
recrystallizing Mn(II)-exchanged magadiite into Mn-silicalite-118,19. MnMCM-41 produced by the direct hydrothermal and template ion exchange techniques was characterized by Parvulescu 20. Zhou hypothesized that manganese (II and III) coexisted in the Mn-MCM-41 samples made using different techniques and that a significant portion of Mn species may be integrated to the MCM-41 framework made using the direct hydrothermal technique. The coexistence of manganese cations was examined using electron spin resonance (ESR) and X-ray absorption near edge structure (XANES) 21. Mn-MCM-41 produced by the DHT technique under mildly alkaline circumstances, framework Mn2+ was found21. The authors hypothesized that, in addition to the existence of extra-framework Mn2+, thermal treatment in air might cause the convert (oxidation) of Mn2+ to Mn3+ in the framework structure. Furthermore, It was predicted to result in extra-framework-framework interactions with manganese 21.
Because Mn can be obtained from the starting gel and Al can be replaced by Mn in an isomorphous manner, it was thus obliged to be included in the MFI framework. It was done to synthesize Mn/MFI using various preparations, such as in-situ integration and impregnation techniques. Surface textural examination, FTIR spectroscopy, and X-ray diffraction were employed to describe the sample preparation. Finally, UV-vis spectroscopy was used to examine the hydroxylation of benzene to phenol in all generated samples.
Experimental
Materials
Sodium hydroxide pellets (AR 98%), Mn (NO3)2, tetrapropylammonium bromide (TPABr, Fluka), n-propyl amine (n-PA, Merck), rice husk powder RHs (made in this work), and commercial H2SO4 were the ingredients employed.
Silica preparation from rice husk
cleaning Filtration, air drying, and calcination at 750°C for 6 hours (white ash) are the steps that are used to remove any remaining mud and rice particles from rice husk before drying. 12g of calcined RHs were combined with 150 ml of a 4M NaOH solution and heated at 90 ⁰C under reflux for 12 hours. For full precipitation, concentrated hydrochloric acid (20 ml) were added to RHs sample, rinsed in deionized water, filtered and repeated the previous step to remove chloride ions. Finally, the sample was dried at 120°C for 6 hours.
Silicalite preparation (MFI)
synthesize silicalite-1, the hydrogels with the succeeding oxide molar compositions were formed using the molar ratios:
Na2O: SiO2:0:185: 3:12Na2O: 6:185TPAB: 100H2O
Rice husk-derived silica was mixed with a little amount of water (about 40 ml) and a precise amount of NaOH, then warmed until a transparent solution was obtained at 80 ⁰C. In contrast, dissolve templet in little amount of water (10 ml) then heated at 50°C for 20 minutes. The sodium silicate solution received the TPABr solution while being stirred for 15 minutes. As a mobilizing agent, 1 ml of n-propyl amine was applied 22,23. Using 0.1 M sodium hydroxide and sulphuric acid solutions, the mixture’s pH was adjusted to 11. The mixture was then converted to an oil bath hydrothermal treatment for 8 days at 150 ⁰C using autoclaves. At the appointed time, taken out from bath and immediately cooled with cold water. The solid product was filtered and washed with distilled water once the pH of the filtrate dropped to 8. The products were calcined in an air oven for 6 hours at 550°C after being dried at 110°C for 10 hours. This sample is marked as MFI.
Preparation of Mn–MFI (built-in)
The following molar ratio description of the synthesis process is given:
SiO2: 0.185TPABr: 100H2O: 3:12Na2O: 0.0138MnO2: 6.18SiO2
The template tetra propylammonium bromides (TPABr) and the mobilizing agent n-propyl amine were combined with the sodium silicate solution. While continuously stirring for 30 minutes, a appropriate amount of manganese nitrate solution was added slowly to the prior solution. adjust the mixture’s pH value to 11.0. The amorphous gel was created and aged at room temperature for one hour. The mixture was put into autoclaves and kept there while being heated in an oil bath to 150°C and kept under naturally occurring pressure. The procedure was followed exactly as it was for the sample above, and Mn-MFIin was known as the material.
Mn-loaded MFI by impregnation
Manganese-MFI sample was created by incipient wetness impregnation of MFI (made in this study) with an appropriate amount of Mn (NO3)2 in an aqueous solution, calculated to provide the necessary percentage of 5wt % MnO2. The amount of solution required to completely wet the zeolite carrier, along with the slurry’s pH of about 6, allowed for this. The reaction temperature was set at 80 ⁰C, and the mixture was continually agitated until the extra water evaporated. The precursor was further dried at 120 °C over the course of an overnight period, and the decomposition was then conducted in air with a temperature controller of the REX-P 90 type while gradually rising temperature up to 500 °C. The preparation was held at this calcination temperature for six hours, during which little Mn was lost.
Instrumental techniques
A Philips diffractometer (PW-3710) was used to measure the X-ray diffractograms of various MFI samples. 30 kV, 10 mA, and a 2 ⁰/min scanning rate, the patterns were operated using Ni-filtered copper radiation (K = 1.5404). The Scherrer equation was used to calculate the prepared materials’ crystal sizes. The crystallinity of the samples was calculated as the ratio of the most intense peaks for modified MFI samples (2θ = 20-230) to that of the same peaks for the prepared MFI, and this value was multiplied by 100. The Fourier transform infrared (FTIR) spectra were captured using the Jasco FT-IR-40, a single beam spectrometer with a resolution of 2 cm-1. Two measurements were made at 3800-3000 cm-1 and 1400-400 cm-1 at room temperature. At -196 °C, the nitrogen adsorption isotherms were estimated. The specific surface area was evaluated using the BET method. The exterior surface area and micropore volume were estimated using the t-plot method. Catalytic activity test
The procedure was carried out in a solvent-free reactor system. The mixture was stirred and heated the catalyst was dried at 383K to separate impurities and water, 50 cm3 of benzene (Merck, 99.7%), 2 cm3 of H2O2 (30% wt./wt.), and 0.1g of catalyst were added dropwise to a typical reaction mixture; the reaction took about 30 minutes. To agitate the reaction mixture, a magnetic stirrer was offered. The reaction mixture underwent another 70 minutes of stirring after all the H2O2 had been added. After that, the 4-aminoantipyrene method of spectrophotometer was used to detect the concentration of phenol 24,25.
Result and discussion
XRD
Fig. 1 displays the X-ray diffractograms of pure MFI, Mn-MFIin, and Mn-MFIimp. In silicalite and Mn/MFIimp samples, XRD patterns display a broad line at d = 4.2546 and 3.343; this line is indicative of the quartz (Si3O6) phase26,27. The sample Mn-MFIin, on the other hand, did not confirm the presence of quartz silica; hence, the introduction of Mn ions through in-situ preparation methods will cause a rearrangement of the structure of silicalite and disappearance of quartz silica.
 |
Figure 1: XRD of the MFI and modified by different methods |
Although the presence of MnO2 species in Mn-MFIimp was not confirmed by comparing the samples before and after the addition of Mn, a little amount of this phase’s crystalline structure is seen in Mn-MFIin at d = 5.134 and 1.666. In contrast to these findings, the pattern of Mn/MFIimp revealed a notable overall drop in diffraction line intensity. The lattice properties and unit cell volume of the samples are summarized in Table 1.
comparing the volume and cell unit characteristics for Mn/MFIimp. And Mn/MFIin demonstrated that: i) the Mn ions were deeply induced into the lattice. ii) Partially dealumination may occur during the impregnation method, as shown by the decrease in cell volume in the Mn/MFIimp sample. This is also supported by a significant impact on the entry of Mn ions into samples.
Table 1: Effects of different preparation methods on unit cell characteristics, cell volume, crystallinity, and crystallite size of zeolite samples.
|
Samples |
Crystal size (nm) |
Unit cell (Å) |
Cell Vol. (Å)3 |
Relative crystallinity % |
||
|
a |
b |
c |
||||
|
MFI |
108 |
20.105 |
20.046 |
13.429 |
5412 |
80 |
|
Mn-MFI imp |
119 |
19.741 |
20.041 |
13.421 |
5309 |
56 |
|
Mn-MFI in |
135 |
19.805 |
20.132 |
13.712 |
5467 |
100 |
Note: a, b, c is the lattice parameters (Å), V is the lattice volume (Å)3; a*b*c., D is the particles diameter (Å). The crystallinity percentages were obtained by XRD from the sum of the maximum line intensities from 2θ: 20-23 Å
Framework structure
As-prepared MFI, Mn-MFIin, and Mn-MFIimp samples’ FTIR spectra are depicted in Fig. 2a, the samples’ spectra all display a typical MFI structure with modest modifications from the addition of Mn. The bands at 1235 and 1083 cm-1 refer to TO4 asymmetric stretching vibration 28-30, whereas the other absorption bands at 796, 550, and 453 cm-1 related directly to TO4 symmetric stretching, double ring, and bending vibrations, respectively. The Mn-MFIin IR spectrum exhibits absorption bands at 1229 (1235) and 1085 (1049) cm-1 that have been modified to relatively lower wave numbers, indicating good assimilation of Mn species into MFI channels, probably in compensating positions29.
Importantly, The Mn- MFIin splits into 1120 cm-1 in the internal asymmetric stretching vibration of Si-O-T for aluminosilicate (parent MFI), which is found at 1095 cm-1 beyond the continued existence of the one at 1049 cm-1. This might be as a result of residual Al3+ remaining close Mn3+ at the same location. It is logical to correlate a new shoulder at 615 cm-1 that was absent in the parent MFI when Mn was added to MFI using different ways with Mn-O vibrations, and more precisely with the lattice vibrations of MII-O bonds18,31,32. While it may have been inherited through MnII-O vibrations, the IR band was particularly important to the XRD observable crystalline structure of MnO2 33.
Crystallinity bands at 450 cm-1 (I450) and 550 cm-1 (I550) indicates the vibration of TO4 units and five-membered oxygen rings respectively 34–36, the relative crystallinity in the following order: Mn-MFIimp< MFI <Mn-MFIin, as shown in Table 1 which agrees with the estimate from the XRD analysis.
In Figure 2b, the IR spectra of the parent MFI zeolite and the Mn-MFI (made using various techniques) are compared in the OH- absorption zone (3800-3400 cm-1). The following bands can be seen in the parent Na-MFI zeolite’s spectrum: The lower frequency a broad band at about 3513 cm-1 is attributable to hydrogen bound Si-OH species, and the higher frequency a narrow band at about 3747 and 3662 cm-1 is due to the O-H stretching vibrations of terminal silanols groups26,37. (placed on the exterior surface and weakly acidic). It is possible that silanols with oxygen atoms involved in H-bodings with closer hydroxyls are the cause of the shoulders at 3665 cm-1.
Mn incorporation (Mn-MFIin) causes the band intensity of the terminal Si-OH groups of MFI to increase together with the disappearance of the band at 3665cm-1. Three new bands simultaneously arise in Mn/ZSM-5 at 3699, 3628, and 3589 cm-1. The former band is representative of OH groups at Mn atoms in non-framework locations, whereas the latter ones reflect acidic hydroxyls of different strengths. This could show the existence of Mn cations in various locations inside ZSM-5 channels38–40.
 |
Figure 2: a) FTIR spectra of MFI, Mn-MFIin and Mn-MFIimp samples b) region of hydroxyl group absorption zone. |
On the other hand, the Mn-MFIimp sample, when compared to the Mn-MFIin sample, exhibits the same band at 3740, 3678, and 3615 cm-1, but with a lower intensity. A Contrarily, a considerable drop in this band’s strength after integration suggests that it does play a role in facilitating the interaction with metal ions. Further evidence that this band’s profile has been expanded to support the requirements for advancing the dealumination process can be found in the Mn-MFI spectrum41.
Surface texture
In (figure 3 and Table 2), surface texture data were examined and summarized. Examining the data reveals the following information. (i) The in-situ method-prepared sample had the highest specific surface area, whereas Mn-impregnating MFI sample measured the lowest. (ii) The SBET and St values are comparable, showing that the studied solids don’t contain ultra-micropores. (iii) The difference of more than 10% between the Sext and the SBET values for the same samples suggests the presence of mesoporosity features. (iv) The mesoporosity of these samples was confirmed by the average pore radius values of comparable materials. (v) In comparison to parallels for as-prepared MFI, the Mn/MFIin samples measured the highest SBET (38%) and Vptotal (25%) values. (vi) The Mn/MFIin recorded a greater Vp value compared to the comparable value for other samples, which may be because Mn ions were incorporated in some sites, which reduced the size of wide pores and exposed more microporous features.
Table 2: Surface texture analysis of prepared samples in a particular situation.
|
Sample |
SBET (m2/g) |
St (m2/g) |
Vptotal (m3/g) |
Vpµ (m3/g) |
Vpwid (m3/g) |
Sext (m2/g) |
S µ (m2/g) |
S wid (m2/g) |
r¯ (Å) |
Microporosity % |
|
MFI |
515 |
519 |
0.481 |
0.430 |
0.051 |
36 |
460 |
55 |
24 |
89 |
|
Mn/MFIimp |
463 |
456 |
0.428 |
0.388 |
0.040 |
28 |
419 |
44 |
23 |
91 |
|
Mn/MFIin |
637 |
550 |
0.528 |
0.393 |
0.135 |
105 |
474 |
163 |
21 |
74 |
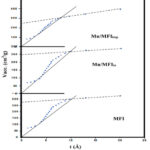 |
Figure 3: The surface textures of MFI, Mn-MFIin, and Mn-MFIimp samples. |
EPR spectroscopy
EPR spectra (Figure 4) depicts the Mn-MFIin and Mn-MFIimp., Zero field transitions were visible in the Mn-MFIin. A well-resolved hyperfine sextet typical of MnII was visible in the spectra of as-synthesized Mn-MFIimp. EPR spectroscopy can also provide information about MnII integrated into the ZSM-5 lattice. It is widely known that MnII ions randomly orientated in inorganic matrixes where axial symmetry has been imposed exhibit EPR spectra. The outside transitions are not recorded, and the Ms =1/2 -1/2 resonance dominates the spectra27,42,43. As previously reported, the MnII/Z X- The band spectrum displays a sharp hyperfine sextet with I = 5/2, S = 5/2 at g=1.9844 and A = 87.5 G. With a tiny zero-field splitting, the primary resonance’s location at a g value extremely near to 2 and the observation of well-resolved hyperfine coupling are consistent.
 |
Figure 4: EPR spectra of Mn-MFIin and Mn-MFIimp |
Test reaction
The relative amounts of phenol hydroxylation and H2O2 breakdown reactions vary, which contributes to the variance in the activity of the catalysts. Given their ease in switching between two valences, metals with larger redox potentials tend to breakdown H2O2 more, Mn (III) converted to Mn (II) have a 1.82V redox potential. This means that Mn-MFIimp > silicalite > Mn-MFI (built-in) would be the expected order of increasing H2O2 decomposition activity of the catalysts44,45.
The ratio of the two reactions’ rates will determine the phenol conversions that are seen over the various catalysts: According to observations of the conversion of phenol, the sequence of activity is silicalite > Mn-MFIimp > Mn-MFIinsitu (built-in). The metal ions that breakdown H2O2 quickly (Mn) will be less effective as catalysts for phenol hydroxylation, according to the reverse ordering of phenol hydroxylation activity and anticipated H2O2 decomposition activity. According to the results, silicalite, Mn-MFIimp, and Mn-MFIinsitu catalysts’ catalytic activity and metal ion redox potential are clearly correlated. It is also clear from studies on catalyst concentration that, for silicalite, increasing catalyst concentration from 0.03 to 0.06 g/L significantly reduces phenol hydroxylation. However, the effect was less pronounced for Mn-MFIinsitu, and for silicalite, the activity is suppressed with increasing catalyst concentration.
Conclusion
The process of modification of silicalite with Mn has been successfully carried out using in situ and impregnation techniques. The obtained material was characterized in order to get a full mapping for the surface and entire framework characteristics. Furthermore, the catalytic activity of the obtained material was examined for the hydroxylation of benzene. The data obtained indicate the formation of phenol as a preliminary step of the oxidation process.
Acknowledgment
I would like to thank the department members
Conflict of Interest
Author have no conflict of interest.
References
- Sun, Z.; Fridrich, B.; De Santi, A.; Elangovan, S.; Barta, K. Chem. Rev. 2018, 118 (2), 614–678.
CrossRef - Ali, I. O.; El Sayed, H. A.; El-Nasser, K. S.; Shabana, A. A. J Therm Anal Calorim 2016, 123 (2), 1129–1139.
CrossRef - Ali, I. O.; Hanafy, A. I.; Salama, T. M.; El-Nasser, K. S.; El-Henawy, A. A.; Guma, H. A.; Mohamed, H. M. Microporous and Mesoporous Materials 2018, 262, 35–48.
CrossRef - Einaga, H.; Maeda, N.; Teraoka, Y. Applied Catalysis B: Environmental 2013, 142, 406–413.
CrossRef - Einaga, H.; Yamamoto, S.; Maeda, N.; Teraoka, Y. Catalysis Today 2015, 242, 287–293.
CrossRef - Orazov, M.; Davis, M. E. Chemical Science 2016, 7 (3), 2264–2274.
CrossRef - Rahmani, N.; Amiri, A.; Ziarani, G. M.; Badiei, A. Molecular Catalysis 2021, 515, 111873.
CrossRef - Su, X.; Hu, Z.-P.; Han, J.; Jia, Y.; Xu, S.; Zhang, J.; Fan, D.; Wei, Y.; Liu, Z. Microporous and Mesoporous Materials 2023, 348, 112371.
CrossRef - Su, X.; Hu, Z.-P.; Han, J.; Wei, Y.; Liu, Z. Crystal Growth & Design 2023, 23 (4), 2644–2651.
CrossRef - Domoroshchina, E. N.; Svetogorov, R. D.; Kuz’micheva, G. M.; Kravchenko, G. V.; Pirutko, L. V.; Zhukova, A. I.; Utenyshev, A. N.; Bozhenko, K. V. J Mater Sci 2023, 58 (9), 3934–3946.
CrossRef - Yabushita, M.; Yoshida, M.; Muto, F.; Horie, M.; Kunitake, Y.; Nishitoba, T.; Maki, S.; Kanie, K.; Yokoi, T.; Muramatsu, A. Molecular Catalysis 2019, 478, 110579.
CrossRef - Stadler, B. M.; Wulf, C.; Werner, T.; Tin, S.; De Vries, J. G. ACS Catal. 2019, 9 (9), 8012–8067.
CrossRef - Tsaplin, D. E.; Ostroumova, V. A.; Kulikov, L. A.; Zolotukhina, A. V.; Sadovnikov, A. A.; Kryuchkov, M. D.; Egazaryants, S. V.; Maksimov, A. L.; Wang, K.; Luo, Z. Catalysts 2023, 13 (2), 216.
CrossRef - Wang, C.; Zhang, J.; Zheng, W.; Ren, Y.; Yue, B.; He, H. In Industrial Arene Chemistry; Mortier, J., Ed.; Wiley, 2023; pp 1385–1410.
CrossRef - Rahmah, W.; Novita, T. H.; Wenten, I. G.; Kadja, G. T. Materials Today Sustainability 2023, 100345.
CrossRef - Tao, P.; Wang, X.; Zhao, Q.; Guo, H.; Liu, L.; Qi, X.; Cui, W. Applied Catalysis B: Environmental 2023, 325, 122392.
CrossRef - Zhu, C.; Huang, C.; Zhang, M.; Fang, K. Fuel 2023, 335, 126745.
CrossRef - Tušar, N. N.; Logar, N. Z.; Arčon, I.; Thibault-Starzyk, F.; Ristić, A.; Rajić, N.; Kaučič, V. Chem. Mater. 2003, 15 (25), 4745–4750.
CrossRef - Zhao, J.; Zhang, Y.; Zhang, S.; Wang, Q.; Chen, M.; Hu, T.; Meng, C. Microporous and Mesoporous Materials 2018, 268, 16–24.
CrossRef - Parvulescu, V. In Redox; Intech Open, 2019.
- Zhou, S.; Yang, F.; Wang, B.; Su, H.; Lu, K.; Ding, Y.; Lei, K.; Xu, M.; Shao, B.; Wang, Y. Catalysts 2018, 8 (2), 80.
CrossRef - Salam, M. A.; Ahmed, K.; Hossain, T.; Habib, M. S.; Uddin, M. S.; Papri, N. International Journal Of Chemistry, Mathematics And Physics (IJCMP) 2019, 3 (6).
CrossRef - Khaleque, A.; Alam, M. M.; Hoque, M.; Mondal, S.; Haider, J. B.; Xu, B.; Johir, M. A. H.; Karmakar, A. K.; Zhou, J. L.; Ahmed, M. B. Environmental Advances 2020, 2, 100019.
CrossRef - Zeng, Z.; Tian, L.; Li, Z.; Jia, L.; Zhang, X.; Xia, M.; Hu, Y. Biosensors and Bioelectronics 2015, 69, 162–166.
CrossRef - Fernando, C. D.; Soysa, P. Methods X 2015, 2, 283–291.
CrossRef - Sun, Z.; Yan, Y.; Li, G.; Zhang, Y.; Tang, Y. Ind. Eng. Chem. Res. 2017, 56 (39), 11167–11174.
CrossRef - Patra, A. K.; Dutta, A.; Pramanik, M.; Nandi, M.; Uyama, H.; Bhaumik, A. Chem. Cat. Chem 2014, 6 (1), 220–229.
CrossRef - Wang, Y.; Jia, H.; Fang, X.; Qiu, Z.; Du, T. RSC advances 2020, 10 (41), 24642–24652.
CrossRef - Meng, Y.; Genuino, H. C.; Kuo, C.-H.; Huang, H.; Chen, S.-Y.; Zhang, L.; Rossi, A.; Suib, S. L. J. Am. Chem. Soc. 2013, 135 (23), 8594–8605.
CrossRef - Zhang, Y.; Yu, Q.; Tang, X.; Zhao, S.; Gao, F.; Yuan, Y.; Zhang, J.; Wei, J.; Yi, H. Separation and Purification Technology 2022, 300, 121687.
CrossRef - Rac, V.; Rakić, V.; Damjanović-Vasilić, L.; Dondur, V.; Auroux, A. Applied Surface Science 2017, 423, 1134–1140.
CrossRef - Baran, R.; Valentin, L.; Dzwigaj, S. Physical Chemistry Chemical Physics 2016, 18 (17), 12050–12057.
CrossRef - Dinh, V.-P.; Luu, T. A.; Siemek, K.; Kozlenko, D. P.; Le, K. H.; Dang, N. T.; Nguyen, T. V.; Le Phuc, N.; Tran, T. D.; Phan, P. T.; Lo, S. T.; Hoang, K. A. T.; Dinh, T. K.; Luong, N. T.; Le, N. C.; Nguyen, N.-T.; Ho, T.-H.; Tran, X. D.; Tran, P. D.; Nguyen, H. Q. Langmuir 2022, 38 (50), 15604–15613.
CrossRef - Pop, O. L.; Diaconeasa, Z.; Mesaroş, A.; Vodnar, D. C.; Cuibus, L.; Ciontea, L.; Socaciu, C. Bulletin UASVM Food Science and Technology 2015, 72 (1), 50–55.
CrossRef - Meng, Y.; Genuino, H. C.; Kuo, C.-H.; Huang, H.; Chen, S.-Y.; Zhang, L.; Rossi, A.; Suib, S. L. J. Am. Chem. Soc. 2013, 135 (23), 8594–8605.
CrossRef - Razavian, M.; Fatemi, S.; Komasi, M. Materials Research Bulletin 2015, 65, 253–259.
- Koshti, H.; Bandyopadhyay, M.; Bandyopadhyay, R. J Mater Sci 2023, 58 (29), 11914–11936.
CrossRef - Zhang, P.; Yang, X.; Hou, X.; Mi, J.; Yuan, Z.; Huang, J.; Stampfl, C. Catalysis Science & Technology 2019, 9 (22), 6297–6307.
CrossRef - Ben Younes, N.; Ortigosa, J. M.; Marie, O.; Blasco, T.; Mhamdi, M. Res Chem Intermed 2021, 47 (5), 2003–2028.
CrossRef - Kamaluddin, H. S.; Gong, X.; Ma, P.; Narasimharao, K.; Chowdhury, A. D.; Mokhtar, M. Materials Today Chemistry 2022, 26, 101061.
CrossRef - Dubray, F. PhD Thesis, Normandie Université, 2020.
- Montejo-Valencia, B. D.; Pagán-Torres, Y. J.; Martínez-Iñesta, M. M.; Curet-Arana, M. C. ACS Catal. 2017, 7 (10), 6719–6728.
CrossRef - Ali, I. O.; Hanafy, A. I.; Salama, T. M.; El-Nasser, K. S.; El‐Henawy, A. A.; Guma, H. A.; Mohamed, H. M. Microporous and Mesoporous Materials 2018, 262, 35–48.
CrossRef - Wang, J. Nano-Micro Lett. 2022, 14 (1), 94. (45) Li, C.
CrossRef - Chen, J. Nature communications 2015, 6 (1), 7345.
- Gao, Y.; Pan, Z.; Sun, J.; Liu, Z.; Wang, J. Nano-Micro Lett. 2022, 14 (1), 94.
CrossRef - Li, C.; Han, X.; Cheng, F.; Hu, Y.; Chen, C.; Chen, J. Nature communications 2015, 6 (1), 7345.

This work is licensed under a Creative Commons Attribution 4.0 International License.
About The Author
![]()
A New Edition of Web of Science
Journal Impact Factor
2022: 0.5
Five Year: 0.8
Journal is Indexed in

Cabells Whitelist
![]()


