Applications of Guar Gum 6-Amino Caproic Acid (GACA) Resin for Extraction of Cobalt and Zinc Metal Ions from References Waste Water Using Batch Method
Punam Singh Bhati* , Ishwar Singh, and Aresh Vikram Singh
Analytical lab, Department of Chemistry, J.N.V.U, Jodhpur (Rajasthan) India.
Corresponding Author E-mail: BhatiPunamSingh@gmail.com
DOI : http://dx.doi.org/10.13005/ojc/390611
Article Received on : 04 Sep 2023
Article Accepted on :
Article Published : 07 Nov 2023
Reviewed by: Dr. Naresh Batham
Second Review by: Dr. Sarika Nagar
Final Approval by: Dr Rosmawani Binti Mohammad
Natural Guar gum based resin which containing 6-amino caproic acid as a functional group has been synthesized. This modified ion exchange resin was used for removal of toxic metal ions from synthetic waste water using the principle of ion exchange mechanism. GACA resin was used for removal of Zn (II) and Co (II) metal ions from aqueous solution containing these metal ions. Zn (II) ion show maximum adsorption and Kd value at pH 5 while Co (II) show at pH 6. Zn (II) show maximum adsorption on GACA resin is 81.34% and for Co (II) is 73.3% which is good result.
KEYWORDS:Adsorption; Contamination; GACA Resin; Ion Exchange; Metal Ions
Download this article as:| Copy the following to cite this article: Bhati P. S, Singh I, Singh A. V. Applications of Guar Gum 6-Amino Caproic Acid (GACA) Resin for Extraction of Cobalt and Zinc Metal Ions from References Waste Water Using Batch Method. Orient J Chem 2023;39(6). |
| Copy the following to cite this URL: Bhati P. S, Singh I, Singh A. V. Applications of Guar Gum 6-Amino Caproic Acid (GACA) Resin for Extraction of Cobalt and Zinc Metal Ions from References Waste Water Using Batch Method. Orient J Chem 2023;39(6). Available from: https://bit.ly/49m0gkJ |
Introduction
Both natural and manmade processes could have contributed to the presence of these heavy metals on the water’s surface. Natural activities include the weathering of metal-containing rocks, volcanic eruptions, forest fires, and naturally occurring weathering processes. As a result of these actions, metal enters the various ecosystems. Heavy metals can exist in a variety of states, including sulphides, hydroxides, oxides, sulphides, phosphates, and silicates 1, 2.
The massive accumulation of heavy metals in the water is mostly caused by human and natural action. The wet and dry deposition of atmospheric salts, contact between water and rock, and water-soil interaction are other natural causes of heavy metal pollution of water.
As a response of rising petroleum product prices, polysaccharide matrix has been employed to make inexpensive, easily disposed of chelating cation or anion exchange resins. Due to its hydrophilicity, which makes the functional groups of the polysaccharide-based resin readily accessible even to macromolecules in solution, DEAE-cellulose has been used extensively for the removal of transition metal ion residues 3, 4. Guar gum derivatives are ideal candidates for removing heavy metal ions from the effluents of the non-ferrous and ferrous metal industries. Mineral industry use of commercially available polysaccharide derivatives is growing 5.
Starch and cellulose can be used to make them in huge quantities 6–9. Guar an and its derivatives are appropriate materials to be used as flocculants since they are more hydrophilic than cellulose and can be used as ion exchangers, chelating agents, coagulation factors, modifiers, thickening agents, and viscosity builders as well as depressors. Cobalt (II) and zinc (II) metal ions have been removed from aqueous solutions using polysaccharide10.
The objective of this work was to synthesize and characterize a brand-new resin based on guar gum. By utilizing guar gum 6-amino caproic acid (GACA), toxic heavy metal ions can be extracted from contaminated aqueous solution or industrial waste water 11, 12.
Chemical Structure of Guar Gum
According to a Reuter’s article, India allegedly has an 80% market share for guar goods worldwide. In the 2007–2008 fiscal years, which concluded in March 2008, India exported guar products valued 11 billion rupees. In terms of global trade, Pakistan behind India. Industrial guar gum, the most prevalent guar product, accounts for around 45% of total demand13.
The sugars galactose and mannose are the basic building blocks of guar gum, a polymer. Mannose residues are 1, 6-linked to galactose residues every other mannose in a linear chain, forming short side-branches14.
 |
Figure 1: Chemical structure of guar gum. |
Methodology
Guargum 6-Amino Caproic Acid (Gaca) Resin Synthesis
First, 13.11 gm (0.1mole) of 6-amino caproic acid was dissolved in minimal methanol in a 250 ml round bottom flask to begin the synthesis of GACA resin based on guar gum polysaccharide matrix. The aforementioned solution was then mixed with 9.25gm (0.1 mole) of epichlorohydrin while being agitated for 4 hours on a magnetic stirrer. Then, we added 4 gm of NaOH (0.1mole) dissolved in the barest minimum of water to the reaction mixture, agitated it for 5 hours on a magnetic stirrer, and let it alone whole night.
In the second phase of the synthesis, 81 gm of guar gum powder (0.5 mole) was put to a round bottom flask containing dioxane, and then 4 gm of a NaOH solution (0.1 mole) was added. The mixture was agitated on a magnetic stirrer at 65 degrees Celsius. Then, the mixture from the first phase of the reaction was added, and it was agitated constantly for 4.5 hours at 65 degrees Celsius. Following an initial wash in methanol, surplus alkali is neutralized by adding a few drops of hydrochloric acid. At last, pure methanol was used to clean it.
Synthesized resin of 6-amino caproic acid (GACA) was filtered and dried. Finally dry resin was weight on balance machine and noted the yield. The yield of GACA resin was obtained 114.8gm. Figure 2.10 shows the reaction scheme of GACA resin.
 |
Figure 2: The chemical scheme for the synthesis of GACA resin. |
pH Titration
Batch-based pH titration for guar gum derivatives. Hydrogen ions were produced from the guar gum byproduct. After rinsing the resins in water to neutralise the acid, they were dried at 60 degrees Celsius for 12 hours. We used a 0.1 g portion to fill 8-9 separate flasks with resins. Each flask was given increasingly smaller amounts of a 1 N NaCl solution, then progressively higher amounts of a 0.1 N NaOH solution. Each flask was then continuously supplied with deionized water to maintain the solution volume to resin weight ratio i.e. 25 ml of solution for 0.1 g of resin. When the solution’s pH level was steady, the magnetic stirrer was used to re-establish equilibrium in the hermetically sealed flask. The shown pH titration curves may be found in the table’s below.15.
Table 1: pH titration of guar gum 6-aminocaproic acid (GACA) resin at optimum condition.
|
Flask No. |
Vol. of 1M NaCl in ml |
Vol. of 0.1N NaOH in ml |
Vol. of deionized water |
Final pH |
|
1 |
1.8 |
0.0 |
23.2 |
4.4 |
|
2 |
1.6 |
0.4 |
23.0 |
5.4 |
|
3 |
1.4 |
0.8 |
22.8 |
6.7 |
|
4 |
1.2 |
1.2 |
22.6 |
7.9 |
|
5 |
1.0 |
1.6 |
22.4 |
8.11 |
|
6 |
0.8 |
2.0 |
22.2 |
9 |
|
7 |
0.6 |
2.4 |
22.0 |
10.01 |
|
8 |
0.4 |
2.8 |
21.8 |
10.89 |
|
9 |
0.2 |
3.2 |
21.6 |
11.23 |
|
10 |
0.00 |
3.6 |
21.4 |
12.22 |
 |
Figure 3: pH Titration curve of GACA resin. |
Ion Exchnage Capacity of Gaca Resin
The total ion exchange capacity of the resin was determined using the method described below. The capacity of the resin was determined using a back titration method. One gram of resin was added to a one liter Erlenmeyer flask containing 200 milliliters of 0.05N NaOH and 5 milliliters of 5% NaCI solution. After mixing, we let the mixture alone for the night. With phenolphthalein as the indicator, a 25 ml aliquot of the supernatant solution was back-titrated with 0.05 N HCI. The following equation is used to calculate total ion exchange capacity16, 17 [Q (Meq/g)]:
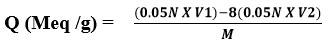
V1 is vol. of 0.05N NaOH (ml)
V2 is Vol. of 0.05N HCl (ml)
M is Weight of dry resin (gm)
Q (Meq/g) = (0.05x 200)-8(0.05x 12.22) /0.89
= (10-8(0.611) / 0.89
= (10-4.88) / 0.89
= 5.12/0.89
= 5.75
Ftir Characterization of Gaca Resin
The varied pecks at distinct regions of the GACA resin’s FTIR examination give suggestions about the functional groups in the synthesized resin. The peak found at 2113.4 cm-1 owing to amino group, 1994 cm-1, and 1833.9 cm-1 due to symmetrical and asymmetrical stretching. Peaks discovered at 3220.4 cm-1 and 2922.2 cm-1 due to the carboxylic groups.
 |
Figure 4: FTIR of GACA resin |
SEM Characterization
According to SEM micrographs of the resin’s surface, activated charcoal is discovered to contain cavities that are exactly the same size as their surface area (see fig. 5). Surfaces are heterogeneous and have a vast variety of structures. Permeable describes the real adsorbent.
 |
Figure 5: SEM of GACA resin. |
Determination of Distribution Coefficient
Chelation on a GACA resin of zinc and cobalt metal ion
Assorted amounts of 0.2 M acetic acid and 0.2 M sodium acetate were poured to various glass stoppered conical flasks to achieve the desired pH range of 2 to 7. Each flask had 0.2 M NH4OH and 0.2 M NH4Cl added to get the pH up to the needed 8. After swirling with magnets for one hour, the liquid was filtered19. The concentration of filtrates was determined by AAS for metal ions.
Observation
Table 2: Distribution coefficient of Zinc metal ion on GACA resin.
|
pH |
Absorbance |
Concentration of Zn ion in filtrate in ppm |
Amount of Zn ion in solution in mg |
Amount of Zn in resin in mg |
Kd |
% adsorption of Zn ion by synthesized resin |
Metal exchange capacity (Mg/g) |
|
2 |
1.13 |
7.1 |
0.2645 |
0.7355 |
1855.67 |
73.55 |
10.67 |
|
3 |
1.35 |
6.9 |
0.2478 |
0.7522 |
1988.67 |
75.22 |
10.87 |
|
4 |
1.33 |
6.5 |
0.2456 |
0.7544 |
3006.78 |
75.85 |
10.99 |
|
5 |
0.11 |
4.8 |
0.1866 |
0.8134 |
3244.33 |
81.34 |
11.23 |
|
6 |
1.15 |
4.5 |
0.2344 |
0.7656 |
2876.89 |
76.56 |
11.11 |
|
7 |
1.09 |
4.1 |
0.2244 |
0.7756 |
2134.67 |
77.56 |
10.77 |
|
8 |
1.25 |
4.5 |
0.2345 |
0.7655 |
1933.89 |
76.55 |
10.11 |
Inference: The highest value of distribution coefficient of Zn (II) metal ion on GACA resin was obtained at pH 5. At other pH range from 2-8 Zinc metal ion shows good adsorption on GACA resin, from the GACA resin zinc metal ion can be eluted by 0.05N HCl.
Table 3: Determination of distribution coefficient of cobalt metal ion on GACA resin.
|
pH |
Absorbance |
Concentration of Co ion in filterate in ppm |
Amount of Co ion in solution in mg |
Amount of Co ion on resin in mg |
Kd |
% adsorption of Co metal ion on synthesized resin |
Metal exchange capacity (mg/g) |
|
2 |
0.987 |
13.21 |
0.5977 |
0.4023 |
678.98 |
40.23 |
5.44 |
|
3 |
0.999 |
9.99 |
0.5445 |
0.4555 |
1122.67 |
45.55 |
6.54 |
|
4 |
1.678 |
7.98 |
0.5213 |
0.4787 |
1234.76 |
47.87 |
7.34 |
|
5 |
1.769 |
6.89 |
0.3355 |
0.6645 |
1667.77 |
66.45 |
7.88 |
|
6 |
0.222 |
5.45 |
0.2667 |
0.7333 |
2544.45 |
73.33 |
10.33 |
|
7 |
0.342 |
7.23 |
0.2989 |
0.7011 |
2333.44 |
70.11 |
6.45 |
|
8 |
0.543 |
7.11 |
0.3411 |
0.6589 |
2198.90 |
65.89 |
6.33 |
Inference: The highest value of distribution coefficient of Ni (II) metal ion on GACA resin was obtained at pH 6. At other pH range from 2-8 nickel metal ion shows good adsorption on GACA resin, from the GACA resin nickel metal ion can be eluted by 1.0 N HCl.
Table 4: Maximum % adsorption was found of zinc and cobalt metal ions by GACA resin at optimum conditions.
|
Metal ion |
% adsorption on GACA resin |
|
Zn(II) |
81.34 |
|
Co(II) |
73.3 |
 |
Figure 6: Adsorption in % of zinc and cobalt metal ion by GACA resin. |
Table 5: Kd values of zinc and cobalt metal ions by GACA resin
|
Metal ions |
Kd value |
|
Zn(II) |
3244.33 |
|
Co(II) |
2544.45 |
Results and Discussions
When it comes to cleaning up polluted water and industrial waste, GACA resin is second to none in terms of selectivity. The data suggest that, when pH rises, kd values initially rise and subsequently fall. Here, we determined Kd for the adsorption of Zn (II) and Co (II) metal ions on GACA resin, which is the molar distribution coefficient. Co (II) ions exhibit maximum adsorption and Kd values on caproic acid (GACA) resin at pH 6, while Zn (II) ion does so at pH 5. Its mean that cobalt metal ion can be separated from others metal ions at pH 6 while zinc metal ion can be separated from others metal ion on pH 5.
This sequence demonstrates the rising order of Kd and adsorption of ionized metals on caproic acid (GACA) resin is Co(II)<Zn(II).Thus zinc metal ion show maximum 81.34% and cobalt ion is 73.35 on GACA resin. Ion exchange capacity of GACA resin found 5.75Meq/g.
Adsorption of metals from water is strongly correlated with pH. The competition between H+ ions and metal ions for adsorption sites increases at low pH. At a pH of 5 or 6, adsorption is at its peak and decreases with increasing pH. Absorption of free metal ions is pH-dependent. Metal ion accumulation on GACA resin increased when the pH range expanded from 2.0 to 8.0.
There are many factors which effect the results are as followings
Temperature One of the most important factors influencing metal ion adsorption on resin. As the temperature rises, less metal ions are able to bind to resin. 30°C to 80°C is the temperature range used for the GACA resin treatment process.
The agitation speed was increased from 0 to 150 rpm; more metal ions were retained on the produced samples modified GACA resin. This is due to the fact that increasing agitation speed promotes metal ion migration to the surface of the adsorbents
It was found that the optimum contact time for GACA resin was 220 minutes, with adsorption of metal ions increasing with contact time from 45 minutes to 220 minutes.
Finally, we can say that resins based on naturally modified polysaccharides are superior for separating and recovering metal ions from effluent water from industrial processes.
Ackowledgement
My gratitude go out to my research mentor Dr. Aresh Vikram Singh, Professor, Department of Chemistry, Jai Narain Vyas University, Jodhpur, for all of the insightful advice, enthusiastic support, and insightful criticism he has provided. His goodness and generosity have left me speechless.
Concflict of Interest
In this study the authors declare no conflict of interest.
References
- A.Kabata-Pendias, H. Pendias, Trace Elements in Soil and Plants. London: CRC Press, (1984).
- M.Salgarello, G.Visconti, L. Barone-Adesi, Aesthetic Plastic Surgery, 37(5),1061-1062, (2013).
CrossRef - Rokuroishida, Takaai-kunda, Talanta, Vol. 20, pp 553, (1972).
- Rokurokuroda, Tatsuya, Seki, Yasudmisu and Koichi, Talanta, Vol. 26, pp 211, (1978).
CrossRef - K.F. Paschall, U S Patent, Vol.2, pp 217, (1957).
- E.A.Peterson and H.A Sober, “The Plasma Proteins”, Academic Press, New York, Vol. 5, (1960).
- H.A.Veder, J. of Chromatography, Vol. 10, pp 507, (1963).
CrossRef - J.Porath, N.J. Fornstedt, Chromatogaphy, Vol. 51, pp 479, (1970).
CrossRef - H.A. Sober, E.A. Peterson, C.Calmon and T.R.E.Kressman, Interscience, New York, (1957).
- A.K. Sharm, S.P. Phadnia, B.S. Parikh and H.C. Srivastava, Proc. First Carbhohydrate Conference, Ahmedabad, (1984).
- Neha Parihar, and Vikal Gupta, RASAYAN j.Chem. Vol.14 (4) 2352-236, (2021).
CrossRef - Gambheer Geetu, POLIMETRY Vol.67 (5), (2022)
- Zhang Rui., J. of Ethnopharmology, Vol no. 305, 6april (2023).
- Sujata Mandal, Hwang Sangchul and Sheldon, Int. J. of boil macromol, 226, 7, dec (2022).
- Caldera, martin. A. Denis, J. of polymer research, 28, 10, Oct (2021).
- Sarika Nagar, Aresh Vikram Singh, and J.S Rathore, Bull. Of Env. phrm. and life sci, 9, 11, 77-88, (2020).
- H.Grasdalen and T.J. Painter, Carbohydr. Res., Vol 81, pp 59–66 (1980).
CrossRef - Gopal Arora, A.P. Gupta, the open access engineering journal, 17, (2023).
CrossRef - A.V. Singh, and Monika Rathore, Int. res. J. of pure and applied chemistry, 39, 1, (2023).

This work is licensed under a Creative Commons Attribution 4.0 International License.
About The Author
![]()
A New Edition of Web of Science
Journal Impact Factor
2022: 0.5
Five Year: 0.8
Journal is Indexed in

Cabells Whitelist
![]()


