Recent Monitoring of Ground Water Quality in and Around Industrial Area of Vellore City at Two Different Monsoon Periods, South India
M. Sangeetha Priya 1 , A. Thaminum Ansari2* and V. Kanchana3
1Research and Development Centre, Bharathiar University, Coimbatore, Tamil Nadu, India.
2Department of Chemistry, Government Thirumagal Mills College Gudiyattam Tamil Nadu, India.
3Department of Chemistry, Sree Sastha Institute of Engineering and Technology, Vellore Tamil Nadu, India.
Corresponding Author E-mail: thaminumansari14@gmail.com
DOI : http://dx.doi.org/10.13005/ojc/390510
Article Received on : 13 Sep 2023
Article Accepted on :
Article Published : 13 Oct 2023
Reviewed by: Dr. Neeta Thakur
Second Review by: Dr. Amit Yadav
Final Approval by: Dr. Luigi Campanella
The present study focuses on the assessment of seasonal variation in groundwater quality of in and around industrial area of Vellore City. The samples were collected seasonally and are categorized as premonsoon, monsoon and post-monsoon during April 2022 and March 2023. Eighteen physicochemical parameters were assessed for forty eight different samples collected along the region of in and around industrial area of Vellore City at two different Monsoon periods. The analysis of the water quality parameters, including pH, EC, TDS, Ca2+, Mg2+, Na+, K+, Cl-, HCO3-, CO32-, SO42-, and heavy metals, was done in accordance with BIS and WHO standards. The results of these surveys were used to pinpoint the geochemical processes taking place in this area. According to the analytical findings, there were significant variations in the water quality inclinations between samples and locations. Water management and treatment policy decisions can be made with the support of water quality analysis which can also help to identify potential health issues.
KEYWORDS:Groundwater quality; Industrial areas; premonsoon; post monsoon; Vellore city
Download this article as:| Copy the following to cite this article: Priya M. S, Ansari A. T, Kanchana V, Recent Monitoring of Ground Water Quality in and Around Industrial Area of Vellore City at Two Different Monsoon Periods, South India. Orient J Chem 2023;39(5). |
| Copy the following to cite this URL: Priya M. S, Ansari A. T, Kanchana V, Recent Monitoring of Ground Water Quality in and Around Industrial Area of Vellore City at Two Different Monsoon Periods, South India. Orient J Chem 2023;39(5). Available from: https://bit.ly/3M153hr |
Introduction
Different processes, including organic matter degradation, rock-water interactions, aerobic respiration, iron reduction, mineral dissolution, weathering, industrial discharge effluents, and mixing of fresh and salt water, have been connected to variations in groundwater quality indicators. In many places of the world, water shortage has resulted from rising water demand over time. India is currently on the verge of a groundwater disaster, primarily as a result of poor management of water resources and environmental damage. On the quality of the groundwater and water contamination in Tamil Nadu, there is scant study 1-3. The lakes provide the majority (80%) of Chennai’s drinking water. Pumping stations used to draw drinking water from wells near river basins supply around 25% of the world’s population. The purpose of the current study is to look into the hydro-chemical changes, repercussions, and appropriateness of groundwater from March 2022 to April 2023.
Materials and Methods
48 samples of groundwater (bore well) were taken over the course of a year close to an industrial sector. All reagents and solutions were made using AR grade chemicals and double distilled water. At the sampling site itself, measurements of temperature, pH, electrical conductivity, and TDS concentrations were made. The usual methods have been used to measure total hardness, chloride, calcium, magnesium, alkalinity, sulphate, and bicarbonate 4-6. Flame photometers have been used to measure sodium and potassium. WQI 7,8 and correlation analysis have also been used to assess the quality of groundwater for potable uses and the interplay of chemical trends. In order to comprehend the effects of hydro-geochemistry and human involvement on groundwater quality, graphical approaches including Piper-Trilinear, Durov, Principal Component Analysis, Factor analysis, Gibbs ratio, SAR, and Corrosive ratio have also been used.
Results and Discussion
Seasonal Variations
The results of the physico-chemical parameters of groundwater samples are presented in Tables 1 through 3. The pH values between 6.7 and 8.5 fell within those recommended for residential use, which were 6.5 to 9.0 (USEPA, 1975), 5.5 to 9.0 (ICMR, 1975), and 7.0 to 9.0 (ICMR). Seasonal oscillations show that the pH value is highest during the monsoon and lowest during the pre-monsoon. The groundwater samples seldom have an alkaline pH. It was discovered that the EC values ranged from 502 to 1217 mhos/cm. It indicates the presence of pollutants when the EC of water abruptly rises. Dug wells are normally between 28 and 38 metres deep, although tube wells can reach depths of over 50 metres. There aren’t many differences in the EC of samples from tube wells and dug wells. The salinity of Chennai’s groundwater rises as you move south. However, there is some salinity distribution variability seen. The EC noted changes in the research area’s groundwater quality, which according to field observations are caused by companies and dumping grounds. The rise in conductivity shows how many ions the salinity values can support [8 & 9].
Table 1: Physicochemical Parameters of Groundwater Samples of Vellore City (Pre Monsoon)
|
Sample Code |
pH |
TDS |
CO32- |
HCO32- |
EC |
Free CO2 |
Cl– |
Nit. |
SO42- |
TH |
Ca2+ |
Mg2+ |
Na+ |
K+ |
COD |
|
S1 |
6.96 |
986 |
166 |
46 |
774 |
26 |
152 |
16 |
108 |
234 |
68.4 |
28.8 |
385.0 |
10.9 |
98 |
|
S2 |
7.17 |
912 |
212 |
52 |
721 |
32 |
134 |
14 |
98 |
212 |
64.8 |
24.9 |
262.7 |
61.4 |
112 |
|
S3 |
6.92 |
1128 |
154 |
42 |
918 |
24 |
176 |
22 |
182 |
414 |
127.2 |
48.4 |
401.4 |
55.2 |
134 |
|
S4 |
7.74 |
986 |
250 |
112 |
774 |
38 |
164 |
16 |
112 |
232 |
76.8 |
24.9 |
84.2 |
55.4 |
98 |
|
S5 |
7.13 |
896 |
220 |
78 |
672 |
28 |
112 |
12 |
72 |
184 |
45.6 |
25.9 |
96 |
15.7 |
94 |
|
S6 |
7.18 |
1432 |
214 |
98 |
1118 |
30 |
194 |
28 |
218 |
580 |
142.8 |
82 |
186.5 |
82.9 |
128 |
|
S7 |
6.99 |
1521 |
234 |
62 |
1206 |
28 |
198 |
28 |
224 |
520 |
136.8 |
71.5 |
243.3 |
25.9 |
146 |
|
S8 |
7.86 |
987 |
282 |
132 |
896 |
46 |
167 |
24 |
112 |
284 |
85.2 |
34 |
108.5 |
1.9 |
188 |
|
S9 |
8.02 |
976 |
296 |
296 |
889 |
48 |
142 |
22 |
104 |
224 |
75.6 |
23.5 |
201.4 |
2.4 |
132 |
|
S10 |
7.98 |
898 |
292 |
292 |
684 |
46 |
124 |
18 |
78 |
192 |
52.8 |
24.9 |
186.5 |
45.4 |
116 |
|
S11 |
8.11 |
1413 |
254 |
368 |
1196 |
54 |
182 |
32 |
212 |
582 |
147.6 |
80.6 |
719.3 |
46.6 |
94 |
|
S12 |
7.76 |
1623 |
202 |
312 |
1217 |
44 |
214 |
34 |
238 |
640 |
163.2 |
88.3 |
734.9 |
10.9 |
192 |
|
S13 |
7.02 |
1112 |
212 |
102 |
918 |
28 |
170 |
26 |
114 |
408 |
117.6 |
50.8 |
543.0 |
61.4 |
154 |
|
S14 |
7.23 |
988 |
278 |
108 |
743 |
32 |
166 |
18 |
118 |
288 |
91.2 |
32.6 |
367.5 |
55.2 |
96 |
|
S15 |
8.02 |
994 |
292 |
296 |
774 |
52 |
172 |
20 |
128 |
310 |
117.6 |
27.3 |
677.7 |
55.4 |
142 |
|
S16 |
7.84 |
1256 |
264 |
268 |
923 |
42 |
198 |
24 |
152 |
432 |
130.8 |
51.3 |
581.3 |
15.7 |
188 |
|
C1 |
7.49 |
912 |
182 |
54 |
684 |
28 |
124 |
14 |
48 |
192 |
50.4 |
25.9 |
543.2 |
82.9 |
98 |
|
C2 |
7.98 |
983 |
281 |
102 |
714 |
36 |
142 |
16 |
72 |
234 |
58.8 |
32.6 |
308.5 |
25.9 |
134 |
|
C3 |
7.25 |
1112 |
176 |
48 |
897 |
22 |
178 |
22 |
114 |
342 |
86.4 |
47.5 |
802.4 |
43.7 |
146 |
|
C4 |
7.37 |
1167 |
204 |
44 |
916 |
32 |
182 |
24 |
124 |
356 |
91.2 |
48.9 |
686.4 |
25.1 |
228 |
|
C5 |
7.13 |
1217 |
146 |
40 |
987 |
18 |
188 |
32 |
148 |
412 |
100 |
58.5 |
719.3 |
91.1 |
98 |
|
C6 |
7.32 |
1002 |
222 |
76 |
814 |
28 |
164 |
28 |
98 |
296 |
64.8 |
45.1 |
512 |
79.0 |
112 |
|
C7 |
7.26 |
1008 |
218 |
74 |
817 |
26 |
166 |
28 |
98 |
312 |
74.4 |
45.1 |
496.2 |
2.9 |
142 |
|
C8 |
7.16 |
1078 |
222 |
64 |
854 |
24 |
170 |
30 |
114 |
372 |
82.8 |
56.1 |
412.2 |
4.2 |
198 |
|
C9 |
7.98 |
1438 |
282 |
186 |
1102 |
52 |
186 |
36 |
178 |
486 |
118.8 |
69.1 |
560.0 |
65.9 |
168 |
|
C10 |
8.14 |
1457 |
226 |
386 |
1023 |
58 |
190 |
34 |
182 |
512 |
128.4 |
71.5 |
420.3 |
72.5 |
232 |
|
C11 |
8.12 |
994 |
244 |
354 |
798 |
58 |
152 |
18 |
86 |
256 |
61.2 |
36.9 |
617.7 |
36.1 |
146 |
|
C12 |
7.89 |
1530 |
198 |
298 |
1147 |
44 |
198 |
38 |
198 |
532 |
140.4 |
71 |
886.1 |
16.1 |
218 |
|
C13 |
7.21 |
997 |
178 |
168 |
788 |
36 |
152 |
22 |
86 |
254 |
58.8 |
37.4 |
622.7 |
114.8 |
196 |
|
C14 |
7.45 |
1312 |
250 |
162 |
996 |
42 |
178 |
28 |
146 |
458 |
117.6 |
62.8 |
813.7 |
152.4 |
178 |
|
C15 |
7.54 |
1325 |
304 |
208 |
1104 |
54 |
182 |
32 |
152 |
456 |
110 |
65.2 |
887.9 |
102.9 |
98 |
|
C16 |
8.23 |
1289 |
270 |
368 |
998 |
62 |
178 |
28 |
138 |
424 |
100 |
61.4 |
730.7 |
32.8 |
112 |
|
W1 |
6.84 |
792 |
148 |
48 |
593 |
14 |
134 |
12 |
48 |
214 |
52.8 |
30.2 |
70.9 |
1.9 |
88 |
|
W2 |
6.79 |
798 |
150 |
48 |
598 |
18 |
146 |
14 |
52 |
214 |
52.8 |
30.2 |
84.3 |
8.0 |
96 |
|
W3 |
6.98 |
886 |
150 |
62 |
688 |
26 |
152 |
24 |
68 |
252 |
58.8 |
36.9 |
82.0 |
8.4 |
112 |
|
W4 |
6.77 |
912 |
154 |
38 |
723 |
14 |
168 |
28 |
74 |
312 |
67.2 |
48 |
196.8 |
10.9 |
98 |
|
W5 |
7.12 |
884 |
226 |
92 |
662 |
32 |
148 |
24 |
58 |
246 |
55.2 |
36.9 |
178.3 |
5.5 |
124 |
|
W6 |
6.78 |
787 |
154 |
44 |
590 |
18 |
114 |
14 |
46 |
212 |
51.6 |
30.2 |
99.3 |
7.9 |
86 |
|
W7 |
7.42 |
1212 |
280 |
104 |
964 |
38 |
162 |
36 |
112 |
424 |
79.2 |
70 |
591.4 |
10.3 |
142 |
|
W8 |
7.02 |
1108 |
216 |
96 |
886 |
32 |
154 |
28 |
98 |
388 |
74.4 |
63.3 |
527.4 |
67.9 |
186 |
|
W9 |
7.67 |
986 |
306 |
142 |
677 |
42 |
172 |
32 |
84 |
324 |
68.4 |
50.4 |
457.0 |
106.3 |
178 |
|
W10 |
7.13 |
987 |
260 |
64 |
672 |
28 |
172 |
28 |
88 |
328 |
68.4 |
51.3 |
83.2 |
0.9 |
98 |
|
W11 |
7.24 |
1321 |
266 |
68 |
1102 |
30 |
180 |
40 |
124 |
496 |
88.8 |
83.52 |
783.5 |
44.2 |
204 |
|
W12 |
6.82 |
1486 |
242 |
56 |
1114 |
28 |
187 |
42 |
147 |
546 |
92.4 |
94.4 |
834 |
74.8 |
214 |
|
W13 |
7.81 |
1234 |
319 |
193 |
977 |
44 |
158 |
32 |
114 |
432 |
79.2 |
72 |
645.6 |
54.7 |
202 |
|
W14 |
7.98 |
799 |
368 |
218 |
512 |
46 |
118 |
16 |
54 |
244 |
64.8 |
26 |
613.2 |
54.2 |
98 |
|
W15 |
6.96 |
1218 |
194 |
98 |
993 |
24 |
164 |
32 |
126 |
428 |
81.6 |
70 |
628.4 |
44.6 |
114 |
|
W16 |
7.14 |
896 |
300 |
82 |
617 |
28 |
148 |
26 |
62 |
298 |
70.8 |
43 |
512.2 |
10.2 |
156 |
Units: All the parameters are given in ppm, excluding EC-m.mhos/cm, pH
Table 2: Physicochemical Parameters of Groundwater Samples of Vellore City (Monsoon)
|
Sample Code |
pH |
TDS |
CO32- |
HCO32- |
EC |
Free CO2 |
Cl– |
Nit. |
SO42- |
TH |
Ca2+ |
Mg2+ |
Na+ |
K+ |
COD |
|
S1 |
7.05 |
946 |
154 |
44 |
724 |
32 |
126 |
8 |
92 |
228 |
67.2 |
27 |
392.0 |
8.8 |
86 |
|
S2 |
7.23 |
892 |
180 |
58 |
707 |
36 |
108 |
8 |
78 |
202 |
61.2 |
24 |
268.2 |
54.2 |
106 |
|
S3 |
6.98 |
1108 |
144 |
38 |
897 |
26 |
154 |
8 |
162 |
398 |
124 |
46 |
424.2 |
43.1 |
124 |
|
S4 |
7.88 |
963 |
224 |
112 |
747 |
44 |
144 |
10 |
96 |
218 |
74.8 |
22 |
88.2 |
51.1 |
92 |
|
S5 |
7.27 |
846 |
170 |
98 |
567 |
30 |
88 |
8 |
58 |
178 |
43 |
25 |
104.2 |
9.8 |
88 |
|
S6 |
7.28 |
1403 |
226 |
76 |
1108 |
34 |
166 |
12 |
188 |
564 |
140 |
79 |
196.2 |
81.2 |
116 |
|
S7 |
7.09 |
1497 |
205 |
67 |
1082 |
36 |
168 |
16 |
192 |
512 |
134 |
69 |
256.2 |
25.1 |
138 |
|
S8 |
7.94 |
962 |
272 |
126 |
798 |
48 |
148 |
12 |
84 |
272 |
81.2 |
33 |
112.4 |
1.2 |
178 |
|
S9 |
8.23 |
951 |
354 |
218 |
792 |
54 |
124 |
16 |
88 |
214 |
72.4 |
23 |
211.1 |
1.8 |
126 |
|
S10 |
8.03 |
857 |
360 |
208 |
518 |
54 |
102 |
12 |
52 |
184 |
50.2 |
24 |
198.2 |
35.4 |
108 |
|
S11 |
8.44 |
1392 |
316 |
292 |
1106 |
64 |
146 |
18 |
190 |
574 |
142 |
81 |
749.1 |
41.1 |
88 |
|
S12 |
7.98 |
1584 |
306 |
196 |
1118 |
62 |
164 |
22 |
192 |
590 |
158.4 |
78 |
814.2 |
10.2 |
184 |
|
S13 |
7.13 |
1089 |
220 |
86 |
884 |
42 |
152 |
14 |
102 |
394 |
115.4 |
48 |
543.3 |
58.4 |
144 |
|
S14 |
7.48 |
953 |
260 |
102 |
693 |
34 |
138 |
8 |
106 |
286 |
89 |
33 |
398.2 |
51.2 |
94 |
|
S15 |
8.22 |
964 |
362 |
212 |
713 |
58 |
154 |
10 |
108 |
302 |
117.2 |
25 |
712.9 |
54.4 |
140 |
|
S16 |
7.91 |
1227 |
330 |
184 |
887 |
48 |
164 |
10 |
138 |
416 |
124.6 |
50 |
598.4 |
1.6 |
176 |
|
C1 |
7.62 |
892 |
180 |
48 |
627 |
34 |
106 |
8 |
24 |
184 |
49.2 |
24.4 |
554.2 |
78.9 |
94 |
|
C2 |
8.12 |
967 |
249 |
123 |
677 |
38 |
108 |
8 |
52 |
228 |
54.6 |
33 |
318.2 |
22.9 |
126 |
|
C3 |
7.37 |
1096 |
170 |
38 |
846 |
28 |
146 |
8 |
98 |
336 |
84.2 |
47 |
832.3 |
42.7 |
132 |
|
C4 |
7.52 |
1136 |
180 |
52 |
884 |
44 |
164 |
12 |
102 |
334 |
89.6 |
44 |
706.2 |
21.1 |
212 |
|
C5 |
7.23 |
1198 |
134 |
36 |
936 |
20 |
154 |
20 |
118 |
402 |
96.2 |
58 |
749.7 |
90.1 |
86 |
|
C6 |
7.39 |
978 |
172 |
102 |
774 |
30 |
148 |
18 |
72 |
284 |
63.2 |
43 |
556 |
77.0 |
104 |
|
C7 |
7.42 |
984 |
188 |
96 |
784 |
28 |
148 |
16 |
68 |
298 |
71.2 |
43 |
532.1 |
2.1 |
136 |
|
C8 |
7.33 |
1062 |
210 |
62 |
802 |
32 |
154 |
16 |
96 |
384 |
80.2 |
60 |
442.4 |
3.8 |
196 |
|
C9 |
8.04 |
1412 |
308 |
138 |
1012 |
68 |
162 |
22 |
156 |
474 |
104 |
72 |
584.2 |
59.2 |
164 |
|
C10 |
8.31 |
1413 |
310 |
286 |
1013 |
72 |
174 |
26 |
168 |
498 |
124.2 |
70 |
418.2 |
61.2 |
216 |
|
C11 |
8.22 |
973 |
310 |
264 |
782 |
74 |
124 |
14 |
62 |
242 |
58.4 |
34.8 |
636.6 |
27.1 |
138 |
|
C12 |
7.99 |
1456 |
266 |
212 |
1019 |
48 |
172 |
18 |
172 |
498 |
132 |
66 |
916.2 |
9.1 |
218 |
|
C13 |
7.46 |
972 |
216 |
108 |
763 |
44 |
128 |
12 |
68 |
236 |
57.2 |
33 |
637.1 |
98.8 |
192 |
|
C14 |
7.61 |
1278 |
280 |
118 |
934 |
48 |
142 |
16 |
122 |
452 |
114.8 |
62 |
816.6 |
110.4 |
164 |
|
C15 |
7.68 |
1313 |
354 |
142 |
1084 |
68 |
164 |
18 |
138 |
446 |
107.2 |
64 |
888.8 |
89.9 |
96 |
|
C16 |
8.54 |
1278 |
332 |
282 |
984 |
84 |
162 |
18 |
116 |
420 |
97.4 |
62 |
732.3 |
23.4 |
108 |
|
W1 |
6.92 |
787 |
143 |
39 |
524 |
24 |
112 |
6 |
32 |
210 |
48.2 |
31 |
81.9 |
0.8 |
86 |
|
W2 |
6.83 |
774 |
147 |
39 |
536 |
24 |
118 |
8 |
34 |
212 |
47 |
32 |
86.4 |
6.4 |
88 |
|
W3 |
7.13 |
867 |
160 |
44 |
664 |
28 |
134 |
8 |
42 |
244 |
56 |
36 |
88.1 |
7.5 |
102 |
|
W4 |
6.82 |
897 |
142 |
36 |
685 |
26 |
126 |
12 |
58 |
308 |
65.4 |
48 |
206.1 |
6.8 |
92 |
|
W5 |
7.34 |
861 |
230 |
72 |
615 |
38 |
124 |
8 |
44 |
232 |
54.2 |
34 |
179.8 |
4.2 |
116 |
|
W6 |
6.93 |
737 |
149 |
43 |
515 |
20 |
94 |
10 |
28 |
208 |
47.3 |
31 |
102.3 |
6.8 |
82 |
|
W7 |
7.63 |
1197 |
266 |
108 |
914 |
40 |
138 |
18 |
94 |
412 |
72.4 |
70 |
598.6 |
7.8 |
138 |
|
W8 |
7.23 |
1087 |
232 |
66 |
835 |
38 |
124 |
20 |
72 |
356 |
76.8 |
59 |
536.4 |
61.2 |
178 |
|
W9 |
7.82 |
963 |
194 |
232 |
623 |
48 |
148 |
16 |
68 |
308 |
64.2 |
48 |
487.1 |
92.5 |
166 |
|
W10 |
7.18 |
974 |
206 |
102 |
617 |
34 |
134 |
20 |
78 |
312 |
64 |
49 |
85.1 |
0.5 |
86 |
|
W11 |
7.39 |
1302 |
196 |
118 |
965 |
32 |
152 |
26 |
112 |
474 |
82 |
81 |
788.6 |
32.8 |
196 |
|
W12 |
6.98 |
1412 |
208 |
64 |
988 |
34 |
158 |
30 |
128 |
512 |
88.6 |
88 |
892.1 |
67.4 |
202 |
|
W13 |
7.88 |
1202 |
254 |
244 |
925 |
52 |
122 |
22 |
102 |
408 |
74.6 |
68 |
652.1 |
49.2 |
194 |
|
W14 |
8.24 |
773 |
268 |
264 |
502 |
58 |
96 |
6 |
36 |
214 |
61.6 |
27 |
663 |
46.2 |
86 |
|
W15 |
7.14 |
1198 |
204 |
64 |
976 |
34 |
132 |
18 |
108 |
412 |
78.2 |
68 |
631.7 |
34.5 |
106 |
|
W16 |
7.19 |
877 |
266 |
98 |
584 |
36 |
118 |
12 |
48 |
292 |
67.4 |
43 |
518.1 |
7.9 |
148 |
Units: All the parameters are given in ppm, excluding EC-m.mhos/cm, pH
Table 3: Physicochemical Parameters of Groundwater Samples in Vellore City (Post- Monsoon)
|
Sample Code |
pH |
TDS |
CO32- |
HCO32- |
EC |
Free CO2 |
Cl– |
Nit. |
SO42- |
TH |
Ca2+ |
Mg2+ |
Na+ |
K+ |
COD |
|
S1 |
7.02 |
952 |
138 |
62 |
731 |
26 |
128 |
12 |
96 |
202 |
63 |
23 |
412.2 |
8.1 |
82 |
|
S2 |
7.19 |
898 |
172 |
72 |
709 |
32 |
114 |
12 |
82 |
185 |
58 |
21 |
269.4 |
53.1 |
102 |
|
S3 |
6.95 |
1112 |
144 |
42 |
902 |
24 |
162 |
18 |
166 |
366 |
112 |
43.2 |
448.3 |
43 |
118 |
|
S4 |
7.79 |
974 |
236 |
112 |
752 |
40 |
146 |
14 |
102 |
198 |
72 |
18.7 |
102.2 |
49.6 |
84 |
|
S5 |
7.21 |
861 |
192 |
84 |
581 |
28 |
96 |
10 |
66 |
154 |
38 |
21 |
121.1 |
9.2 |
76 |
|
S6 |
7.24 |
1413 |
210 |
94 |
1109 |
32 |
172 |
16 |
192 |
532 |
136 |
73 |
216.3 |
76.3 |
102 |
|
S7 |
7.07 |
1503 |
196 |
82 |
1114 |
28 |
172 |
20 |
202 |
493 |
126 |
67.9 |
259.4 |
19.2 |
124 |
|
S8 |
7.89 |
974 |
270 |
134 |
823 |
46 |
152 |
18 |
96 |
248 |
78 |
40.8 |
132.2 |
0.8 |
164 |
|
S9 |
8.14 |
959 |
344 |
238 |
836 |
50 |
128 |
18 |
92 |
388 |
68 |
65.7 |
242.1 |
0.8 |
114 |
|
S10 |
8.03 |
869 |
354 |
218 |
577 |
48 |
104 |
14 |
64 |
158 |
48 |
18.7 |
199.1 |
23.4 |
94 |
|
S11 |
8.18 |
1402 |
326 |
288 |
1147 |
62 |
152 |
20 |
198 |
556 |
136 |
79 |
782.8 |
38.2 |
82 |
|
S12 |
7.83 |
1598 |
314 |
192 |
1136 |
48 |
174 |
26 |
208 |
562 |
156 |
72 |
827.1 |
9.8 |
176 |
|
S13 |
7.04 |
1094 |
210 |
98 |
892 |
30 |
152 |
18 |
106 |
362 |
112 |
42 |
583.1 |
52.1 |
132 |
|
S14 |
7.35 |
967 |
248 |
126 |
705 |
32 |
144 |
14 |
108 |
262 |
87 |
28 |
401.4 |
49.8 |
84 |
|
S15 |
8.08 |
979 |
292 |
284 |
728 |
52 |
158 |
16 |
112 |
286 |
112 |
24 |
723.9 |
51.4 |
132 |
|
S16 |
7.85 |
1234 |
260 |
262 |
906 |
44 |
166 |
16 |
142 |
398 |
116 |
49 |
601.2 |
0.8 |
164 |
|
C1 |
7.54 |
896 |
140 |
88 |
639 |
28 |
106 |
12 |
32 |
152 |
48 |
17.2 |
565.2 |
75.2 |
88 |
|
C2 |
8.03 |
978 |
240 |
138 |
692 |
36 |
112 |
10 |
56 |
202 |
53.4 |
27 |
323.4 |
21.2 |
116 |
|
C3 |
7.32 |
1102 |
131 |
83 |
854 |
24 |
148 |
12 |
98 |
308 |
78 |
42.7 |
838.3 |
39.8 |
128 |
|
C4 |
7.49 |
1142 |
151 |
85 |
898 |
32 |
168 |
16 |
112 |
312 |
88 |
40 |
718.4 |
18.7 |
202 |
|
C5 |
7.19 |
1203 |
136 |
38 |
952 |
18 |
168 |
24 |
122 |
378 |
94 |
53 |
755.1 |
87.2 |
78 |
|
C6 |
7.38 |
989 |
180 |
102 |
789 |
28 |
152 |
20 |
74 |
268 |
61 |
40 |
578.5 |
75.2 |
94 |
|
C7 |
7.32 |
992 |
156 |
132 |
791 |
26 |
152 |
18 |
68 |
272 |
67.2 |
38.4 |
538.5 |
1.8 |
128 |
|
C8 |
7.27 |
1066 |
160 |
118 |
817 |
26 |
154 |
20 |
102 |
362 |
78.4 |
55.6 |
448.1 |
2.9 |
182 |
|
C9 |
8.03 |
1421 |
290 |
162 |
1057 |
54 |
164 |
28 |
163 |
448 |
92 |
70.8 |
532.3 |
57.1 |
144 |
|
C10 |
8.23 |
1429 |
304 |
298 |
1015 |
62 |
174 |
30 |
170 |
452 |
112 |
63.8 |
421.1 |
59.3 |
208 |
|
C11 |
8.17 |
979 |
354 |
228 |
789 |
62 |
128 |
16 |
62 |
228 |
52 |
34 |
648.1 |
26.2 |
132 |
|
C12 |
7.96 |
1478 |
376 |
108 |
1097 |
44 |
176 |
28 |
174 |
462 |
126 |
60 |
918.9 |
8.7 |
208 |
|
C13 |
7.32 |
983 |
202 |
124 |
779 |
36 |
132 |
18 |
72 |
212 |
54.6 |
29 |
754.1 |
98.2 |
182 |
|
C14 |
7.52 |
1287 |
270 |
132 |
952 |
42 |
156 |
20 |
126 |
434 |
112 |
59 |
878.8 |
110 |
158 |
|
C15 |
7.61 |
1314 |
356 |
148 |
1097 |
58 |
164 |
22 |
140 |
424 |
102.4 |
60 |
945.2 |
88 |
88 |
|
C16 |
8.44 |
1281 |
322 |
294 |
986 |
68 |
164 |
20 |
122 |
396 |
94.5 |
56.4 |
743.2 |
22.1 |
98 |
|
W1 |
6.88 |
790 |
142 |
46 |
554 |
22 |
116 |
10 |
36 |
206 |
47 |
30.4 |
91.1 |
0.7 |
82 |
|
W2 |
6.81 |
782 |
136 |
56 |
552 |
22 |
122 |
12 |
36 |
208 |
46 |
31.6 |
91.2 |
6.2 |
78 |
|
W3 |
7.04 |
874 |
148 |
58 |
678 |
24 |
138 |
16 |
46 |
232 |
52 |
34.8 |
89.3 |
7.1 |
98 |
|
W4 |
6.81 |
908 |
133 |
47 |
696 |
22 |
132 |
24 |
62 |
298 |
64.3 |
45.8 |
223.2 |
6.1 |
88 |
|
W5 |
7.29 |
869 |
204 |
102 |
634 |
32 |
128 |
12 |
44 |
218 |
51.2 |
31 |
184.2 |
3.8 |
102 |
|
W6 |
6.86 |
758 |
140 |
54 |
544 |
18 |
102 |
10 |
32 |
196 |
44.4 |
29.2 |
112.2 |
6.2 |
76 |
|
W7 |
7.54 |
1204 |
232 |
`146 |
932 |
38 |
142 |
20 |
98 |
398 |
66.2 |
69 |
606.2 |
7.1 |
124 |
|
W8 |
7.05 |
1094 |
198 |
104 |
848 |
36 |
126 |
22 |
82 |
324 |
62.4 |
53 |
537.1 |
58.2 |
162 |
|
W9 |
7.71 |
972 |
232 |
198 |
646 |
46 |
154 |
22 |
74 |
292 |
63.6 |
44 |
488.1 |
91.4 |
152 |
|
W10 |
7.15 |
981 |
200 |
112 |
637 |
30 |
142 |
22 |
80 |
294 |
62.8 |
45 |
86.3 |
0.4 |
84 |
|
W11 |
7.29 |
1308 |
193 |
123 |
988 |
30 |
156 |
30 |
114 |
446 |
78 |
75.8 |
796.2 |
32.1 |
184 |
|
W12 |
6.93 |
1432 |
182 |
98 |
992 |
30 |
164 |
36 |
132 |
492 |
86 |
83 |
894.2 |
66.8 |
188 |
|
W13 |
7.83 |
1218 |
266 |
232 |
944 |
46 |
132 |
24 |
104 |
384 |
72 |
63 |
658.1 |
49 |
187 |
|
W14 |
8.11 |
779 |
280 |
264 |
508 |
48 |
98 |
10 |
40 |
202 |
57 |
25.4 |
677.1 |
45.8 |
78 |
|
W15 |
7.04 |
1204 |
142 |
130 |
979 |
26 |
134 |
26 |
112 |
392 |
74 |
44 |
635.1 |
33 |
98 |
|
W16 |
7.15 |
886 |
225 |
143 |
591 |
30 |
126 |
20 |
52 |
278 |
63.2 |
41.5 |
542.1 |
7.7 |
132 |
Units: All the parameters are given in ppm, excluding EC-m.mhos/cm,pH
Correlation Analysis
By calculating the correlation coefficient, one may anticipate how an ion will explain the properties of other ions10. Between water quality metrics, the correlation coefficient (r) has been calculated 15 (Tables 1 to 3). It shows a strong association between the various metrics of water quality. Ions are strongly connected when the Correlation coefficient11 value is either +1 or -1. The ions are not correlated if the correlation coefficient is 0, and are said to be well correlated if the ratio is larger than 0.7 and moderately correlated if the ratio is 0.7 to 0.5. With the exception of bicarbonates and carbonate, total dissolved solids are shown to have good season-to-season correlation with cations and anions. Pre-monsoon has the highest pre-monsoon correlation coefficient for cationic concentration vs. total dissolved solids and the lowest monsoon correlation value. Total hardness was correlated with calcium, magnesium, chloride, Sulphates, carbonate, and bicarbonate, with correlation coefficients of 0.87, 0.95, 0.86, 0.88, 0.06, and 0.34, respectively, indicating that permanent hardness predominated in the study area throughout all seasons. Only nitrate and chloride have a moderate correlation with chemical oxygen demand (COD). Between overall hardness and electrical conductivity, a very strong positive association (0.95) was found. 10-12.
Piper and Durov analysis
It is commonly known that interpretive diagrams can be used to better understand the nature and origin of various water quality. In this instance, the relationship between various points in the systems and potential drivers can be expressed using the Durov12 and Piper diagram. The quality of the groundwater in the research area is depicted by the Durov diagram in Figure 1. The fact that the water in later boreholes has a higher Na-K-HCO3 character than calcium, magnesium, or Sulphates dominations could mean that sodium and chloride are neutralising the acidity in the subsurface throughout pre-, monsoon, and post-monsoon. By graphing the percentages of chemical elements in a Piper diagram, groundwater is further assessed to identify the facies 13-14. The seasonal plot shows a sporadic distribution with slight differences in their chemical properties (Fig.2). Although the number of samples varied, the groundwater was of the kinds Na-CO3, NaCl, Ca-MgCO3 and Ca-MgCl, as shown by the groundwater samples S4, C5 and W10. However, there were considerable differences in the percentage of samples that belonged to different types of water. There are only a few samples (S4, C5, and W10) that fall into both Ca-CO3 and Na-Cl sub-blocks in the figure. Plots provide evidence that the groundwater was mixed type and that several processes contributed to its evolution 15-18. Plots also showed that Na is the most abundant cation in groundwater, followed by Ca and Mg, and Cl is the most abundant anion. The main sources of ions are Na2CO3 and Na2SO4, which are extensively employed in the paper industry and in the production of small-scale dyes at various stages of the process. The study area’s groundwater types were identified and categorized according on where they fell on a Piper diagram. The Na-CO3 dominated facies was clearly visible in the majority of the sample.
Table 4: Correlation Coefficient matrix for ground waters of Vellore city, South India (Pre-monsoon).
|
Variables |
pH |
TDS |
CO32- |
HCO32- |
EC |
Free CO2 |
Cl– |
NO32 |
SO42- |
TH |
Ca2+ |
Mg2+ |
Na+ |
K+ |
COD |
|
pH |
1 |
|
|||||||||||||
|
TDS |
0.255 |
1 |
|||||||||||||
|
CO32- |
0.644 |
0.099 |
1 |
||||||||||||
|
HCO32- |
0.858 |
0.379 |
0.454 |
1 |
|||||||||||
|
EC |
0.227 |
0.959 |
0.062 |
0.341 |
1 |
||||||||||
|
Free CO2 |
0.906 |
0.372 |
0.668 |
0.895 |
0.348 |
1 |
|||||||||
|
Cl– |
0.147 |
0.841 |
0.004 |
0.252 |
0.812 |
0.226 |
1 |
||||||||
|
NO32- |
0.100 |
0.774 |
0.181 |
0.190 |
0.752 |
0.220 |
0.740 |
1 |
|
||||||
|
SO42- |
0.257 |
0.916 |
0.039 |
0.387 |
0.905 |
0.353 |
0.845 |
0.593 |
1 |
|
|||||
|
TH |
0.145 |
0.951 |
0.084 |
0.308 |
0.909 |
0.271 |
0.858 |
0.825 |
0.883 |
1 |
|
||||
|
Ca2+ |
0.289 |
0.853 |
0.080 |
0.436 |
0.825 |
0.370 |
0.846 |
0.550 |
0.945 |
0.871 |
1 |
||||
|
Mg2+ |
0.025 |
0.895 |
0.058 |
0.180 |
0.852 |
0.165 |
0.764 |
0.891 |
0.736 |
0.952 |
0.680 |
1 |
|||
|
Na+ |
0.302 |
0.589 |
0.220 |
0.367 |
0.571 |
0.375 |
0.482 |
0.578 |
0.424 |
0.580 |
0.464 |
0.565 |
1 |
||
|
K+ |
0.108 |
0.270 |
0.127 |
0.083 |
0.244 |
0.227 |
0.187 |
0.195 |
0.218 |
0.240 |
0.205 |
0.226 |
0.468 |
1 |
|
|
COD |
0.230 |
0.532 |
0.170 |
0.231 |
0.476 |
0.285 |
0.505 |
0.569 |
0.377 |
0.496 |
0.386 |
0.504 |
0.453 |
0.142 |
1 |
Table 5: Correlation Coefficient matrix for ground waters of Vellore city, (monsoon).
|
Variables |
pH |
TDS |
CO32- |
HCO32- |
EC |
Free CO2 |
Cl– |
NO32 |
SO42- |
TH |
Ca2+ |
Mg2+ |
Na+ |
K+ |
COD |
|
pH |
1 |
||||||||||||||
|
TDS |
0.246 |
1 |
|||||||||||||
|
CO32- |
0.635 |
0.079 |
1 |
||||||||||||
|
HCO32- |
0.852 |
0.367 |
0.456 |
1 |
|||||||||||
|
EC |
0.218 |
0.958 |
0.038 |
0.328 |
1 |
||||||||||
|
Free CO2 |
0.905 |
0.364 |
0.666 |
0.891 |
0.339 |
1 |
|||||||||
|
Cl– |
0.151 |
0.845 |
0.004 |
0.237 |
0.818 |
0.226 |
1 |
||||||||
|
NO32- |
0.085 |
0.771 |
0.157 |
0.184 |
0.747 |
0.210 |
0.744 |
1 |
|||||||
|
SO42- |
0.260 |
0.920 |
0.040 |
0.382 |
0.910 |
0.355 |
0.842 |
0.598 |
1 |
||||||
|
TH |
0.134 |
0.950 |
0.063 |
0.300 |
0.907 |
0.264 |
0.861 |
0.823 |
0.887 |
1 |
|||||
|
Ca2+ |
0.296 |
0.859 |
0.090 |
0.434 |
0.833 |
0.376 |
0.842 |
0.560 |
0.946 |
0.879 |
1 |
||||
|
Mg2+ |
0.003 |
0.895 |
0.020 |
0.170 |
0.851 |
0.151 |
0.776 |
0.889 |
0.747 |
0.953 |
0.696 |
1 |
|||
|
Na+ |
0.288 |
0.585 |
0.188 |
0.339 |
0.567 |
0.360 |
0.496 |
0.564 |
0.426 |
0.571 |
0.470 |
0.553 |
1 |
||
|
K+ |
0.104 |
0.264 |
0.124 |
0.089 |
0.237 |
0.225 |
0.179 |
0.192 |
0.216 |
0.236 |
0.205 |
0.221 |
0.451 |
1 |
|
|
COD |
0.233 |
0.518 |
0.256 |
0.244 |
0.453 |
0.281 |
0.512 |
0.532 |
0.379 |
0.470 |
0.375 |
0.466 |
0.459 |
0.088 |
1 |
Table 6: Correlation Coefficient matrix for ground waters of ground waters of Vellore city, (post- monsoon).
|
Variables |
pH |
TDS |
CO32- |
HCO32- |
EC |
Free CO2 |
Cl– |
NO32 |
SO42- |
TH |
Ca2+ |
Mg2+ |
Na+ |
K+ |
COD |
|
pH |
1 |
|
|||||||||||||
|
TDS |
0.261 |
1 |
|||||||||||||
|
CO32- |
0.859 |
0.340 |
1 |
||||||||||||
|
HCO32- |
0.822 |
0.219 |
0.757 |
1 |
|||||||||||
|
EC |
0.250 |
0.956 |
0.300 |
0.181 |
1 |
||||||||||
|
Free CO2 |
0.912 |
0.352 |
0.895 |
0.857 |
0.334 |
1 |
|||||||||
|
Cl– |
0.160 |
0.792 |
0.177 |
0.132 |
0.796 |
0.218 |
1 |
||||||||
|
NO32- |
0.077 |
0.718 |
0.208 |
0.158 |
0.663 |
0.219 |
0.630 |
1 |
|||||||
|
SO42- |
0.257 |
0.913 |
0.353 |
0.239 |
0.903 |
0.349 |
0.802 |
0.544 |
1 |
||||||
|
TH |
0.176 |
0.926 |
0.306 |
0.234 |
0.910 |
0.300 |
0.775 |
0.725 |
0.872 |
1 |
|||||
|
Ca2+ |
0.260 |
0.831 |
0.360 |
0.289 |
0.820 |
0.332 |
0.815 |
0.448 |
0.928 |
0.841 |
1 |
||||
|
Mg2+ |
0.135 |
0.838 |
0.264 |
0.167 |
0.822 |
0.269 |
0.661 |
0.769 |
0.711 |
0.938 |
0.630 |
1 |
|||
|
Na+ |
0.298 |
0.558 |
0.251 |
0.299 |
0.550 |
0.305 |
0.442 |
0.486 |
0.398 |
0.501 |
0.455 |
0.427 |
1 |
||
|
K+ |
0.064 |
0.220 |
0.002 |
0.080 |
0.214 |
0.111 |
0.192 |
0.218 |
0.178 |
0.144 |
0.179 |
0.087 |
0.415 |
1 |
|
|
COD |
0.231 |
0.520 |
0.234 |
0.230 |
0.462 |
0.255 |
0.507 |
0.577 |
0.381 |
0.442 |
0.364 |
0.464 |
0.467 |
0.097 |
1 |
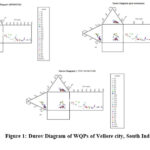 |
Figure 1: Durov Diagram of WQPs of Vellore city, South India. |
 |
Figure 2: Piper-Trilinear Diagram of WQPs of Vellore City, South India. |
Geochemical Process
It is crucial to recognize and comprehend the hydro-geochemical processes in order to assess the reasons for changes in groundwater quality and plan for groundwater protection. Gibbs plot14 (fig. 4.3) was used to pinpoint the mechanisms governing the chemistry of the groundwater. The majority of the data points, with the exception of a few in the evaporation zone, are plotted in the rock dominance zone, indicating that the interaction of aquifer material and water is the primary process regulating the chemistry of groundwater.
The Na/Cl ratio plot and the Na/Cl ratio against EC plot (fig. 4.4 a and b) demonstrate that evaporation is not a significant process. Assuming that no mineral species precipitate, concentration by evaporation would leave the ratio of Na/Cl constant. Another Na/Cl versus EC diagram would result in a horizontal line15. Groundwater has a wide range of Na/Cl ratios (fig. 4a). The connection between the Na/Cl ratio and EC (fig. 4b) is slightly sloped, which suggests that evaporation is not the major process. Na levels in groundwater are slightly higher, which suggests that silicate weathering is more likely to be the main cause than evaporation. 19-25.
Corrosive ratio and ion exchange reaction
The corrosive ratio of a groundwater sample is greater than 1, regardless of the season. If the CR is less than 1, the water is not corrosive; if the CR is greater than 1, the water is. This is brought on by the interaction of surface moieties and industrial wastewater. The significant geochemical processes that regulate the occurrence and distribution of ions in groundwater are known as cation exchange reactions. The rise in sodium in a gneissic environment is probably caused by ion exchange or industrial or agricultural contaminations 17. Cation exchange reactions are demonstrated by a high concentration of Na relative to Cl or a depletion of Na relative to Cl. [18]. Ca is kept in the aquifer material during a typical ion exchange event, while Na is discharged into the water. Cl does not counteract the excess Na produced by the ion exchange reaction; instead, alkalinity or SO4 do. Similar to this, in a reverse ion exchange, Ca is released to water while Na is kept by aquifer minerals. In this instance, Ca and Mg balance off the excess Cl over Na. In light of this, an excess of Na over Cl or Cl over Na is a reliable indicator of ion exchange processes. The depletion of Na values relative to Cl in this region (fig. 4a) is indicative of an ion exchange reaction. Every other sampling site groundwater sample uses the ion-exchange reaction with a slow rate of seasonal fluctuations, with the exception of this location (S4, S11, W2, W7, W8, W10, W11). (fig 4b).
Principal Component Analysis
Pre-monsoon season causes factor 1 to be very highly loaded with TDS, TH, and strongly loaded with EC, chloride, NO3, SO4, Ca, and Mg (Table 4.7 and fig. 4.9). The moderate loading of Cu, Zn, Pb, and COD accounts for 46.03% of the data set’s variability. Anthropogenic pollution and a decline in the groundwater table are the two processes that are suggested. Without recharge, the groundwater table lowers during the summer because significant concentrations of chloride and Sulphates were observed. Due to the presence of NO3 in this factor, anthropogenic pollution is proposed as the additional contributing process. Livestock waste and municipal landfills may be sources of nitrogen. Factor 2 accounts for 14.64% of variability and contains the variables PH, alkalinity, and free CO2. If PH and free CO2 have somewhat higher positive loadings than alkalinity, this indicates that groundwater in the research area is primarily contaminated by wastewater discharge on a regular basis. Because the pH rises as a result of the creation of acids caused by the decomposition of organic material, this component is known as the degradation factor. 25-29.
 |
Figure 3: Gibbs diagram for groundwater with respect to anion and cation. |
 |
Figure 4: (a). Relation between Na (meq/l) and Cl (meq/l). (b) Relation between Na/Cl versus EC (mho/cm). |
 |
Figure 5: % of Na in groundwater, Vellore city, South India |
 |
Figure 6: SAR in groundwater, Vellore city, South India. |
 |
Figure 7: Corrosive ratio of groundwater in Vellore city, South India Click here to View Figure |
 |
Figure 8: Chloro-Alkaline indices of groundwater in Vellore city, South India. |
Aluminium has a modest link with factor 3 and mercury and cadmium have a moderate correlation. Factor 3 contributes 11.6% of variability. These numbers suggest that the concentration of heavy metals decreases over the summer. Factor 4—organic matter degradation/iron reduction process—explains 6.34% of the variability and includes only a moderate association of ferrous. Iron reduction is connected to the microbial breakdown of organic substances in the aquifer. (1).
Table 7: PCA studies of Physic-chemical parameters (Pre-Monsoon).
|
Variable |
F1 |
F2 |
F3 |
F4 |
|
pH |
0.369 |
0.747 |
-0.474 |
0.032 |
|
TDS |
0.936 |
-0.230 |
-0.155 |
-0.006 |
|
TA |
0.477 |
0.749 |
-0.332 |
0.211 |
|
EC |
0.894 |
-0.273 |
-0.221 |
-0.004 |
|
Free CO2 |
0.502 |
0.727 |
-0.378 |
0.106 |
|
Chloride |
0.843 |
-0.312 |
-0.105 |
-0.050 |
|
Nit. |
0.841 |
-0.181 |
0.291 |
0.047 |
|
SO42- |
0.847 |
-0.273 |
-0.371 |
-0.040 |
|
TH |
0.925 |
-0.317 |
-0.071 |
0.056 |
|
Ca |
0.829 |
-0.216 |
-0.376 |
-0.021 |
|
Mg |
0.866 |
-0.351 |
0.129 |
0.091 |
|
Cu |
0.529 |
0.368 |
0.149 |
-0.308 |
|
Zn |
0.605 |
0.238 |
0.071 |
-0.376 |
|
Al |
0.278 |
0.426 |
0.488 |
-0.385 |
|
Fe |
0.359 |
0.183 |
0.159 |
0.610 |
|
Pb |
0.559 |
0.227 |
0.537 |
-0.080 |
|
Hg |
0.553 |
0.224 |
0.560 |
0.027 |
|
Cd |
0.394 |
0.106 |
0.565 |
0.561 |
|
COD |
0.635 |
0.111 |
0.225 |
-0.228 |
|
Eigen value |
8.747 |
2.782 |
2.209 |
1.205 |
|
Variability (%) |
46.037 |
14.640 |
11.628 |
6.341 |
|
Cumulative % |
46.037 |
60.676 |
72.304 |
78.645 |
 |
Figure 9: PCA distribution diagram of physicochemical parameter of groundwater in Vellore City (Pre-monsoon) South India. |
The factor 1 is extremely significantly connected with TDS during monsoon season (Table 8 and fig. 10), while EC and TH are strongly correlated with chloride, nitrate, Sulphates, calcium, and magnesium. Cu, Zn, and COD have a moderate association and account for 46.03% of the data set’s variability. Since chloride, nitrate, and Sulphates have lower positive correlations than the other two seasons and consequently have a negative effect on TDS, this may be owing to the recharge effect of rainwater. For this reason, this component is referred to as a solid factor. Factor 2 accounts for 14.72 percent of the data set’s variability and adds to the modest correlation of Al, Pb, and Hg. This element is thought to be a heavy metal dissolution element. The dissolving of metal during the aquifer’s recharge by rainfall may be the cause of the trace amounts of Al, Pb, and Hg that are released into groundwater. Factor 3 is responsible for 12.47 percent of the variability and includes strongly positive loadings of pH, alkalinity, and free CO2. The water’s pH may alter, most commonly as a result of continuous water inflow, and this variation may have an impact on the free CO2 level. When monsoon season arrives, the pH changes as a result of an abrupt influx of fresh rainwater in the research area. Alkalinity is directly impacted by pH variation. This element is known as the pH factor. Factor 4 explains 7.4% of the variability and has a moderately positive loading of Fe and Cd; this may be because ferrous metal dissolves during microbial degradation with the help of organic matter derived from waste water in the environment. The factor 1 is very significantly linked with TDS, EC, and TH in the post-monsoon (table 9 and fig. 11), as well as with strong positive loadings of chloride, nitrate, Sulphates, calcium, and magnesium. Strong association between Cu and Pb and moderately positive loading of Zn, Hg, and COD explain 44.18% of the data set’s variability.
Table 8: PCA studies of Physico-chemical parameters (Monsoon).
|
Variable |
F1 |
F2 |
F3 |
F4 |
|
pH |
0.408 |
0.366 |
0.775 |
-0.137 |
|
TDS |
0.926 |
-0.304 |
-0.023 |
0.008 |
|
All. |
0.505 |
0.391 |
0.723 |
0.080 |
|
EC |
0.890 |
-0.350 |
-0.006 |
-0.011 |
|
Free CO2 |
0.558 |
0.371 |
0.686 |
0.031 |
|
Chloride |
0.798 |
-0.301 |
-0.051 |
-0.138 |
|
Nit. |
0.798 |
0.210 |
-0.302 |
0.165 |
|
SO42- |
0.831 |
-0.487 |
0.122 |
-0.065 |
|
TH |
0.906 |
-0.339 |
0.119 |
0.075 |
|
Ca |
0.790 |
-0.492 |
0.198 |
-0.074 |
|
Mg |
0.851 |
-0.189 |
-0.307 |
0.168 |
|
Cu |
0.552 |
0.497 |
-0.187 |
-0.287 |
|
Zn |
0.640 |
0.125 |
0.082 |
-0.328 |
|
Al |
0.246 |
0.681 |
-0.296 |
-0.225 |
|
Fe |
0.336 |
0.176 |
0.192 |
0.690 |
|
Pb |
0.557 |
0.537 |
-0.346 |
0.001 |
|
Hg |
0.539 |
0.467 |
-0.404 |
-0.112 |
|
Cd |
0.335 |
0.307 |
-0.202 |
0.732 |
|
COD |
0.636 |
0.219 |
-0.170 |
-0.177 |
|
Eigen value |
8.521 |
2.811 |
2.369 |
1.414 |
|
Variability (%) |
44.845 |
14.793 |
12.470 |
7.440 |
|
Cumulative % |
44.845 |
59.638 |
72.108 |
79.547 |
 |
Figure 10: PCA distribution diagram of physicochemical parameter of groundwater in Vellore City (Monsoon), South India. |
Since the content of chloride and Sulphates is decreased, this process is responsible for the dilution of groundwater. The substantial positive loading of nitrate, which is very low compared to other seasons, may be due to the monsoon’s end’s recharge effect on rainwater. The weathering or evaporation of groundwater reduces the calcium concentration, and the change in overall hardness affects the calcium level. Alkalinity, pH, and free CO2 have a moderately favorable association and account for 14.09% of the variability. The post-monsoon season is when free CO2 levels are at their highest. The presence of free CO2, which changes pH, has an impact on the level of alkalinity. One parameter, the moderately correlated Cd, was produced by factor 3 and accounts for 12.7% of the variability. This is the process that causes heavy metal to dissolve. Factor 4 contributes 7.4% of the variability, resulting in a moderately positive ferrous loading; the process attributed may be the process of iron reduction or the decomposition of organic matter.
Factor Analysis
The assessment criterion for groundwater environmental quality is applied, and the standard evaluation indexes are produced using PCA as well (19–25). The total score for each standard level is displayed in (Table 10 and fig. 12). The quality of the groundwater in samples W1, W3, W4, W7, W11, W13, S1, S5, S8, S9, S10, S11, S13, S14, S15, and S16 is good, and W2, W5, W16, S2 and S4 are better; the groundwater there satisfies the requirements of the II and III water function zones W6, W8, W9, W14, W15, and S3.
Table 9: PCA studies of Physico-Chemical parameters (Post-Monsoon)
|
Variable |
F1 |
F2 |
F3 |
F4 |
|
pH |
0.413 |
0.601 |
-0.616 |
0.025 |
|
TDS |
0.927 |
-0.261 |
-0.030 |
0.012 |
|
TA |
0.515 |
0.621 |
-0.506 |
0.179 |
|
EC |
0.904 |
-0.297 |
-0.088 |
-0.009 |
|
Free CO2 |
0.549 |
0.603 |
-0.494 |
0.175 |
|
Chloride |
0.816 |
-0.332 |
-0.012 |
-0.121 |
|
Nit. |
0.781 |
0.003 |
0.458 |
0.084 |
|
SO42- |
0.849 |
-0.390 |
-0.251 |
-0.025 |
|
TH |
0.911 |
-0.309 |
0.033 |
0.159 |
|
Ca |
0.808 |
-0.378 |
-0.308 |
-0.075 |
|
Mg |
0.850 |
-0.213 |
0.204 |
0.259 |
|
Cu |
0.495 |
0.423 |
0.055 |
-0.433 |
|
Zn |
0.623 |
0.173 |
-0.084 |
-0.381 |
|
Al |
0.060 |
0.474 |
0.380 |
-0.287 |
|
Fe |
0.395 |
0.238 |
-0.001 |
0.606 |
|
Pb |
0.486 |
0.366 |
0.482 |
-0.109 |
|
Hg |
0.572 |
0.345 |
0.530 |
-0.103 |
|
Cd |
0.189 |
0.304 |
0.634 |
0.562 |
|
COD |
0.623 |
0.173 |
0.238 |
-0.347 |
|
Eigen value |
8.395 |
2.677 |
2.425 |
1.425 |
|
Variability (%) |
44.184 |
14.091 |
12.763 |
7.498 |
|
Cumulative % |
44.184 |
58.275 |
71.039 |
78.536 |
Table 10: Factor analysis of groundwater in Vellore city.
|
Sample code |
F1 |
F2 |
Factor |
Rank |
Grade |
|
S1 |
-1.692 |
0.736 |
-0.956 |
1 |
II |
|
S2 |
-1.543 |
0.529 |
-1.014 |
2 |
III |
|
S3 |
-1.17 |
0.545 |
-0.625 |
1 |
II |
|
S4 |
-0.818 |
1.087 |
0.269 |
1 |
II |
|
S5 |
-1.116 |
-0.182 |
-1.298 |
2 |
III |
|
S6 |
-2.182 |
0.244 |
-1.938 |
3 |
III |
|
S7 |
0.238 |
-0.021 |
0.217 |
1 |
II |
|
S8 |
0.155 |
0.651 |
0.806 |
3 |
IV |
|
S9 |
-0.526 |
-1.186 |
-1.712 |
3 |
III |
|
S10 |
-0.485 |
-0.083 |
-0.568 |
1 |
II |
|
S11 |
1.026 |
1.043 |
2.069 |
4 |
IV |
|
S12 |
1.756 |
1.421 |
3.177 |
4 |
V |
|
S13 |
0.496 |
-0.82 |
-0.324 |
1 |
II |
|
S14 |
0.864 |
-0.009 |
0.855 |
3 |
IV |
|
S15 |
0.518 |
1.441 |
1.959 |
3 |
IV |
|
S16 |
-0.569 |
-0.647 |
-1.216 |
2 |
III |
|
C1 |
-0.674 |
0.927 |
0.253 |
1 |
II |
|
C2 |
-0.937 |
-0.059 |
-0.996 |
2 |
III |
|
C3 |
-0.037 |
1.976 |
1.939 |
3 |
IV |
|
C4 |
-0.581 |
-0.396 |
-0.977 |
2 |
III |
|
C5 |
-1.785 |
-0.242 |
-2.027 |
1 |
I |
|
C6 |
0.915 |
1.822 |
2.737 |
4 |
V |
|
C7 |
0.85 |
1.43 |
2.28 |
4 |
V |
|
C8 |
-0.154 |
-0.464 |
-0.618 |
1 |
II |
|
C9 |
-0.303 |
-1.767 |
-2.07 |
1 |
I |
|
C10 |
-1.313 |
-2.441 |
-3.754 |
1 |
I |
|
C11 |
1.192 |
-0.771 |
0.421 |
1 |
II |
|
C12 |
2.324 |
0.473 |
2.797 |
4 |
V |
|
C13 |
-0.068 |
0.365 |
0.297 |
1 |
II |
|
C14 |
-0.51 |
-0.209 |
-0.719 |
1 |
II |
|
C15 |
-0.543 |
-1.977 |
-2.52 |
1 |
I |
|
C16 |
0.473 |
-0.68 |
-0.207 |
1 |
II |
|
W1 |
-1.758 |
-0.09 |
-1.848 |
3 |
III |
|
W2 |
-1.251 |
-1.02 |
-2.271 |
1 |
I |
|
W3 |
-0.063 |
1.251 |
1.188 |
3 |
IV |
|
W4 |
0.267 |
0.936 |
1.203 |
3 |
IV |
|
W5 |
0.597 |
1.974 |
2.571 |
4 |
V |
|
W6 |
-0.258 |
0.543 |
0.285 |
1 |
II |
|
W7 |
0.059 |
-0.005 |
0.054 |
1 |
II |
|
W8 |
0.117 |
0.343 |
0.46 |
1 |
II |
|
W9 |
1.154 |
-0.301 |
0.853 |
3 |
IV |
|
W10 |
1.748 |
-1.643 |
0.105 |
1 |
II |
|
W11 |
-0.109 |
-1.868 |
-1.977 |
1 |
I |
|
W12 |
2.108 |
0.008 |
2.116 |
3 |
IV |
|
W13 |
0.096 |
-0.725 |
-0.629 |
1 |
I |
|
W14 |
1.065 |
-0.126 |
0.939 |
3 |
IV |
|
W15 |
1.485 |
-0.443 |
1.042 |
3 |
IV |
|
W16 |
0.945 |
-1.571 |
-0.626 |
1 |
I |
 |
Figure 11: PCA distribution diagram of physicochemical parameter of groundwater in Vellore City (Post-monsoon), South India. Click here to View Figure |
 |
Figure 12: Factor analysis of physicochemical parameter of groundwater in Vellore City (Post-monsoon), South India. |
Conclusion
Studies on the trends in groundwater quality are being conducted in the Vellore area close to industrial areas. Na, Ca, Mg, and K were the four cations that predominated in the research region, whereas CO3, Cl–, HCO32-, and SO42- were the four anions. The cation exchange process regulates the chemistry of groundwater. The correlation between the different water quality parameters (TDS, TH, Ca2+, Mg2+, and Cl–, SO42-, etc.) was good. Ion exchange reactions along the groundwater flow direction result in the release of Ca2+ and the adsorption of Mg and Na, according to hydro chemical modeling. Based on the primary ion chemistry of groundwater, four hydro chemical facies have been discovered, with Na-K-HCO3 and Na-CO3 being the two major facies. A small number of groundwater samples from coastal areas in the pre-monsoon season (April 2023) exhibit the Na-Cl facies. However, during the monsoon, these samples eventually become diluted to Ca-Mg-HCO3 or Na-K-HCO3 facies. The study locations’ potential for agricultural activities is constrained by high SAR and Na%. The pollutant load was definitely higher during the summer and lower during the monsoon, according to the PCA study. According to factor analysis, the water function zones for the groundwater quality in 29 places are II and III, while the other 19 locations are IV and V.
Acknowledgment
The author thanks Bharathiar University, Coimbatore for providing opportunity to completing this research works. The author also thanks to the Editors of this journal for considering my research manuscript.
Conflict of Interest
The authors declare no conflict of interest.
References
- Krishnamoorthy, N.; R. Thirumalai,; M. Lenin Sundar,; M. Anusuya ; P. Manoj Kumar, E. Hemalatha; M. Mohan Prasad, and Neha Munjal; Urban Climate., (2023), 49, 101436.
- Kistan, A. ; Kanchana V.,; Indian J. of Environmental Protection., 2020, 40, 5, 527
– 532. - Senthilkumar, Mohanavelu, and Devadasan Gnanasundar.; Environmental Earth Sci., 2022, 81, no. 6 (2022): 187
- Reddy, D. V., Devender Kumar, and Kiran Kumar Bhukya.; Environmental Earth Sci.,2023, 82, no. 13 (2023): 335.
- Anjum, Rukhsar, Sk Ajim Ali, Mansoor Alam Siddiqui, Farhana Parvin, Zainab Khan, Nishat Khan, Zeba Khanam, and Mohammad Nafees. Chemical Engineering Journal Advances.; 2023, 16, 100547.
- Srihari, S., T. Subramani, V. N. Prapanchan, and Peiyue Li. Hum. Ecol. Risk Assess., 2022, 29, 1-12.
- Gogoi, Ashini, Shaik Mahamad, Dipjyoti Gogoi, and G. Bhaskaran. Arabian Journal for Science and Engineering., 2023, 48(6), 7985-8000.
- Sangaré, Lamine Ousmane, Sidy Ba, Oumou Diallo, Diakalia Sanogo, and Tong Zheng. Environmental Monitoring and Assessment. 2023, 195(6), 1-19.
- Libina, R. S., K. Prakash, R. Jegankumar, S. P. Dhanabalan, and M. A. Arya. In Adv., in Water Resource Planning and Sustainability, Singapore: Springer Nature Singapore, 2023, pp. 203-221.
- Rajendiran, Anbuchezhian.; Envi., Monitoring and Assessment., 2023, 195(7), 883.
- Subramanian, Keerthivarman G., Manikandavelu Dhanushkodi, Aruna Satyapriyan, Muralidharan Nagarajan, and Govarthanan Muthusamy. Molecular Biotechnology,. 2023, 1-12.
- Manju, A., K. Kalaiselvi, V. Dhananjayan, M. Palanivel, G. S. Banupriya, M. H. Vidhya, K. Panjakumar, and B. Ravichandran; Air Quality, Atmosphere & Health 11., 2018, 1179-1189.
- Kistan, A., V. Kanchana, L. Sakayasheela, J. Sumathi, A. Premkumar, and A. Selvam.;
Oriental J., of Chem., 2018, 34(2), 1000-1010,. http://dx.doi.org/10.13005/ojc/340250 - Senthilkumar, S., K. Vinodh, G. Johnson Babu, B. Gowtham, and V. Arulprakasam.; Applied Water Science. 2019, 9, 1-20.
- Dhamodharan, A., S. Shanthakumar, and G. P. Ganapathy.; Global NEST Journal., 2016, 18, 3 , 527-545.
- Chaurasia, Abhishek Kumar, H. K. Pandey, S. K. Tiwari, Ram Prakash, Prashant Pandey, and Arjun Ram. J. of the Geological Soci of India, 2018, 92, 76-82.
- Mohanakavitha, T., K. Shankar, R. Divahar, T. Meenambal, and R. Saravanan. Archives of Agriculture and Environmental Science., 2019, 4(4), 379-387.
- Madhavan, Shanmugam, Srinivasa Raju Kolanuvada, Vinothkumar Sampath, Priyadarsi Debajyoti Roy, Prabhakaran Moorthy, Logesh Natarajan, and Lakshumanan Chokkalingam.; Environmental Monitoring and Assessment.,2023, 195(2), 272.
- Packialakshmi, S., and N. K. Ambujam. “The peri-urban to urban groundwater transfer and its societal implications in Chennai, south India-A case study.” Indian Journal of Agricultural Research., 2017, 51(2), 135-141.
- A Kistan, Andiyappan, V. Kanchana, , Asian J. Chem., 2023, 35(8), 1899-1906., https://doi.org/10.14233/ajchem.2023.27792
- Sathish, S., and L. Elango.; Arabian J., of Geosciences., 2016, 9, 1-17.
- Debsarma, Chitrangada, Paulami Sahu, and M. H. Kalubarme.; Envir., Monitoring and Assessment;,2023, 195(9),1-24.
- Ramachandran, A., R. R. Krishnamurthy, M. Jayaprakash, and A. Shanmugasundharam.; Acta Ecologica Sinica.,2019, 39(2), 125-132.
- A Kistan, A., A. Premkumar & V. Kanchana, ; Asian J. Chem.; 2022, 34(7), 1698-
1702 https://doi.org/10.14233/ajchem.2022.23699. - Gnanachandrasamy, G., T. Ramkumar, S. Venkatramanan, S. Vasudevan, S. Y. Chung, and M. Bagyaraj.; Applied water sci.,2015, 5, 39-55.
- Natarajan, Surendar; Nature Environment & Pollution Technology 22, no. 3 (2023).
- Alagarsamy, Vijaya Anandan Veerasamy, Kistan Andiyappan, Saral Abdul Kadar Avuliya,
and Thaminum Ansari Abubacker; Oriental Journal of Chemistry., 2018, 34(1), 381.
http://dx.doi.org/10.13005/ojc/340141 - Senthilkumar, M., D. Gnanasundar, and E. Sampath Kumar. Clean and Sustainable Groundwater in India., (2018), 25-38.
- Guruge, Keerthi S., P. Goswami, I. Watanabe, S. Abeykoon, V. P. Prabhasankar, K. R. Binu, D. I. Joshua, K. Balakrishna, Masato Akiba, and N. Munuswamy.; Int., J., of Environmental Sci and Tech., 2017, 14, 1-18.

This work is licensed under a Creative Commons Attribution 4.0 International License.
About The Author
![]()
A New Edition of Web of Science
Journal Impact Factor
2022: 0.5
Five Year: 0.8
Journal is Indexed in

Cabells Whitelist
![]()


