Investigation of Linagliptin – Human Serum Albumin Complex formation using Spectroscopic Analysis and Molecular Docking
D. Usha Rani1* , Shaheen Begum1, S. Nithya1 and Mohamed El Fadili2
1Institute of Pharmaceutical Technology, Sri Padmavati Mahila Visvavidyalayam, Tirupati, Andhra Pradesh, India 517502.
2LIMAS laboratory, Faculty of Sciences, sidi Mohamed ben Abdellah University, Morocco.
Corresponding Author E-mail: shaheen.pharmchem@gmail.com
DOI : http://dx.doi.org/10.13005/ojc/390524
Article Received on : 04 Aug 2023
Article Accepted on : 22 Sep 2023
Article Published : 11 Oct 2023
Reviewed by: Dr. Amit Namdev
Second Review by: Dr. Dinesh Prajapati
Final Approval by: Dr. Amrit Puzari
When human serum albumin binds firmly with a drug molecule, the impact will be greater on its half-life and other important pharmacokinetic properties. Linagliptin is an antidiabetic drug candidate with a good safety profile. The interaction mechanism of linagliptin with HSA is not reported so far. In the present study, various spectroscopic investigations (UV, fluorescence, FTIR and CD) and molecular docking were performed to determine the binding constant and the other binding characteristics of the interaction between HSA and drug molecule. The binding constant obtained from the UV-spectroscopic results (0.98 x 10³ M-1), revealed weak binding between the protein and linagliptin structure. Fluorescence spectroscopy results showed quenching of intrinsic fluorescence of HSA through static quenching. The binding constant value was Ksv = 1.26×10⁻⁴ M-1. In the FTIR and circular dichroism spectra minor changes were observed in peak positions and peak intensities. Molecular docking revealed that linagliptin was stabilized at site-I primarily with Pi-Pi stacking and the binding mode was similar that of R- warfarin.
KEYWORDS:Human Serum Albumin; Linagliptin; Molecular Docking; Spectroscopy
Download this article as:| Copy the following to cite this article: Rani D. U, Begum S, Nithya S, Fadili M. E. Investigation of Linagliptin – Human Serum Albumin Complex formation using Spectroscopic Analysis and Molecular Docking. Orient J Chem 2023;39(5). |
| Copy the following to cite this URL: Rani D. U, Begum S, Nithya S, Fadili M. E. Investigation of Linagliptin – Human Serum Albumin Complex formation using Spectroscopic Analysis and Molecular Docking. Orient J Chem 2023;39(5). Available from: https://bit.ly/3S18DvI |
Introduction
Plasma protein binding (PPB) is a crucial factor that significantly affects the pharmacokinetics of a chemical substance 1. PPB also affects medication stability, toxicity, and pharmacological effects 2. Early in the drug development process, PPB is crucial for predicting drug-drug interactions. Serum albumin is the most important plasma proteins which binds with a large array of chemical compounds. Fatty acids (palmitic acid, myristic acid), hormones (insulin, cortisol), steroids (glucocorticoid, progesterone), metal ions (Cu2+, Zn2+), and a variety of drug molecules bind with albumin protein 3. In recent years, researchers have extensively studied the mechanism of interactions between drugs, natural agents with bovine serum albumin (BSA), HSA and glycated HSA (derived by Schiff base formation between amine group of HSA and reducing sugars) 4-10. A range of spectroscopic techniques (UV, FTIR, fluorescence, NMR, multidimensional mass spectroscopy), capillary isoelectric focusing (CIEF), High performance affinity chromatography (HPAC) can provide detailed information of protein-drug binding characteristics 11.
HSA is composed of 585 amino acids residues and possess seventeen disulphide bridges (rich in cysteine content). BSA has 76% sequence identity with HSA, differ in molecular weight (BSA =66267 g mol−1 & HSA= 66439 g mol−1) and also in amino acid content. When any drug molecule binds with HSA or BSA the secondary structure of protein will get altered, due to that confirmational changes take place in protein molecule. HSA has three binding domains, I (1–195), II (196-383), and III (384-585) and each domain contains two subdomains, A and B. Site -I is renowned for its binding with NSAIDS and Site -II is known for its binding with drugs like warfarin, propylthiouracil, and cromoglycate 12. In a recent study by Maier et.al., it was observed that HSA contains higher surface hydrophobicity compared to BSA. This might be responsible for significant changes in the phase behavior of protein, which may play a significant role in drug binding characteristics 13.
Among the various chemical classes of antidiabetics (Fig:1) metformin(biguanide), pioglitazone (thiazolidinedione), exenatide (synthetic peptide) bind well with HSA under physiological conditions 14-16. Sulfonylurea based antidiabetics such as glipizide and glimepiride also bind with HSA. Glipizide has a higher affinity for HSA than glimepiride. These sulfonylureas bind to site I and site II involving a dynamic quenching mechanism 17. Linagliptin is a dipeptidyl peptidase (DDP-4) inhibitor used to treat type 2 diabetes. It is a xanthine-based drug and has a distinct pharmacokinetic/pharmacodynamic profile characterized by concentration-dependent protein binding and target-mediated non-linear pharmacokinetics 18. Recently Hossain and his group reported that the linagliptin was able to quench the fluorescence of BSA involving static and exothermic process 19. In the present work, we explored the binding mechanism of linagliptin with HSA using spectroscopic techniques and molecular docking.
 |
Figure 1: Structures of antidiabetic drugs |
Materials and Methods
Lyophilized human serum albumin (HSA 99% purity) was purchased from Sigma Aldrich and Shree Icon Laboratories provided linagliptin (LG; 98% purity) as a gift sample. We bought distilled water, sodium hydroxide, and potassium hydrogen orthophosphate from SRL Chemicals. On a double-beam UV-Visible spectrophotometer (Shimadzu, UV-1800), UV-Visible spectroscopic analysis was carried out. For FT-IR spectroscopic analysis, an FT-IR spectrophotometer (Brucker ATR type) was employed.
Preparation of buffer, protein, and drug stock solutions:
0.2 M Potassium hydrogen phosphate was prepared using distilled water, maintaining the pH of the final solution at 7.4 using 0.2 M NaOH. The HSA stock solution was prepared by dissolving 16.5mg of lyophilized HSA powder in a buffer solution. A stock solution of linagliptin was prepared by dissolving an accurately weighed 23.62 mg drug powder, solubilizing it in 2 ml of DMSO, and making up to 100 mL with freshly prepared phosphate buffer.
UV-Vis spectroscopic analysis
Appropriate amounts of HSA and linagliptin were dissolved separately in phosphate buffer. LG concentrations of 0, 4, 8, 12, 16, 20, 24, 28, and 32 μM were prepared, keeping the concentration of HSA constant in all solutions. Following a gentle Vortexing of all the solutions, they were incubated for two hours at lab temperature with intermittent shaking. Over the range of 200-400 nm, the absorption spectra of HSA alone and HSA-LG complex were measured.
Fluorescence
Fluorescence measurements were performed by spectrofluorophotometry Shimadzu RF-5301PC at room temperature equipped with a xenon lamp (150W). Fluorescence emission spectra was recorded at the wavelength range 250 -900 nm. Emission and excitation monochromator are blazed holographic concave diffraction grating. The widths of excitation slits and emission slits were both set to 5.0 nm. The excitation wavelength was set to 295 nm. The concentration of HSA was kept constant at 20 µM in every sample and linagliptin was added in increasing concentration from 4 to 32 µM.
Fourier transform infrared (FT-IR) spectroscopy and Circular Dichroism
The FT-IR spectra were obtained on a Bruker spectrometer via the ATR (Attenuated Total Refraction) method. CD spectroscopy tests were carried out to observe the Linagliptin-influenced protein structure alterations in HSA. At room temperature, the CD was recorded using a JASCO – 715 spectrophotometer. The quartz cell used for the CD scan had a 1 mm path length and operated between 190 and 260 nm. For this study, the concentration of HSA used was 20 μM and the HSA to ligand molar ratio was 1:0 & 1:3.
Molecular Docking
Molecular docking is largely applied to explore the binding interactions between the ligand and the targeted protein 20. For this reason, linagliptin was chosen for the molecular docking technique toward the targeted protein encoded as 1H9Z.pdb. The 3D crystal structure of HSA in complex with the myristic acid and the R-(+) enantiomer of warfarin was extracted from protein data bank (PDB) basis.(https://www.rcsb.org/structure/1H9Z) 21.
The targeted protein was prepared using discovery studio 2021, where the Gasteiger charges were added, all co-crystallized ligands bound to the protein were removed, and the water molecules (H2O) were equally removed. With the use of Auto Dock 4.2 software22, the candidate ligand was docked to the prepared protein. The 3-dimensional structure of the Grid box was centralized in the maximal sizes 100, 100, and 100 with a spacing of 0.375 Å. Finally, the strongest complex with the lowest binding energy was visualized using discovery studio 2021 23.
Results and Discussion
UV- Visible Spectroscopy
UV-Vis spectroscopy has been used to investigate how proteins and ligand molecules, such as medicines, combine to form complexes. The resulting absorption spectrum is used to discover how protein structure changes in response to interaction. As a result, the current work examines the solutions of HSA, LG, and HSA-LG complexes. The related complexes’ absorbances were constantly increasing as linagliptin was incrementally increased. It was explained by the modification of the helix and the microenvironment surrounding the tryptophan-214 and tyrosine residues at the binding site. When the drug concentration was increased, a particular pattern of the UV spectra of the HSA-LG complex was seen, with the absorption peak occurring at 235 nm (Fig:2). It is obvious from this evidence that the HSA and LG interact. The hydrophobic pockets found in the IIA subdomain are most likely responsible for the significant interaction between LG and HSA. A double-reciprocal plot of 1/(A0-A) vs 1/CLG was made to establish the binding constant between LG and HSA, and the result was a straight line, showing a linear connection with R2 = 0.947. The HSA solution’s absorbance in the absence of LG is represented by the A0. ‘A’ stands for the absorbance of HSA-LG complexes at various drug concentrations, where ‘A’ represents the LG concentration in the protein-drug complex. By dividing the intercept by the slope of the reciprocal plot value, the binding constant (k) for the linagliptin drug-protein interaction was found to be 0.98 X 10³ M-1(Fig:3). This value is indicative of weak interaction between HSA and linagliptin. This interaction between HSA and linagliptin may be due to the formation of hydrogen bonds 24.
 |
Figure 2: Spectral overlay showing the effect of increasing concentration of LG on UV absorption of HSA. |
 |
Figure 3: Double reciprocal plot between 1/(A0 -A) and 1/CLG; A = absorbance of LG-HSA complexes at different concentrations of LG, A0 = Absorbance of free HSA and CLG is the molar concentration of LG. |
Fluorescence
The molecular interaction between a ligand (a quencher) and a fluorescent macromolecule (HSA) is one of the well-studied fluorescence quenching phenomena. The quenching of fluorescent molecules is caused by a variety of variables, including chemical processes in the excited state properties, molecular reorganization interaction, and energy transfer. Tyrosine, phenylalanine, and tryptophan residues are what give HSA its fluorescence. Actually, tryptophan almost entirely accounts for the intrinsic fluorescence of HSA25. Fluorescence spectra of HSA in the presence of different linagliptin concentrations (Fig:4), showed gradual decrease in the intensity as the concentration of drug was increased. This confirms that linagliptin binds HSA changing the microenvironment that surrounds the tryptophan residue. The Stern-Volmer plot reveals the potential quenching mechanism.
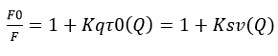
The fluorescence intensities of HSA in the absence and presence of the quencher, respectively, are F0 and F. Kq is the biomolecule’s quenching rate constant, Ksv is the dynamic quenching constant (Ksv = Kqτ0). The biopolymer’s value of τ0 was 10-8 s-1, and [Q] represents the amount of the quencher linagliptin present.
Fig:5 depicts the linear curves that were drawn for the linagliptin-HSA complexes using the Stern-Volmer equation. The Ksv value obtained from the equation was 1.26×10⁻⁴ M-1 (determined from the slope of the curve). As the value of Ksv=Kq τ0, it can be used to compute Kq. τ0 is the fluorescence lifetime of 10-8 s for HSA (Kq value=1.26X10⁻¹²). The small value of Ksv indicated that the linagliptin has low binding affinity with HSA. The modified Stern Volmer equation may be employed when static quenching predominates 25.
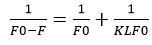
From the graph obtained for 1/(F0-F) vs. 1/Q, one can determine K, which stands for linagliptin- HSA binding constant (Fig: 6). Both the intercept and slope measurements were used to get the value of K. The value of K was 2.179X10⁶ M-1 at room temperature. This lower quenching constant value indicates weak interaction involving static quenching.
 |
Figure 4: Fluorescence emission spectra of HSA in the absence and presence of Linagliptin at different concentrations |
 |
Figure 5: Stern-Volmer plot for Linagliptin-HSA complexes |
 |
Figure 6: plot of 1/(Fo-F) vs (1/Q) for Linagliptin – HSA complexes. |
FT-IR Spectroscopy
The FTIR spectrum of proteins shows several absorption bands, due to presence of amide group at the peptide linkage. The primary bands in FT-IR spectra, amide A(3300 cm-1 to 3465 cm-1) amide I(1700 cm-1 to 1600 cm-1 ) and amide II(1600 cm-1 to 1480 cm-1 ) are produced by the protein band vibrations. Amide I band corresponds to the amide group C=O while the amide II band corresponds to the N-H bending and C-N stretching 28. The comparison of FTIR spectra of free HSA with HSA – drug complex (peak positions and shapes) suggests possible chemical interaction between drug and HSA. In the results, the amide-A band shifted from 3329.36 cm-1 for free HSA to 3318.17 cm-1 for the HSA-LG complex. The Amide-I band showed a small shift from 1638.25 cm-1 to 1638.79 cm-1 (Fig:7&8). These changes in peak positions can be attributed to interaction between drug and HSA.
 |
Figure 7: FT-IR spectra of free HSA |
 |
Figure 8: HSA- LG complex at a concentration of 20 µM |
Circular Dichroism (CD) Spectroscopic Analysis
CD is an absorption spectroscopy method based on differential light absorption by the sample. The way the sample absorbs left and right circulatory polarized light provides structural information of the particular sample. CD is useful in determining secondary structure of a protein, protein folding kinetics and to analyze structural features of a chiral drug. When CD spectra is recorded at the Far-UV region, two negative peaks and one positive peak are observed for a typical α-helical structure while for a β-sheet one positive and one negative peak are detected[28]. In the present work, CD is used to analyze structural changes in the HSA protein after it binds with linagliptin. CD spectra was recorded for free HSA and for HSA-LG complex. We obtained two negative peaks at 209 and 221 nm for native HSA indicating presence of α- helical structure. These peaks result from the π π* and n π* transitions for the peptide bonds. The spectra of HSA-linagliptin complex also showed two negative peaks in the same regions. However, we observed slight increase in the peak intensities (Fig:9). These findings reveal small alteration in the α-helical structure of HSA upon binding with drug.
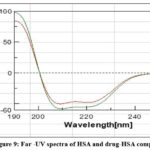 |
Figure 9: Far -UV spectra of HSA and drug-HSA complex |
Molecular Docking
2D and 3D visualization of intermolecular interactions exposed in (Fig:10), were produced between Linagliptin and HSA protein showing that the candidate ligand formed a variety of chemical bonds, such as Pi-Pi Stacked bond established with His242 amino acid residue, three Pi-Alkyl bonds, which were created with Arg257, Ala291, and Leu238 amino acids residues. In addition, six Alkyl bonds were formed towards Trp214, Lys199, Ala215, Phe211, Leu219, and Ile290 amino acids residues. Among these intermolecular interactions, we noticed that linagliptin established interactions with His242 amino acid residue similar to that of R- Warfarin (Fig:11) 29.
 |
Figure 10: 2D and 3D view of intermolecular interaction established between linagliptin and HSA protein |
 |
Figure 11: The active sites of HSA protein in complex with co-crystallized ligand (R-Warfarin) |
Conclusion
Owing to the importance of protein binding ability of drug molecules in the drug development process, linagliptin-HSA interaction mechanisms were studied by using different spectral techniques and molecular docking. UV-Vis spectroscopic results revealed complex formation (K=0.98×10³ M-1) between linagliptin and HSA. In the fluorescence spectroscopic results, linagliptin was able to reduce the fluorescence intensity of HSA via static quenching. The FTIR and CD spectral results showed slight variations in the absorption bands. There is a correlation between experimental results and computational studies. The drug structure was stabilized well at the site-I of HSA supported by Pi-Pi, Pi-alkyl and alkyl bonds. These findings might be useful for understanding the distribution behavior of linagliptin in human studies.
Acknowledgements
We acknowledge the infrastructure support of DST and DST- CURIE AI (WISE – KIRAN Division), Sri Padmavati Mahila Visvavidyalayam, Tirupati, A.P.
Conflict of Interest
There is no conflict of interest.
Funding Sources
There are no funding Sources.
References
- Zhao, P.; Gao, G.; Zhang, L.; Cai, Q.; Lu, N.; Cheng, L.; Li, S.; Hou, X. J. Pharm. Biomed. Anal. 2017. 141. 262-269.
CrossRef - Müller, W, E. Klin Wochenschr. 1977. 1;55(3). 105-10. German.
- Alsamamra, H.; Khalid, I.; Alfaqeh, R.; Farroun, M.; Abuteir, M.; Darwish, S., M. J Biomedical Sci. 2018. 7.3:8.
- Rehman, M; Khan, A. U. Curr Pharm Des. 2015;21(14):1785-99.
CrossRef - Abdollahpour,N; Soheili, V; Saberi, MR; Chamani, J. Eur J Drug Metab Pharmacokinet. 2016 Dec;41(6):705-721.
CrossRef - Chadha, N; Singh, D; Milton, M. D.; Mishra, G; Daniel, J.; Mishra, A. K; Tiwari, A. K. New Journal of Chemistry, 2020 44(7), 2907-2918.
CrossRef - Xu, L; Hu, YX; Li, YC. Chemistry Central Journal 11, 116 2017.
CrossRef - Wani, T.A.; Bakheit, A.H.; Abounassif, M.A.; Zargar, S. Spectroscopic and Molecular Docking Approach. Front. Chem. 6:47. 2018
CrossRef - Mohammadnia, F.; Fatemi, M. H.; Taghizadeh, S. M. Luminescence,2020, 35(2), 266-273.
CrossRef - Tao, P, Li, Z; Matsuda, R; Hage, D. SJournal of Chromatography B. 2018, 1097, 64-73.
CrossRef - Raghav, D; Mahanty, S; Rathinasamy, K. Spectrochimica Acta Part A: Molecular and Biomolecular Spectroscopy.2020, 226, 117584.
CrossRef - Siddiqui, S; Ameen, F; Rehman, S;Sarwar, T; Tabish, M. Journal of Molecular Liquids. 2021, 336, 116200.
CrossRef - Maier R, Madeleine, Fries, R; Fajun, Z., Frank, S. American Chemical Society. 2021,5451–5459.
CrossRef - Rahnama, E; Mahmoodian-Moghaddam, M; Khorsand-Ahmadi, S; Saberi, M.R.; Chamani, J. J Biomol Struct Dyn. 2015,33(3):513-33.
CrossRef - Rahman, S; Rehman, M.T; Rabbani, G; Khan, P; AlAjmi, M.F; Hassan, M.I; Muteeb, G; Kim, J. Int J Mol Sci. 2019 3,20(11):2727.
CrossRef - Śliwińska-Hill, U; Wiglusz, K. Part II. Biophys Chem. 2023, 294:106948.
CrossRef - Seedher, N; & Kanojia, M. Open Chemistry, 2009, 7(1), 96-104.
CrossRef - Graefe-Mody, U.; Retlich, S.; Friedrich, C. Clin. Pharmacokinet. 2012. 51(7). 411-27.
CrossRef - Hossain, M. J., Sultan, M. Z., Rashid, M. A., & Kuddus, M. R.. Analytical Science Advances, 2021, 2(9-10), 480-494.
CrossRef - El fadili, M.; Er-rajy, M.; Imtara, H.; Kara, M.; Zarougui, S.; Altwaijry, N.; Al kamaly,o; Al Sfouk, A.; Elhallaoui, M. Processes. 2022, 10, 1462
CrossRef - Bank, R.P.D., n.d. RCSB PDB – 1H9Z: Human Serum Albumin Complexed with Myristic Acid and the R- (+) enantiomer of warfarin [WWW Document]. URL https://www.rcsb.org/structure/1H9Z(accessed 7.12.23b).
- Norgan, A.P., Coffman, P.K., Kocher, J.P; Katzmann, D.J., Sosa, C.P. J Cheminform . 2011, 3, (12).
CrossRef - BIOVIA Discovery Studio – BIOVIA – Dassault Systèmes® [WWW Document], n.d. URL https://www.3ds.com/products-services/biovia/products/molecular-modeling- simulation/biovia-discovery-studio/ (accessed 3.20.23).
- Purcell, M.; Neault, J.F.; Tajmir-Riahi, H.A. Biochim Biophys Acta. 2000, 1478(1). 61-8.
CrossRef - Farsada,S.A; Haghaeib, H; Shabana, M; Zakariazadehd,M; Soltanieh. Journal of Biomolecular structure and dynamics.2022,40(15):6868-6879.
CrossRef - Abu Teir, M. M; Ghithan, J; Abu-Taha, M; Darwish S,M; and Abu-hadid, M. M . Journal of Biophysics and Structural Biology 2014, 6(1), 1-12
CrossRef - Bratty ,M.A.; Saudi Pharmaceutical Journal : 2020, 28(6):729-736.
CrossRef - Lakshmi,T; Mondal, P.L ; Ramadas,M; Natarajan, K; S. Spectrochim Acta A Mol Biomol Spectrosc. 2017,183. 90-102.
CrossRef - Zentrum für Bioinformatik: Universität Hamburg – Proteins Plus Server [WWW Document], n.d. URL https://proteins.plus/ (accessed 7.12.23).

This work is licensed under a Creative Commons Attribution 4.0 International License.
About The Author
![]()
A New Edition of Web of Science
Journal Impact Factor
2022: 0.5
Five Year: 0.8
Journal is Indexed in

Cabells Whitelist
![]()


