Development of a Multi Residue Method for the Quantification of 45 Pesticides Using Gc-Ms/Ms and Study of Peeling Effect on Pesticide Residues in Citrus Fruits
R. Ramadevi1 , C. Ramachandraiah2*, G.V. Subba Reddy3
1JNTUA, Ananthapuramu, A.P, India .
2Department of Chemistry, Sri Kalahasteewara Institute of Technology, Srikalahasti, Chittoor Dist, A.P, India. Affiliated to Jawaharlal Nehru Technological University Anantapur, Ananthapuramu A.P, India .
3Department of Chemistry, JNTUA College of Engineering, Ananthapuramu, Constituent College of Jawaharlal Nehru Technological University Anantapur, Ananthapuramu. A.P, India.
Corresponding Author E-mail: cramachandraiah@yahoo.com
DOI : http://dx.doi.org/10.13005/ojc/390507
Article Received on : 04 Jul 2023
Article Accepted on : 16 Oct 2023
Article Published : 19 Oct 2023
Reviewed by: Dr. Naresh Batham
Second Review by: Dr. Awad Abdalla Momen
Final Approval by: Dr. Mohsen Mhadhbi
An analytical method was developed and validated for the determination of 45 multi-class pesticide residues in citrus fruit samples collected from and around Pulivendula, India, using GC-MS/MS (Gas chromatography with tandem mass spectrometry) followed by the QuEChERS extraction method . The linear regression coefficients (R-square) of the methods range from 0.998 to 0.999, and the Limit of Detection (LOD) and Limit of Quantification (LOQ) are 1.56 to 25.23 ng/mL and 4.72 to 76.47 ng/mL, respectively. Recoveries of all spiked pesticides range from 82.6 to 117.6%, with a RSD (Relative Standard Deviation) less than 11.2%. The results show that 42 out of 45 pesticides were detected in whole citrus fruit pulp (with peel) samples. Fenthion, bifenthrin, and fenvalerate were not detected. In the collected citrus samples, phorate (21.71 µg/kg), and ethion (51.47 µg/kg) insecticides are present above the Maximum Residue Level (MRL), but cypermethrin (25.89 µg/kg) was detected below the MRL. 13 out of 45 pesticides were detected in edible parts of citrus fruit (without peel) samples, with ethion having the highest residue. All pesticides were within the MRL limits prescribed by the European Union (EU) and Codex regulations for MRL in citrus fruits, and peeling was found to be one of the best ways to get rid of pesticide residues.
KEYWORDS:Citrus Fruits; GC-MS/MS; 45 multi-class pesticides; pesticide residues; QuEChERS extraction
Download this article as:| Copy the following to cite this article: Ramadevi R, Ramachandraiah C, Reddy G. V. S. Development of a Multi Residue Method for the Quantification of 45 Pesticides Using Gc-Ms/Ms and Study of Peeling Effect on Pesticide Residues in Citrus Fruits. Orient J Chem 2023;39(5). |
| Copy the following to cite this URL: Ramadevi R, Ramachandraiah C, Reddy G. V. S. Development of a Multi Residue Method for the Quantification of 45 Pesticides Using Gc-Ms/Ms and Study of Peeling Effect on Pesticide Residues in Citrus Fruits. Orient J Chem 2023;39(5). Available from: https://bit.ly/3QlabzE |
Introduction
The Rutaceae family, which includes citrus fruits, is the most well-known and commonly cultivated fruit family in the world, with an annual production of 158 million metric tonnes 1. China is the world’s leading producer of citrus, with 44 million metric tonnes (approximately 28% of total production). With 19.7 million metric tonnes, Brazil comes in second, followed by 14 million metric tonnes for India. Citrus fruits are India’s third most produced fruit, behind mango and banana. 26 states in total, about 1.04 million acres, are used for agriculture 2.
In order to safeguard consumer health and promote ethical practises in the food trade, the Food and Agriculture Organization of the United Nations (FAO) and the World Health Organization (WHO) established the Codex Alimentarius Commission (CAC) in 1963. The CAC develops standardised international food standards, guidelines, and codes of practise. The Commission also encourages worldwide governmental and non-governmental groups to coordinate all of their efforts in the area of food standards 3. Regulations from the European Union (EU) outline the maximum residual limit (MRL) for pesticides in products with plant origins 4. The second important organisation is the Food Safety and Standards Authority of India (FSSAI). The Ministry of Health and Family Welfare formed the FSSAI in accordance with the Food Safety and Standards Act of 2006, and it is responsible for recommending tolerance levels for certain pesticides in food commodities 5.
Gas chromatography-tandem mass spectrometry (GC-MS/MS), which has the ability to separate coeluting compounds based on compound-specific target-oriented multiple reaction monitoring (MRM) transitions, appears to be a potent technique for overcoming these issues 6,7. The extraction and detection methods for estimating the presence of pesticide residues in fruits and vegetables are summarized in Table 1.
In a recent study, the active ingredients in the veggie and fruit samples were chlorpyrifos, malathion, dieldrin, boscalid, triticonazol, difenocpnazol, acetamiprid, azoxystrobin, tebuconazole, trifloxystrobin, pirimicarb, and dodine. But in six of the samples, the amount of active chemicals was above the maximum residue levels (MRL). The different methods used in the study showed that peeling was the best way to get rid of pesticide residue. The washing process also showed that it got rid of some poisons but didn’t get rid of all of them 8.
Table 1: An overview of extraction methods, detection techniques, recovery (%), LOD, and LOQ of pesticides in fruits and vegetable.
|
S.No |
Method of Extraction |
Method of Separation/ Detection |
No of target pesticides |
Recovery (%) |
Type of Fruit & Vegetables |
LOD mg/kg |
LOQ mg/kg |
Refernces |
|
1 |
Liquid-liquid Extraction (LLE) |
UHPLC- QqQ / TOF/QTOF |
11-Multi-class pesticides |
70-100 |
Orange, tomato, and pepper, |
0.01 |
None |
9 |
|
2 |
Liquid-liquid microextraction (LLME) |
GC-MS/MS |
Pyrethroid insecticides |
73-92 |
Fruits and |
0.006-0.038 |
0.023-0.121 |
10 |
|
3 |
QuEChERS |
GC-MS-TOF |
55-multi-class pesticides |
70-120 |
Apple, tomatoes, |
None |
0.01 – 0.5 |
11 |
|
4 |
QuEChERS |
GC-MS-MSD (NCI) |
25- multi-class pesticides |
70-110 |
Apple, oranges, |
None |
None |
12 |
|
5 |
QuEChERS |
GC-MS/MS (QqQ) |
140- multi-class pesticides |
70-110 |
Cucumber |
0.006 |
0.008 |
13 |
|
6 |
QuEChERS |
GC-MS/MS |
THI, IMD |
70-120 |
Orange |
None |
None |
14 |
|
7 |
DMD & EBD |
LC-MS/MS, LC-MS |
Dithiocarbamate |
97-101 |
Cucumbers, |
0.001 |
0.005 |
15 |
|
8 |
QuEChERS |
UHPLC-MS/MS |
88-pesticides |
None |
Citrus Fruits |
0.0034 |
None |
16 |
When eating citrus fruits, it’s normal to peel them first. Lemons, on the other hand, are often used without being peeled to make spices 17. The goal of this study was to develop and validate a multi-residue method to examine the 45 pesticide residues in citrus fruits (sweet lime and lemon) collected from three different forming lands at Ankalamma Guduru, Duddekunta, and Kadapanagaya Palli in and around Pulivendula using GC-MS/MS. Further, the effect of home cleaning methods on pesticide residue in citrus fruits (sweet lime and lemon) was also analyzed.
Materials and Methods
Chemicals and Reagents
The 45 pesticides specified in Table 2, that have technical-grade standards with purity levels of ≥96% were bought from M/S Sigma Aldrich in Bengaluru, Karnataka, India, for use in this study. Local suppliers also provided QuEChERS extraction solvents such as ethyl acetate (C4H8O2), sodium acetate, MgSO4, and PSA.
Selection of Sampling Area
As per the YSR Kadapa district survey report for the year 2021–22 given by the Andhra Pradesh Space Applications Centre (APSAC) ITE and C Department, Govt. of Andhra Pradesh 18, the total land used for cultivating orange and batavia is nearly 69991 Acres with 438928 MT of production. Among those, 66% of total production came from Pulivendula Tehsil alone, with citrus cultivation land of approximately 45000 Acres. So, the sampling areas are selected in and around the Pulivendula, namely Ankalamma Guduru (14°34’52.0″N 78°10’55.7″E), Duddekunta (14°37’14.5″N 78°12’15.6″E), and Kadapanagaya Palli (14°36’43.1″N 78°11’41.7″E).
Sample Collection and Pre-processing
The citrus fruits, around 80 nos., were collected from three different forming lands mentioned above and subsamples were mixed to make a single sample from each land. Three different types of citrus fruits, namely FS1 (ripe sweet lime fruit, 7 months old), FS2 (raw sweet lime fruit, 2 months old), and FS3 (ripe lemon, 7 months old), were collected, cleaned thoroughly with water, and sent to the laboratory for further analysis. Whole citrus fruits and edible parts of citrus fruits were extracted from the fruit samples separately. Further, the samples are blended and homogenized and kept at 2-4 °C for further analysis.
Instrumentation
The 45 multi-class pesticides are extracted using the chosen GC-MS/MS instrument optimised for citrus fruit samples. The mass spectrometer, a Shimadzu GCMSTQ8040NX model from Japan is utilized in the present study. It is also connected to a GC-2010 Plus that has an AOC-20i autosampler and a 20S autoinjector fitted. 15 metres, 250 m ID, 0.25 m length SX-Rxi-5 Sil MS capillary column was employed. As the carrier gas, helium was used at a constant level of pressure that was changed every day. The gas chromatograph’s intake was lined with glass wool inside of a splitless GC glass liner from Shimadzu, Japan. The injection port and transfer line for the mass spectrometer were both 220 °C with a 1 ml/min column flow and a 1.1 ml/min purge flow, and the electron energy of the EI positive was 70 eV. The temperature programme used to operate the GC oven was as follows: the starting point of 50 °C held for 0.5 min, scaled at 120 °C/min to 60 °C held for 1.5 min, afterwards an increase of 25 °C/min to 170 °C held for 1 min, followed by a ramp of 10 °C/min to 280 °C maintained for 7 min. The contact area was kept at 250°C, the source of ions was set at 230°C, and the M/Z (scan) range was within 50 and 500 for a total run time of 25.48 minutes.
Preparation of Standard Pesticide Solutions
Weigh 5 mg of an individual clean standard into a 10 mL individual volumetric flask, make up to the mark with ethyl acetate, and store at 2–8 °C. The right amount of each standard stock solution, derived from its concentration, is transferred into a 10 mL volumetric flask and then diluted with ethyl acetate to create working standard solutions (1 mg/L). Label the solutions, and then keep them between 2 and 8°C. Prepare the calibration curve standards using ethyl acetate and label them with concentrations ranging from 10 ng/mL to 200 ng/mL. By mixing appropriate amounts of each pesticide to make spike solutions at 10, 50, and 100 ng/mL.
Multiclass Residue Extraction and Clean-up
Samples of citrus (sweet lime and lemon) were carefully mixed in ambient light. After further high-speed homogenization of the blended sample (200 g), 10 g of homogenous material were weighed into a 50 mL centrifuge tube. Twenty minutes later, add 10 mL of ethyl acetate and vortex. Add the 1.5 g sodium acetate and 6 g MgSO4 from the QuEChERS extraction kit. For 30 seconds, shake. The sample should be centrifuged at 6000 RPMs for 5 minutes at 20°C. Take 1 mL of supernatant into a 2 mL dispersion tube (5982-0028 CH). Vortex for 1 minute and centrifuge the sample at 9000 rpm for 10 minutes at 20° C. Collect Supernant that filtered through 0.2 μm polytetrafluoroethylene membrane filter transfer in to auto sampler vial for analysis by GC-MS/MS technique.
Method Development
Throughout the development of the method, linearity, LOD, LOQ, accuracy, and precision were all validated. The apparatus must be calibrated in order to conduct an accurate analysis. The ability of an analytical procedure to produce results from tests that are directly proportional to the concentration of an analyte in the sample is referred to as linearity. Calibration curve standards of five concentrations, namely 10, 25, 50, 100, and 200 ppb, were injected into GC-MS/MS. The diagram of responses as a function of analyte concentration is evaluated using a typical regression analysis with a minimum of five linear concentrations. With a signal-to-noise (S/N) ratio of 3 and 10, respectively, the least concentration was used to calculate the LOD and LOQ for each pesticide.
Method Validation
The spiking pesticide standards containing all 45 multiclass pesticides at three concentrations of 10, 50, and 100 ppb were used to study recoveries and validate the developed method. The accuracy and precision of the approach were evaluated in recovery trials with three spike levels in three replicates. The acceptable pesticide recoveries have a Relative Standard Deviation (RSD n = 3) <11.2% and fall between 82.6 and 117.6%. Pesticide retention times in sample extracts were matched with a tolerance of 0.1 min by the average retention periods of the calibration standards recorded in the same analytical process 19.
Result and Discussions
Method Development
A modified QuEChERS extraction method with d-SPE clean-up followed by GC-MS/MS was developed for the detection of 45 multi-class pesticides in citrus fruits. Multi-residue method to examine the 45 pesticide residues in citrus fruits (sweet lime and lemon) collected from three different forming lands at Ankalamma Guduru, Duddekunta, and Kadapanagaya Palli in and around Pulivendula. Further, the effect of home cleaning methods on pesticide residue in citrus fruits (sweet lime and lemon) was also analyzed.
The linearity of each pesticide was tested at five different concentrations of calibration curve standards: 10, 25, 50, 100, and 200 ng/mL, or ppb. All pesticides’ mass spectral responses were linear in the examined concentration range, with determinant coefficients > 0.981. Table 2 provides a summary of the calibration data for the pesticides under investigation.
By introducing 1 µL of a 100 ng/mL mixed pesticide standard mixture into the GC-MS/MS, the MRM transitions and associated acquisition settings were tuned for the highest response of the fragmented ions under EI positive mode. The most sensitive product ions were then determined by testing various collision energies after using helium gas to initiate dissociation. Various pesticide residues in actual samples were quantified using the optimized parent m/z and product ion transitions with CE. For the analytical approach used to detect multiclass pesticides at their lowest levels in citrus fruits, the developed GC- MRM mode offers high sensitivity and selectivity criteria.
Figure 1 shows the GC-MS/MS total ion chromatogram (TIC) of the total pesticide standard mixture at 100 ng/mL concentrations, which was used to correctly identify all of the pesticides. Table 2 includes a list of pesticides along with details on their retention times R(t), MRM Transition (m/Z), reference ion, collision energy (eV), and retention times. By identifying the target and qualifier ions and calculating the qualifier-to-target ratio, the presences of pesticides were confirmed. Also, the set of regression equations, R-square values, LOD (limit of detection), and LOQ (limit of quantification) were reported. The coefficients of determination of methods range from 0.981 to 0.999. Comparatively, the limit of detection 1.56 to 25.23 ng/mL and limit of quantitation are 4.72 to 76.47 ng/mL compared to other studies published on the same matrices.
 |
Figure 1: GC/MS-MS Total Ion Chromatogram (TIC) of the pesticide standard mixture (100 ng/mL). Peaks: ES: Ethyl Acetate, |
Table 2: List of Retention times (Rt), MRM transitions (m/Z), reference ion, collision energy (CE), R-square, Regression Equation, LOD, and LOQ.
|
S.No |
Pesticide Name |
Rt (min) |
m/Z |
Reference ion |
CE (eV) |
R-square |
Regression Equation |
LOD (ppb) |
LOQ (ppb) |
|
1 |
Dichlorvos |
6.846 |
185.0 -> 93.0 |
185.0 -> 109.0, 220.0 -> 185.0 |
10 |
0.99983 |
y = 13535.801057 * x – 30738.801642 |
2.62 |
7.93 |
|
2 |
HCH Alpha |
10.903 |
181.0 -> 145.0 |
216.9 -> 145.0, 216.9 -> 181.0 |
10 |
0.99992 |
y = 23205.073825 * x – 40391.556774 |
2.31 |
7.01 |
|
3 |
Phorate |
10.782 |
260.0 -> 75.0 |
260.0 -> 231.0, 121.0 -> 120.2 |
10 |
0.98156 |
y = 17.364207 * x – 56.245683 |
3.73 |
10.93 |
|
4 |
Hexachloro Benzene |
11.062 |
249.0 -> 213.9 |
284.0 -> 248.9, 284.0 -> 213.9 |
20 |
0.99999 |
y = 22540.757782 * x – 20725.619933 |
1.56 |
4.72 |
|
5 |
PCNB |
11.062 |
249.0 -> 214.0 |
214.0 -> 179.0, 237.0 -> 143.0 |
15 |
0.99999 |
y = 22540.757782 * x – 20725.619933 |
1.56 |
4.72 |
|
6 |
Dimethoate |
11.144 |
125.0 -> 47.0 |
125.0 -> 79.0, 229.0 -> 87.0 |
15 |
0.99924 |
y = 13077.721688 * x – 20886.312248 |
6.53 |
19.79 |
|
7 |
HCH beta |
11.535 |
180.8 -> 145.0 |
183.0 -> 147.0 |
15 |
0.99971 |
y = 24554.821803 * x – 54489.655006 |
3.54 |
10.73 |
|
8 |
HCH Gamma |
11.995 |
180.8 -> 145.0 |
183.0 -> 147.0 |
5 |
0.99911 |
y = 19281.415473 * x – 50340.829472 |
7.30 |
22.12 |
|
9 |
Diazinon |
11.805 |
137.1 -> 84.0 |
179.0 -> 137.0, 199.0 -> 93.0 |
10 |
0.99944 |
y = 9921.136162 * x – 15179.248096 |
8.45 |
25.59 |
|
10 |
HCH Delta |
12.001 |
219.0 -> 147.0 |
217.0 -> 145.0 |
15 |
0.99775 |
y = 2389.343405 * x – 7861.705503 |
17.78 |
53.87 |
|
11 |
Phosphomidon |
12.566 |
264.0 -> 127.0 |
127.0 -> 95.0, 192.9 -> 127.0 |
15 |
0.99628 |
y = 3193.648941 * x – 13219.592271 |
16.86 |
51.08 |
|
12 |
Methyl Parathion |
13.270 |
125.0 -> 47.0 |
263.0 -> 246.0, 263.0 -> 109.0 |
10 |
0.99911 |
y = 17820.228893 * x – 38530.637212 |
8.13 |
24.62 |
|
13 |
Chlorpyrifos Methyl |
12.748 |
285.9 -> 92.9 |
286.0 -> 241.0, 286.0 -> 208.0 |
20 |
0.99975 |
y = 12281.428410 * x – 26070.029620 |
3.44 |
10.41 |
|
14 |
HeptaChlor |
12.918 |
271.7 -> 236.9 |
270.0 -> 235.0, 272.0 -> 237.0 |
15 |
0.99969 |
y = 35702.003593 * x – 64128.740508 |
4.74 |
14.37 |
|
15 |
Malathion |
13.454 |
126.9 -> 99.0 |
157.8 -> 125.0, 173.0 -> 127.0 |
10 |
0.99800 |
y = 37846.919104 * x – 121311.361026 |
12.78 |
38.72 |
|
16 |
ParaxonEthyl |
13.267 |
247.0 -> 109.1 |
148.9 -> 119.0, 220.0 -> 174.1 |
20 |
0.99717 |
y = 1951.810374 * x – 4093.913450 |
21.61 |
65.47 |
|
17 |
Fenitrothion |
13.265 |
277.0 -> 109.0 |
277.0 -> 260.0 |
15 |
0.99403 |
y = 4307.870163 * x – 17097.284311 |
25.23 |
76.47 |
|
18 |
Pirimiphos Methyl |
13.285 |
290.0 -> 125.0 |
290.0 -> 233.0, 305.0 -> 276.0 |
2 |
0.99866 |
y = 4315.877055 * x – 6758.433389 |
10.00 |
30.30 |
|
19 |
fenthion |
13.633 |
278.0 -> 109.0 |
278.0 -> 245.1, 278.0 -> 169.1 |
15 |
0.99793 |
y = 202.940087 * x + 1336.475654 |
13.81 |
41.85 |
|
20 |
Aldrin |
13.592 |
262.9 -> 192.9 |
262.9 -> 190.9, 254.9 -> 220.0 |
35 |
0.99933 |
y = 17824.013709 * x – 15928.701717 |
11.23 |
34.02 |
|
21 |
Parathion |
13.689 |
291.0 -> 109.0 |
291.0 -> 263.0, 139.0 -> 109.0 |
15 |
0.99536 |
y = 3598.490725 * x – 16995.502167 |
17.38 |
52.67 |
|
22 |
chloropyrifos |
13.672 |
198.9 -> 171.0 |
196.9 -> 169.0, 313.8 -> 257.8 |
15 |
0.99965 |
y = 21414.846187 * x – 33668.299983 |
3.69 |
11.17 |
|
23 |
Dicofol |
13.735 |
250.0 -> 139.0 |
251.0 -> 139.0, 253.0 -> 141.0 |
15 |
0.99935 |
y = 12429.267744 * x – 11780.915771 |
7.07 |
21.41 |
|
24 |
HeptaChlorEpoxide |
14.349 |
353.0 -> 262.9 |
353.0 -> 282.0, 353.0 -> 217.1 |
10 |
0.99961 |
y = 3438.057811 * x – 1718.309628 |
5.88 |
17.82 |
|
25 |
Alpha Endosulfon |
15.035 |
241.0 -> 206.0 |
194.9 -> 125.0, 194.9 -> 160.0 |
10 |
0.99964 |
y = 3082.068273 * x – 3484.245645 |
3.90 |
11.82 |
|
26 |
Cis chlordane |
15.080 |
373.0 -> 266.0 |
373.0 -> 264.0, 266.0 -> 196.0 |
20 |
0.99961 |
y = 8207.643701 * x – 9442.522499 |
6.41 |
19.42 |
|
27 |
TransChlordane |
15.080 |
373.0 -> 266.0 |
373.0 -> 264.0 |
20 |
0.99961 |
y = 8207.817818 * x – 9435.897798 |
6.39 |
19.35 |
|
28 |
2,4 DDE |
15.447 |
246.0 -> 176.1 |
318.0 -> 246.1 |
30 |
0.99953 |
y = 108929.164403 * x – 66759.369967 |
9.19 |
27.86 |
|
29 |
DDE |
15.447 |
246.0 -> 176.1 |
318.0 -> 248.1, 318.0 -> 246.1 |
30 |
0.99953 |
y = 108929.164403 * x – 66759.369967 |
9.19 |
27.86 |
|
30 |
Beta Endosulfon |
15.932 |
241.0 -> 206.0 |
195.0 -> 125.0, 195.0 -> 160.0 |
10 |
0.99906 |
y = 548.116580 * x – 272.513443 |
9.93 |
30.08 |
|
31 |
Dieldrin |
15.931 |
262.9 -> 193.0 |
262.9 -> 191.0, 277.0 -> 206.0 |
35 |
0.99930 |
y = 9198.817347 * x – 2845.932902 |
10.99 |
33.30 |
|
32 |
endrin |
15.931 |
262.8 -> 193.0 |
244.8 -> 210.0, 281.0 -> 245.0 |
35 |
0.99930 |
y = 9198.817347 * x – 2845.932902 |
10.99 |
33.30 |
|
33 |
DDD |
16.232 |
235.0 -> 165.1 |
235.0 -> 200.1, 235.0 -> 199.1, |
35 |
0.99983 |
y = 159025.732511 * x – 160552.398724 |
4.89 |
14.83 |
|
34 |
Endrin Aldehyde |
16.451 |
281.0 -> 245.0 |
249.9 -> 214.9, 344.9 -> 244.9 |
10 |
0.99958 |
y = 1857.919198 * x – 4192.028492 |
8.12 |
24.61 |
|
35 |
4,4 DDT |
16.232 |
235.0 -> 165.0 |
235.0 -> 199.0 |
20 |
0.99983 |
y = 159026.158530 * x – 160518.303409 |
4.96 |
15.03 |
|
36 |
Ethion |
16.309 |
231.0 -> 175.0 |
231.0 -> 203.0, 231.0 -> 129.0 |
10 |
0.99876 |
y = 28780.040853 * x – 77709.304562 |
10.10 |
30.62 |
|
37 |
Endosulfan Sulfate |
16.884 |
272.0 -> 236.9 |
272.0 -> 234.9, 387.0 -> 206.0 |
10 |
0.99881 |
y = 6439.247511 * x – 27176.009390 |
8.55 |
25.90 |
|
38 |
Endrin Ketone |
17.743 |
317.0 -> 281.0 |
281.0 -> 245.0, 317.0 -> 245.0 |
5 |
0.99784 |
y = 297.168231 * x – 1171.496159 |
11.60 |
35.16 |
|
39 |
Methoxychlor |
17.950 |
227.1 -> 169.1 |
227.1 -> 212.2, 227.1 -> 141.1 |
20 |
0.99932 |
y = 19226.409644 * x – 50328.270146 |
9.81 |
29.72 |
|
40 |
Bifenthrin |
17.856 |
181.2 -> 165.2 |
165.0 -> 164.1, 166.2 -> 165.2 |
25 |
0.99923 |
y = 148026.797780 * x + 72570.672075 |
11.64 |
35.27 |
|
41 |
Phosalone |
18.507 |
367.0 -> 182.0 |
182.0 -> 102.1, 182.0 -> 75.1 |
10 |
0.99658 |
y = 5417.104659 * x – 20318.177402 |
16.16 |
48.97 |
|
42 |
cypermethrin |
19.853 |
163.0 -> 127.0 |
165.1 -> 127.0, 181.0 -> 151.0, |
10 |
0.99960 |
y = 26881.983252 * x – 45465.169362 |
6.03 |
18.27 |
|
43 |
Permethrin |
19.853 |
163.0 -> 127.0 |
183.1 -> 165.1, 183.1 -> 153.1, |
10 |
0.99960 |
y = 26881.983252 * x – 45465.169362 |
6.03 |
18.27 |
|
44 |
Fenvalerate |
21.103 |
167.0 -> 125.1 |
225.0 -> 119.1 |
5 |
0.99736 |
y = 4125.749123 * x + 21323.916736 |
15.91 |
48.20 |
|
45 |
Deltamethrin |
24.373 |
253.0 -> 174.1 |
252.9 -> 93.0, 253.0 -> 172.0 |
10 |
0.99866 |
y = 788.534919 * x – 2759.529094 |
9.64 |
29.21 |
Rt – Retention time in minutes, R-square- Coefficient of Determination,
m/Z- MRM transitions, LOD-Limit of Detection in ng/mL
CE – Collision Energy in eV, LOQ-Limit of Quantification in ng/mL.
Method Validation
The results of recoveries at three different fortification levels (10, 50, and 100 ng/mL) and their relative standards (n = 3) are plotted in Figure 2. This method has a high degree of accuracy (between 82.6% and 117.6% of recovery), reproducibility (1.1 to 11.2 of RSD), and robustness, making it suitable for large-scale monitoring of citrus fruits gathered from farmer’s fields. The obtained R-square, LOD, LOQ, and recoveries of all pesticides are good when compared to other findings in the citrus fruit matrix 4,14,16,20-25
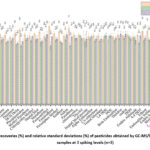 |
Figure 2: Average recoveries (%) and relative standard deviations (%) of pesticides obtained by GC-MS/MS analysis of citrus samples at 3 spiking levels (n=3). |
Application of the Developed Technique
The citrus fruits, around 80 nos., were collected from three different forming lands located at Ankalamma Guduru, Duddekunta, and Kadapanagaya Palli and thoroughly mixed to make a single sample. Three different types of citrus fruits, namely FS1 (ripe sweet lime fruit, 7 months old), FS2 (raw sweet lime fruit, 2 months old), and FS3 (ripe lemon, 7 months old), were collected, cleaned thoroughly with water, and sent to the laboratory for further analysis. Whole citrus fruit (with peel) and edible parts of citrus fruits (without peel) were taken from the fruit samples separately. Further, the samples are grinded and kept at 2-4 °C for further analysis. The developed GC-MS/MS technique was used to extract multi-class pesticide residues from the aforementioned samples, and the results are tabulated in Table 3.
Whole Citrus Fruit (with peel)
The results show that 42 out of 45 pesticides were detected in whole citrus fruit pulp (with peel) samples. Fenthion, bifenthrin, and fenvalerate were not detected. In the collected citrus samples, phorate (21.71 µg/kg highest in ripe lemon), and ethion (51.47 µg/kg highest in ripe lemon), insecticides are present above the maximum residue limit (MRL) level, but cypermethrin (25.89 µg/kg highest in ripe sweet lime) was detected below the MRL, as shown in Figure 3. Numerical data for the graph is reported in Table 3. Ethion and cypermethrin are the most commonly used pesticides in citrus orchards. During the study period, both pesticides were sprayed twice each. Surprisingly, phorate was found in whole citrus fruit, but due to its extreme toxicity to mammals, fish, and birds, it was banned in India in 2021. Except for phorate and ethion remaining, all pesticide residues are below the MRL prescribed by the EU, and Codex regulations for MRL in citrus fruits are reported in Table 3.
Edible Parts of Citrus Fruit (without peel)
The results show that 13 out of 45 pesticides were detected in edible parts of citrus fruit (without peel) samples. HCH Alpha, Phorate, HCH Beta, Phosphomidon, Chlorpyrifos Methyl, Malathion, Parathion, Chlorpyrifos, 4.4 DDT, Ethion, Cypermethrin, and Permethrin are detected in edible parts of citrus fruit (without peel) samples. Among all pesticides, ethion (4.755 µg/kg highest in raw sweet lime) has the highest residue in citrus fruit, as shown in figure 4. Numerical data for the graph are reported in Table 3. When it comes to the MRL, all the detected pesticides are within the MRL limits prescribed by the EU and Codex regulations for MRL in citrus fruits.
When comparing the results from figures 3 and 4, the residues of pesticides in edible parts of the citrus fruits were observed at a very low level when compared with the whole fruit (with peel). So once again, the study showed that peeling was one of the best ways to get rid of pesticide residues (around 90% reduction in pesticide residues) from the fruit sample.
 |
Figure 3: Pesticide residue in whole fruit sample with peel (µg/kg). |
 |
Figure 4: Pesticide residue in whole fruit sample without peel (µg/kg) |
Table 4: Pesticide residues detected on three citrus samples with peel and without peel.
|
S.No |
Pesticide |
Whole Fruit (with peel) µg/kg |
Edible part (without peel) µg/kg |
MRL1 |
MRL2 |
||||
|
FS1* |
FS2* |
FS3* |
FS1* |
FS2* |
FS3* |
||||
|
1 |
Dichlorvos |
2.278 |
2.274 |
2.278 |
ND |
1.645 |
ND |
10 |
NA |
|
2 |
HCH Alpha |
1.747 |
1.750 |
1.768 |
0.672 |
0.684 |
0.698 |
10 |
NA |
|
3 |
Phorate |
13.587 |
21.66 |
21.71 |
2.225 |
2.714 |
3.654 |
10 |
NA |
|
4 |
Hexachloro Benzene |
0.961 |
0.959 |
0.946 |
ND |
ND |
ND |
10 |
NA |
|
5 |
PCNB |
0.961 |
0.959 |
0.946 |
ND |
ND |
ND |
NA |
NA |
|
6 |
Dimethoate |
1.629 |
1.750 |
1.701 |
ND |
ND |
ND |
10 |
5000 |
|
7 |
HCH beta |
2.229 |
2.276 |
2.228 |
0.547 |
0.644 |
0.632 |
10 |
NA |
|
8 |
HCH Gamma |
2.624 |
2.625 |
2.624 |
ND |
ND |
ND |
10 |
NA |
|
9 |
Diazinon |
1.550 |
1.586 |
1.587 |
ND |
ND |
ND |
10 |
NA |
|
10 |
HCH Delta |
3.390 |
4.896 |
3.805 |
1.332 |
1.430 |
1.201 |
NA |
NA |
|
11 |
Phosphomidon |
4.235 |
4.246 |
4.247 |
1.323 |
1.118 |
1.164 |
NA |
NA |
|
12 |
Methyl Parathion |
2.170 |
2.173 |
2.228 |
0.514 |
ND |
0.175 |
NA |
NA |
|
13 |
Chlorpyrifos Methyl |
2.132 |
2.148 |
2.151 |
1.252 |
1.125 |
1.712 |
10 |
2000 |
|
14 |
HeptaChlor |
1.804 |
1.803 |
1.804 |
ND |
ND |
ND |
10 |
10 |
|
15 |
Malathion |
3.229 |
3.627 |
5.002 |
2.277 |
2.438 |
1.878 |
20 |
7000 |
|
16 |
ParaxonEthy |
2.171 |
2.695 |
2.597 |
ND |
ND |
ND |
NA |
NA |
|
17 |
Fenitrothion |
4.026 |
4.513 |
4.763 |
ND |
ND |
ND |
10 |
NA |
|
18 |
Pirimiphos Methyl |
1.581 |
1.598 |
1.592 |
ND |
ND |
ND |
10 |
NA |
|
19 |
Fenthion |
ND |
ND |
ND |
ND |
ND |
ND |
10 |
2000 |
|
20 |
Aldrin |
0.922 |
1.192 |
1.119 |
ND |
ND |
ND |
10 |
50 |
|
21 |
Parathion |
4.741 |
5.240 |
5.327 |
1.457 |
1.222 |
1.722 |
50 |
NA |
|
22 |
Chlorpyrifos |
1.584 |
1.629 |
1.627 |
0.996 |
0.845 |
0.758 |
10 |
1000 |
|
23 |
Dicofol |
0.973 |
0.969 |
1.028 |
ND |
ND |
ND |
20 |
NA |
|
24 |
HeptaChlorEpoxide |
0.604 |
0.555 |
0.581 |
ND |
ND |
ND |
NA |
NA |
|
25 |
Alpha Endosulfon |
1.174 |
1.206 |
1.245 |
ND |
ND |
ND |
50 |
NA |
|
26 |
Cis chlordane |
1.166 |
1.181 |
1.171 |
ND |
ND |
ND |
10 |
NA |
|
27 |
TransChlordane |
1.165 |
1.180 |
1.205 |
ND |
ND |
ND |
NA |
NA |
|
28 |
2,4 DDE |
0.615 |
0.618 |
0.624 |
ND |
ND |
ND |
1000 |
1000 |
|
29 |
DDE |
0.615 |
0.618 |
0.624 |
ND |
ND |
ND |
NA |
NA |
|
30 |
Beta Endosulfon |
0.742 |
0.803 |
0.836 |
ND |
ND |
ND |
50 |
NA |
|
31 |
Dieldrin |
1.008 |
0.713 |
0.650 |
ND |
ND |
ND |
10 |
50 |
|
32 |
Endrin |
1.008 |
0.713 |
0.650 |
ND |
ND |
ND |
10 |
NA |
|
33 |
DDD |
1.037 |
1.108 |
1.091 |
ND |
ND |
ND |
NA |
NA |
|
34 |
Endrin Aldehyde |
2.285 |
2.402 |
2.392 |
ND |
ND |
ND |
NA |
NA |
|
35 |
4,4 DDT |
1.015 |
1.035 |
1.091 |
0.746 |
0.544 |
0.788 |
50 |
NA |
|
36 |
Ethion |
40.51 |
41.55 |
51.47 |
4.173 |
4.755 |
3.932 |
10 |
NA |
|
37 |
Endosulfan Sulfate |
4.237 |
4.258 |
4.237 |
ND |
ND |
ND |
NA |
NA |
|
38 |
Endrin Ketone |
4.027 |
4.179 |
4.044 |
ND |
ND |
ND |
NA |
NA |
|
39 |
Methoxychlor |
2.620 |
2.690 |
2.628 |
ND |
ND |
ND |
10 |
NA |
|
40 |
Bifenthrin |
ND |
ND |
ND |
ND |
ND |
ND |
50 |
50 |
|
41 |
Phosalone |
3.759 |
3.759 |
3.759 |
ND |
ND |
ND |
10 |
NA |
|
42 |
Cypermethrin |
25.89 |
24.14 |
24.15 |
3.145 |
3.915 |
3.005 |
2000 |
200 |
|
43 |
Permethrin |
1.719 |
1.998 |
1.718 |
0.555 |
0.855 |
0.854 |
50 |
500 |
|
44 |
Fenvalerate |
ND |
ND |
ND |
ND |
ND |
ND |
20 |
NA |
|
45 |
Deltamethrin |
3.590 |
3.677 |
3.691 |
ND |
ND |
ND |
40 |
20 |
1Maximum Residue Limit – EU Regulations maximum residue limit in citrus fruits in ng/mL
2Maximum Residue Limit – Codex preferred maximum residue limit in citrus fruits and its products in µg/kg
FS1 (ripe sweet lime fruit, 7 months old),
FS2 (raw sweet lime fruit, 2 months old), and
FS3 (ripe lemon, 7 months old)
NA- Not Available
Conclusion
In conclusion, the analytical method for simultaneous determination of 45 multi-class pesticide residues in three citrus fruit samples was successfully developed. The proposed optimised method is appropriate for rapidly (less than 25 minutes) screening citrus fruits for 45 diverse chemical pesticides. The linear regression coefficients of the methods range from 0.981 to 0.999. Comparatively, the limits of detection and quantitation are very low 1.56 to 25.23 ng/mL and 4.72 to 76.47 ng/mL compared to other studies published on the same matrices. This method has a high degree of accuracy (between 82.6% and 117.6%) with RSD 1.1-11.2% reproducibility, and robustness, making it suitable for large-scale monitoring of citrus fruits gathered from farmer’s fields.
Further, the developed method was used to analyse the pesticides residues in citrus fruit samples. The results show that 42 out of 45 pesticides were detected in whole citrus fruit pulp (with peel) samples. Fenthion, bifenthrin, and fenvalerate were not detected. In the collected citrus samples, phorate (21.71 µg/kg highest in ripe lemon), and ethion (51.47 µg/kg highest in ripe lemon), insecticides are present above the maximum residue limit (MRL) level, but cypermethrin (25.89 µg/kg highest in ripe sweet lime) was detected below the MRL. Ethion and cypermethrin are the most commonly used pesticides in citrus orchards. During the study period, both pesticides were sprayed twice each. Surprisingly, phorate was found in whole citrus fruit pulp, but due to its extreme toxicity to mammals, fish, and birds, it was banned in India in 2021. Also, it is noticed that 13 out of 45 pesticides were detected in edible parts of citrus fruit (without peel) samples. HCH Alpha, Phorate, HCH Beta, Phosphomidon, Chlorpyrifos Methyl, Malathion, Parathion, Chlorpyrifos, 4.4 DDT, Ethion, Cypermethrin, and Permethrin are detected in edible parts of citrus fruit (without peel) samples. Among all pesticides, Ethion (4.755 µg/kg highest in raw sweet lime) has the highest residue in citrus fruits. When it comes to the MRL, all the detected pesticides in edible parts of the citrus fruits are within the MRL limits prescribed by the EU and Codex regulations for MRL in citrus fruits. So, the tested fruits are safe to eat after peeling.
Conflict of Interest
There is no conflict of interest.
Funding Sources
There are no funding sources
References
- FAO, “FAO Statistical Databases and Data Sets; FAO (Food and Agricultural Organization),” Rome, Italy, 2023. https://www.fao.org/food-agriculture-statistics/en/
- J. K. Mani, A. O. Varghese, G. Sreenivasan, and C. S. Jha, “Management of Citrus Orchards in Central India using Geospatial Technology,” in Geospatial Technologies for Resources Planning and Management, C. S. Jha, A. Pandey, V. M. Chowdary, and V. Singh, Eds. Cham: Springer International Publishing, 2022, pp. 297–314. doi: 10.1007/978-3-030-98981-1_13.
CrossRef - Á. Ambrus and Y. Y. Zhen, “Global harmonization of maximum residue limits ( MRLs ) for pesticides,” Journal of Agricultural and Food Chemistry, pp. 1–24, 2015, doi: 10.1021/jf505347z.
CrossRef - G. Kowalska, U. Pankiewicz, and R. Kowalski, “Assessment of Pesticide Content in Apples and Selected Citrus Fruits Subjected to Simple Culinary Processing,” Applied Sciences (Switzerland), vol. 12, no. 3, 2022, doi: 10.3390/app12031417.
CrossRef - Chandrakant S.G., Pesticide Residues Concerns, Regulations and Managment. JAYA Publishing House, New Delhi, 2022.
CrossRef - S. Mandal, R. Poi, I. Ansary, D. K. Hazra, S. Bhattacharyya, and R. Karmakar, “Validation of a modified QuEChERS method to determine multiclass multipesticide residues in apple, banana and guava using GC–MS and LC–MS/MS and its application in real sample analysis,” SN Applied Sciences, vol. 2, no. 2, 2020, doi: 10.1007/s42452-020-1990-2.
CrossRef - R. H. Savant et al., “Multiresidue analysis of 50 pesticides in grape, pomegranate, and mango by gas chromatography-Lon trap mass spectrometry,” Journal of Agricultural and Food Chemistry, vol. 58, no. 3, pp. 1447–1454, 2010, doi: 10.1021/jf903398f.
CrossRef - A. Elmastas, A. Umaz, V. Pirinc, and F. Aydin, “Quantitative determination and removal of pesticide residues in fresh vegetables and fruit products by LC–MS/MS and GC–MS/MS,” Environmental Monitoring and Assessment, vol. 195, no. 2, p. 277, 2023, doi: 10.1007/s10661-022-10910-2.
CrossRef - S. Grimalt and P. Dehouck, “Review of analytical methods for the determination of pesticide residues in grapes,” Journal of Chromatography A, vol. 1433, pp. 1–23, 2016, doi: 10.1016/j.chroma.2015.12.076.
CrossRef - M. Torbati, M. A. Farajzadeh, M. Torbati, A. A. A. Nabil, A. Mohebbi, and M. R. Afshar Mogaddam, “Development of salt and pH–induced solidified floating organic droplets homogeneous liquid–liquid microextraction for extraction of ten pyrethroid insecticides in fresh fruits and fruit juices followed by gas chromatography-mass spectrometry,” Talanta, vol. 176, pp. 565–572, 2018, doi: 10.1016/j.talanta.2017.08.074.
CrossRef - M. I. Cervera, T. Portolés, E. Pitarch, J. Beltrán, and F. Hernández, “Application of gas chromatography time-of-flight mass spectrometry for target and non-target analysis of pesticide residues in fruits and vegetables,” Journal of Chromatography A, vol. 1244, pp. 168–177, 2012, doi: 10.1016/j.chroma.2012.04.063.
CrossRef - R. Húšková, E. Matisová, S. Hrouzková, and Ľ. Švorc, “Analysis of pesticide residues by fast gas chromatography in combination with negative chemical ionization mass spectrometry,” Journal of Chromatography A, vol. 1216, no. 35, pp. 6326–6334, 2009, doi: 10.1016/j.chroma.2009.07.013.
CrossRef - P. P. B. ˜nos and J. ´e L. M. V. Jos ´e Luis Fern ´andez Moreno, A. Garrido Frenich, “Multiresidue method for the analysis of more than 140 pesticide residues in fruits and vegetables by gas chromatography coupled to triple quadrupole mass spectrometry Jos,” Journal of mass spectrometry, vol. 43, pp. 1235–1254, 2008, doi: 10.1002/jms.
CrossRef - A. Suárez-Jacobo et al., “Pesticide residues in orange fruit from citrus orchards in Nuevo Leon State, Mexico,” Food Additives and Contaminants: Part B Surveillance, vol. 10, no. 3, pp. 192–199, 2017, doi: 10.1080/19393210.2017.1315743.
CrossRef - y and W. S. Goranka Crnogorac, Sabrina Schmauder, “Trace analysis of dithiocarbamate fungicide residues on fruits and vegetables by hydrophilic interaction liquid chromatography/tandem mass spectrometry,” Rapid Communications in Mass Spectrometry, vol. 24, pp. 2539–2546, 2008, doi: 10.1002/rcm.
CrossRef - D. Castilla-Fernández, D. Moreno-González, B. Gilbert-López, J. F. García-Reyes, and A. Molina-Díaz, “Worldwide survey of pesticide residues in citrus-flavored soft drinks,” Food Chemistry, vol. 365, no. April, 2021, doi: 10.1016/j.foodchem.2021.130486.
CrossRef - S. Suri, A. Singh, and P. K. Nema, “Current applications of citrus fruit processing waste : A scientific outlook,” Applied Food Research, vol. 2, no. 1, p. 100050, 2022, doi: 10.1016/j.afres.2022.100050.
CrossRef - A. P. S. A. C. (APSAC) and G. of A. P. ITE and C Department, “DISTRICT SURVEY REPORT YSR KADAPA DISTRICT,” 2022.
- R. Ramadevi, C. Ramachandraiah, and G. V. S. Reddy, “Development of a Multi-Residue Method for 11 Multiclass pesticides in a Sweet Lime Orchard soil Near Pulivendula using GC-MS/MS with QuEChERS Extraction,” European chemicalbulleten, vol. 12, no. 3, pp. 790–803, 2023, doi: 10.31838/ecb/2023.12.3.0582023.30/04/2023.
CrossRef - D. Ortelli, P. Edder, and C. Corvi, “Pesticide residues survey in citrus fruits,” Food Additives and Contaminants, vol. 22, no. 5, pp. 423–428, 2005, doi: 10.1080/02652030500089903.
CrossRef - L. Drábová et al., “Assessment of pesticide residues in citrus fruit on the Czech market,” Food Additives & Contaminants: Part A, vol. 39, no. 2, pp. 311–319, Feb. 2022, doi: 10.1080/19440049.2021.2001579.
CrossRef - F. M. Al-nasir et al., “Determination of pesticide residues in selected citrus fruits and vegetables cultivated in the Jordan Valley,” LWT – Food Science and Technology, p. 109005, 2019, doi: 10.1016/j.lwt.2019.109005.
CrossRef - E. Calvaruso et al., “Residues of 165 pesticides in citrus fruits using LC-MS/MS: a study of the pesticides distribution from the peel to the pulp,” Natural Product Research, vol. 34, no. 1, pp. 34–38, 2020, doi: 10.1080/14786419.2018.1561682.
CrossRef - N. Besil, V. Cesio, H. Heinzen, and A. R. Fernandez-Alba, “Matrix Effects and Interferences of Different Citrus Fruit Coextractives in Pesticide Residue Analysis Using Ultrahigh-Performance Liquid Chromatography-High-Resolution Mass Spectrometry,” Journal of Agricultural and Food Chemistry, vol. 65, no. 23, pp. 4819–4829, 2017, doi: 10.1021/acs.jafc.7b00243.
CrossRef - J. K. Mani et al., “Journal of AOAC International,” vol. 11, no. 2, pp. 1–23, 2022, doi: 10.1007/978-3-030-98981-1_13.
CrossRef

This work is licensed under a Creative Commons Attribution 4.0 International License.
About The Author
![]()
A New Edition of Web of Science
Journal Impact Factor
2022: 0.5
Five Year: 0.8
Journal is Indexed in

Cabells Whitelist
![]()


