Analytical Method Development and Validation of Quetiapine Fumarate in Api and Dosage form by Using Rp – Hplc
Siva Sanker Reddy Lingareddygari* , Nageswara Rao Ravikrindhi, Madana Gopal Nookala, Shaik Muneer, Prasad Nakka
Department of Pharmaceutical Analysis, Santhiram College of Pharmacy, Panyam, Nandyal, Andhra Pradesh, India.
Corresponding Author E-mail: shiva_s_rl@yahoo.co.in
DOI : http://dx.doi.org/10.13005/ojc/390430
Download this article as:
![]()
RP-HPLC method developed is a simple, precise and functional technique for the calculation of amount of Quetiapine fumarate from marketed tablets and bulk form. The RP-HPLC analysis was carried out on Hyper chrome ODS-BP 5µm column (4.6mm × 200mm) using a mobile phase 0.1% Orthophoshoric acid and Acetonitrile (80:20v/v) with pH 5.5. Quetiapine fumarate quantified by using UV detector at 210nm. The retention time of the Quetiapine fumarate was found to be 2.6 min. The linearity of the drug concentration ranges from 20-400µg/ml. The detection and quantification limits were intended at 3.70µg/ml and 12.35µg/ml. The precision, accuracy, specificity, robustness and degradation studies were validated.
KEYWORDS:Acetonitrile; 0.1% Orthophoshoric acid; Quetiapine fumarate; RP-HPLC; Validation
Introdcution
Quetiapine Fumarate is an Anti-psychotic agent and Anti depressive agent. It is designated chemically as a 2-[2-(4-Dibenzo [b, f] [1, 4] thiazepin-11-yl-1- piperazinyl) ethoxy] ethanol. The drug’s solubility is in methanol, Ethanol, Water and higher soluble under acidic condition with pKa value- 15.12 and 7.02 strongly basic PKa, half-life 6 hours, protein binding-83%, route of administration is oral, metabolism in liver and excretion by kidneys. The entire work was planned according to the ICH guidelines1. HPLC methods were reported in various journals- assay method2, stability indicating method3, isocratic method4, and other RP-HPLC methods were taken into consideration for this study5- 12. Many UV methods also exist for the estimation of Quetiapine,which one is referred in this context13.
Methodology
Preparation of standard solution for system suitability
Accurately weighed 10 mg of Quetiapine, transferred into volumetric flask of 10 ml capacity and required quantity of mobile phase (0.1% OPA: ACN 80:20v/v) used to make up to the mark. The solution sonicated to be affirmative that the drug was dissolved. This solution was marked as the stock solution. Further, pipetted out 2ml from the stock solution into a volumetric flask of 10ml capacity and addition of mobile phase till the mark, cyclomixer was used to make sure that the drug dissolved completely, filtered through the 0.45µm Polytetrafluoroethylene membrane filters. The final concentration was 200μg/ml.
In system suitability, 6 optimized concentrations were
prepared, injected and noted the peak responses. Finally noted the areas,
retention time, and theoretical plates of the all injections and compared with
the limits.
Preparation of blank solution or Mobile phase
The preparation of mobile phase mainly consisted of two steps- firstly, 0.1ml of orthophosphoric acid was taken by using 1ml of calibrated pipette and dissolved in 100 ml of HPLC water and secondly, the mobile phase was prepared by using 0.1% Orthophosphoric acid and Acetonitrile in the ratio of 80:20 v/v into calibrated volumetric flask, the pH was adjusted to 5.5 by using dilute sodium hydroxide solution.
Preparation of standard solution
The preparation of standard solution also discussed on system suitability parameter. Six optimized concentrations were prepared, injected and noted the peak responses.
Sample solution preparation
Weighed 10 Quetiapine tablets and then calculated the average weight of each tablet. Accurately, weighed tablet powder obtained from the crushed tablets, equivalent to 10mg (20.8mg) was emptied into volumetric flask(10 ml) and made up to the mark with the aid of mobile phase. Mixed well and then sonicated for dissolution and filtered it through 0.45µm filter. Six optimized concentrations were prepared, injected and noted the peak responses.
Preparation of linearity concentrations
From the stock solution pipetted out 0.2ml (20µg/ml), 1.1ml (110µg/ml), 2ml (200µg/ml), 3ml (300µg/ml), 4ml (400µg/ml) were transferred into 10 ml of different volumetric flasks and mobile phase added up to the mark of volumetric flask. These concentrations were filtered through 0.45µl filter. Into the chromatographic instrument, injected each concentration and then measured the peak area. A graph was plotted with peak areas on X-axis and concentration on Y-axis. The correlation coefficient was calculated.
Intra – day precision
From the stock solution 6 optimized concentrations (200µg/ml) were prepared and these optimized concentrations were injected the solutions for six times and measured the areas for all injections. From these replicate injections measured the %RSD and it was found to be within the specified limit % RSD< 2%.These replicates were injected within a day, like morning, afternoon and evening.
Inter – day precision
For the evaluation of the inter–day precision were injected on three different days Every day 6 optimize concentrations were freshly prepared and the %RSD was compared less than 2
Preparation of 50%, 100%, 150% solutions for accuracy
From the sample solution pipetted out 1ml (50%) 100µg/ml, 2ml (100%) 200µg/ml, 3ml (150%) 300µg/ml into different 10 ml of volumetric flask and addition of mobile phase up to the mark was carried out. Thoroughly shaken using cyclomixer, passed through the 0.45 micron filter.
Preparation of LOD solution (3.70µg/ml)
The 100% concentration of sample solution preparation was already discussed in the subtitle accuracy parameter. From the 100µg/ml solution pipetted out 0.037ml into volumetric flask (10 ml) and then diluted(with mobile phase) as usual to the required mark. Shaken vigorously to dissolve, then made to pass through the 0.45 micron filter, injected and checked the detection limit.
Preparation of LOQ solution (12.35µg/ml)
From the 100µg/ml of sample solution, pipetted out 1.23ml transfered into 10ml of volumetric flask and mitigated with the mobile phase to required mark. Mixed well then allowed to pass through the 0.45 micron filter, injected and checked the quantitation limit.
Robustness
Robustness was conducted on different flow rates, different wave lengths and different ratio composition of mobile phase. The optimized concentration of sample (200µg/ml) was prepared and analyzed by using the varied flow rates, like 0.6ml/min, 0.8ml/min and 1ml/min, different wavelengths 208nm, 210nm and 212nm and different mobile phase composition. The flow rate varied ±2 to normal flow rate and also wavelengths ±2, mobile phase composition ratios were ±10. When compared with normal conditions. In robustness % assay calculated between the ranges of 98-102%.
Results and Discussion
Establishment of wave length
A solution of Quetiapine (200μg/ml) was used to know the λmax. 0.1% OPA: ACN 80:20 v/v was used as diluents. The λmax was at 210 nm and was used in the entire project work.
 |
Figure 1: Uv Spectrum Click here to View Figure |
 |
Figure 2: Blank Chromatogram |
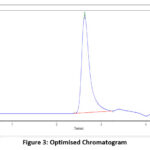 |
Figure 3: Optimised Chromatogram |
Analytical Method Validation
Table 1: System suitability
|
S. No |
Standard area |
Theoretical plates |
Tailing factor |
|
1 |
5786394 |
3700 |
1.71 |
|
2 |
5750574 |
3787 |
1.73 |
|
3 |
5792625 |
3767 |
1.74 |
|
4 |
5703694 |
3752 |
1.72 |
|
5 |
5698380 |
3765 |
1.74 |
|
6 |
5680105 |
3764 |
1.71 |
|
Average |
5735329 |
3756 |
1.73 |
|
Standard deviation |
48086 |
29.59 |
0.01 |
|
%RSD |
0.838 |
0.788 |
0.799 |
Table 2: Linearity
|
S. No |
Concentration(µg /ml) |
Area of the peak |
|
1 |
20 |
1055037 |
|
2 |
110 |
3395819 |
|
3 |
200 |
5684881 |
|
4 |
300 |
8488555 |
|
5 |
400 |
11090213 |
 |
Figure 4: Linearity of Quetiapine |
Table 3: Inter – day precision
|
S. No |
Sample weight |
Sample peak area |
% Assay |
|
1 |
20.8 mg |
5671040 |
98.88 |
|
2 |
20.8 mg |
5743372 |
100.14 |
|
3 |
20.8 mg |
5681301 |
99.06 |
|
4 |
20.8 mg |
5693297 |
99.27 |
|
5 |
20.8 mg |
5722491 |
99.78 |
|
6 |
20.8 mg |
5678031 |
99.00 |
|
Average |
5698255 |
99.35 |
|
|
Standard deviation |
28582 |
0.50 |
|
|
% RSD |
0.502 |
0.50 |
|
Table 4: Intra – day precision
|
S. No |
Sample weight |
Sample peak area |
% Assay |
|
1 |
20.8 mg |
5771040 |
100.62 |
|
2 |
20.8 mg |
5693372 |
99.27 |
|
3 |
20.8 mg |
5681301 |
99.06 |
|
4 |
20.8 mg |
5683297 |
99.09 |
|
5 |
20.8 mg |
5682491 |
99.08 |
|
6 |
20.8 mg |
5678031 |
99.00 |
|
Average |
5698255 |
99.35 |
|
|
Standard deviation |
36028 |
0.63 |
|
|
% RSD |
0.632 |
0.63 |
|
Table 5: Accuracy
|
S.No |
Spiked level (%) |
Sample weight(mg) |
Sample area |
μg/ml added |
μg/ml found |
% recovery |
% mean recovery |
|
1 |
50 |
10.4 |
2871543 |
99.18 |
100.14 |
100.97 |
99.33 |
|
2 |
50 |
2873096 |
99.18 |
101.19 |
101.02 |
||
|
3 |
50 |
2876831 |
99.18 |
100.32 |
101.15 |
||
|
4 |
100 |
20.8 |
5667890 |
198.35 |
197.65 |
99.64 |
100.47 |
|
5 |
100 |
5787744 |
198.35 |
201.83 |
101.75 |
||
|
6 |
100 |
5688744 |
198.35 |
198.38 |
100.01 |
||
|
7 |
150 |
31.2 |
8529045 |
297.53 |
297.42 |
99.96 |
|
|
8 |
150 |
8599960 |
297.53 |
299.89 |
100.79 |
99.79 |
|
|
9 |
150 |
8548159 |
297.53 |
298.09 |
100.19 |
|
Table 6: Robustness
|
S. No |
Flow rate (ml/min) |
Peak area |
% Assay |
|
1 |
0.6 |
5696523 |
99.32 |
|
2 |
0.8 |
5699834 |
99.38 |
|
3 |
1 |
5708485 |
99.53 |
|
|
Wave length (nm) |
|
|
|
1 |
208 |
5698030 |
99.35 |
|
2 |
210 |
5688031 |
99.18 |
|
3 |
212 |
5700030 |
99.38 |
 |
Figure 5: LOD Chromatogram |
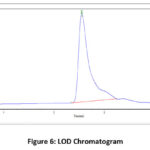 |
Figure 6: LOD Chromatogram. |
Table 7: Degradation studies or Stability studies (Dosage form).
|
S. No |
Component added to degrade the sample |
Weight of the sample |
Sample area |
% Assay |
% of Degradation |
|
1 |
Acid |
20.8mg |
4707340 |
82.08 |
17.92 |
|
2 |
Base |
4975858 |
86.76 |
13.24 |
|
|
3 |
Hydrogen Peroxide |
4304962 |
75.06 |
24.94 |
|
|
4 |
Heat |
4715977 |
82.23 |
17.77 |
|
|
5 |
UV light |
4863820 |
84.80 |
15.20 |
Summary
Precise, specific, more rapid, subtle, financial and reproducible, isocratic reverse phase HPLC method developed and validated for quantitative determination of Quetiapine in pharmaceutical dosage form and in API. The HPLC method was validated for linearity, accuracy, specificity, precision, range, LOD and LOQ, Rugged and Robustness as per ICH guidelines. Stability studies were also performed to determination the stability time period of test and standard solutions.
In HPLC developed method less and simple mobile phase composition with 0.1% OPA: ACN in the ratio of 80:20v/v and pH adjusted to 5.5 with retention time 2.6. All replicates were analyzed and detected at 210nm with UV-detector. The method was found to be linearity concentration range from 20µg/ml to 400µg/ml. The correlation coefficient was found to be 0.999. The accuracy of method was performed at 50%, 100%, 150% to analyte concentration and %recovery was found to be 99.33%, 100.47%, 99.79% respectively. The range of the method was performed at lower and higher concentration from accuracy studies and obtained results represents the developed HPLC method was precise and accurate. System suitability parameters were performed when deliberate experimental changes like mobile phase flow rate, buffer pH, mobile phase composition to the selected method and obtained results were well accepted with accepted criteria. The results LOD and LOQ were found to be 3.70µg/ml and 12.35µg/ml respectively. In degradation studies the method was able to detect the drug and was within the prescribed limits, without any inference of degradants.
Conclusion
Thus the proposed analytical method was simple, selective, rapid, precise, accurate, and financially feasible. The established analytical RP-HPLC technique was robust, rugged, and well-organized and represents specific procedure for quantitative determination of Quetiapine in bulk as well as in pharmaceutical dosage form. RP- HPLC method was successfully applicable for regular analysis of Quetiapine in quality control laboratories by following ICH guidelines. The developed method has advantage of short analysis time; cheaper solvents as well as less toxic solvents were used as mobile phase. The method also has wide concentration range to quantify.
Acknowledgment
The authors are thankful to Principal and management of Santhiram college of Pharmacy for the utilization of facilities. This work is not sponsored by any government or non government bodies/institutions and is self financed.
Conflict of interest
The authors have no conflict of interest.
References
- International Conference on Harmonisation of Technical Requirements for Registration of Pharmaceuticals for Human Use. ICH Harmonised Tripartite Guideline, Validation of Analytical Procedures: Text and Methodology Q2 (R1), Complementary Guideline on Methodology, London, 2005.
- Nikita, G.; Archana, D.; Dubey P.K. Development and validation of assay method for determination of quetiapine fumarate by RP-HPLC from bulk and pharmaceutical dosage form. Int. J. Pharmaceutical Sciences & Medicine, 2022, 7(10), 65-96.
CrossRef - Talele, S. G; Derle, D. V. Stability-indicating high-performance liquid chromatography (HPLC) method development and validation for the determination of quetiapine fumarate in bulk and dosage form by HPLC. Int. J. Green .Pharmacy, 2018 (Suppl), 12 (1), S188-S193.
- Rajendraprasad, N.; Basavaiah, K.; Anil Kumar, U. R. Isocratic ultra-performance liquid chromatographic assay of quetiapine fumarate in pharmaceuticals. Tha.i J. Pharm Sciences. 2017, 41 (1), 6-11.
- Chandra, R.; Ashwani, S.; Deepak. K. Augustin, K.B. “Development and validation a RP-HPLC method: Application for the quantitative determination of quetiapine fumarate from marketed bulk tablets”, J. Chem. Pharm. Res. 2016, 8(1), 142-146.
- Nagaraju, P. Development and validation of RP-HPLC method for estimation of Quetiapine fumarate in Pharmaceutical formulations. Pharm Methods, 2015, 6(2), 105-108.
CrossRef - Kiran B. V.;Sreenivas R. B.; Somshankar D. Validation of Quetiapine Fumarate in Pharmaceutical Dosage by Reverse-Phase HPLC with Internal Standard Method. J. Chemistry.2013, 2013, 1-9.
CrossRef - Paulo, C. R.; Iury, F. R. P.; Markman, B. E. O.; Perazzo, F.F. Development and Validation of RP-HPLC Method for the determination of related compounds in Quetiapine hemifumarate raw material and tablets. J. Applied. Pharm..Science. 2013, 3 (08), 6-15.
- Pramod, L. I.; Sampada, D. D.; Sachin, V. G.; Laxmileena, D. P.; Deepali, D. J.; Yogita, A. K. Development of analytical method for determination of quetiapine fumarate in bulk & tablet dosage form. Der. Pharm. Chemica, 2013, 5(5), 26-30.
- Pragati, T.; Sivasubramanian,L. Stability indicating RP-HPLC method for the estimation of quetiapine fumarate in bulk and tablet dosage form. Int J Pharm Pharm Sci, 2013, 5, (Suppl 4), 269-272.
- Rakshit, K.T, Mukesh C. P. Development and validation of a stability indicating RP-UPLC method for determination of quetiapine in pharmaceutical dosage form. Sci .Pharm. 2011, 79(1), 97–111.
CrossRef - Korrapolu, S.; Bollineni, S.; Nalluri, B.N. Stability indicating RP-HPLC-PDA method for the estimation of quetiapine fumarate in bulk and pharmaceutical dosage forms. J Chem Pharm Res. 2012, 4(8), 3877-3884.
- Bagade, S. B.; Narkhede, S.P;. Nikam, D. S.; Sachde. C. K. Development and validation of UV-Spectrophotometric method for determination of Quetiapine fumarate in two different dose tablets, International Journal of ChemTech Research. 2009, 1, (4), 898-904.
Accepted on: 20 Jul 2023
Second Review by: Dr. Sheta Biswas
Final Approval by: Dr Ho Soon Min


![]()


