Prediction of Urease Inhibition Activity of 1,2,4-Triazole Congeners by 2D QSAR Analysis
Rinky Chawla and Surya Prakash Gupta*
Rajiv Gandhi Institute of Pharmacy, Faculty of Pharmaceutical Science and Technology, AKS University, Satna (MP)-India.
Corresponding Author E-mail: suryatony@yahoo.co.in
DOI : http://dx.doi.org/10.13005/ojc/390317
Article Received on : 14 Apr 2023
Article Accepted on : 18 Jun 2023
Article Published : 01 Jul 2023
Reviewed by: Dr. Mohanad Al-Hachamii
Second Review by: Dr. Ravish Kumar
Final Approval by: Dr. Tawkir Sheikh
The objective of the present investigation was to obtain a QSAR model to predict the antiurease activity of a series of 1,2,4-triazole congeners with reported IC50 values in order to design new and better congeners. The calculation of descriptors was done using CDK package and the correlation matrix was developed using all the descriptors. All the variables were subjected to blind simulation in order to select the independent variables with least inter-correlation and high correlation with the anti-urease action. A total of 14 descriptors were finalized for QSAR model generation using Ezqsar. The MLR method was used to obtain the equation and fit of the equation to predict the anti-urease activity of the congeneric compounds. The QSAR model generated for the series was presented 14 independent variables affecting the urease inhibition action.With a regression coefficient of 0.9976 (R2), the created model was determined to have strong predictive power.
KEYWORDS:Polarizability; QSAR; SMILES; Taft steric parameter; 1,2,4-triazole; Urease
Download this article as:| Copy the following to cite this article: Chawla R, Gupta S. P. Prediction of Urease Inhibition Activity of 1,2,4-Triazole Congeners by 2D QSAR Analysis. Orient J Chem 2023;39(3). |
| Copy the following to cite this URL: Chawla R, Gupta S. P. Prediction of Urease Inhibition Activity of 1,2,4-Triazole Congeners by 2D QSAR Analysis. Orient J Chem 2023;39(3). Available from: https://bit.ly/3XwBzN3 |
Introduction
Designing drugs with improved properties and diminished side-effects, and assessing the safety issues of the chemicals is a contemporary area of research from health and environment point of view. Reducing the time and resources are the major objectives of the modern drug discovery process. The information and management of bio- and chemical-information have become the integral part. In this context, in-silico approaches based on computational chemistry and biology have been widely used to reduce the time and cost involved in the drug discovery.1
One of the most alluring substances in drug discovery is triazole. Due to its electron-rich characteristics and the existence of an unsaturated hydrocarbon ring structure, this nucleus exhibits remarkable stability and extremely high pharmacological efficacy.2,3 These characteristics encourage hydrogen bonding interactions with diverse receptors (enzymes), giving them powerful pharmacological effects. Triazole derivatives are being utilised to treat a wide range of illnesses. Pharmaceuticals include trazodone to treat depression, posaconazole, and propiconazole as antifungal medications, as well as anastrozole and letrozole as examples to treat breast cancer by inhibiting aromatase activity. Propiconazole’s antifungal properties are based on its ability to suppress early stages of steroid propioconazole production, specifically those that are catalysed by lanosterol 14a-demethylase (CYP51). However, the antifungal spectrum of these medications is constrained, and they are frequently linked to hepatotoxicity.
In general, any compound’sstructure has a significant impact on its biological function. Quantitative structure-activity relationship (QSAR) modelling is one method that is frequently used to achieve these goals. It aims to establish a reliable link between changes in the values of a compound’s molecular characteristics and its biological activity.4-6To optimise the structure that provides the desired biological activities, models of QSAR are crucial.7-12
In order to establish their structure-activity connections and anticipate new derivatives as prototypes for prospective medications, it was therefore intended to explore a number of triazole congeners with urease activity.
Material and Methods
The Workstation
In the present investigation a Intel core 3 system equipped with Ezqsar software, ChemDraw Ultra 8.0, Chemistry Development Kit (CDK) library software and Microsoft office software package was used.
Selection of series for QSAR
Ureases are enzymes that belong to the group of urea amidohydrolases and have two nickel (II) atoms in them. The main sources of ureases include plants, algae, fungus, and bacteria. Numerous illnesses, including pyelonephritis, hepatic coma, peptic ulceration, urinary stones, and stomach cancer, are brought on by bacterial ureases. Researchers are interested in 1,2,4-triazole because of its wide range of biological activity (Figure 1) including its ability to treat migraines and be antiviral, anticancer, anti-inflammatory, antibacterial, and anti-urease.13Hence a series of 1,2,4-triazole compounds with antiurease activity (Table 1)14was selected for performing the QSAR analysis to design new molecules with potential activity against several diseases.
 |
Table 1: Series of 1,2,4-triazole with urease inhibition potential selected for QSAR. |
Descriptor generation
Topological, constitutional, electronic, geometric and hybrid descriptors were generated CDK package using the SMILES notation and the correlation matrix was developed using all the descriptors.
QSAR Study of the selected series of compounds
Out of the 20 compounds of the series, only compounds 1-16 were selected for QSAR study owing to lack of appropriate descriptor generation in the remaining compounds. The independent variables (descriptors) and the dependent variable (IC50) were subjected to multiple linear regression analysis using Blind Simulation Technique (without comprehensive understanding of the underlying probability law, we must estimate the likelihood of an event.).15
The generated model was cross validated using the LOO method to obtain the best fitting model for predicting the antiurease activity of the 1,2,4-triazole congeners.
Results
The chemical structures and the SMILES notation of the compounds were edited and obtained from the editing software ChemDraw Ultra. The correlation matrix was developed using all the descriptors. The correlation matrix depicts the inter-correlation between the independent variables as well as the correlation of the various independent variables with the dependent variables. All the variables were subjected to blind simulation in order to select the independent variables with least inter-correlation and high correlation with the anti-urease action.
Using blind simulation method, 14 descriptors were finalized for QSAR model generation using Ezqsar.16The MLR method was used to obtain the equation and fit of the equation to predict the anti-urease activity of the congeneric compounds. The data set used for MLR is presented in Table 2 while the correlation matrix of the selected variables is presented in Table 3.
Table 2: Dataset for MLR
|
Compounds |
Y1 |
X22 |
X24 |
X25 |
X26 |
X27 |
X36 |
X37 |
X38 |
X39 |
X40 |
X41 |
X42 |
X43 |
X44 |
|
|
4,450 |
0.285 |
0.003 |
0.061 |
0.013 |
0.087 |
0.038 |
0.017 |
0.256 |
0.012 |
0.013 |
0.025 |
1.132 |
1,210 |
1,236 |
|
|
4,460 |
0.156 |
0.016 |
0.061 |
0.013 |
0.017 |
0 |
0.016 |
0.226 |
0.018 |
0.021 |
0.041 |
1,095 |
1.188 |
1,207 |
|
|
4,420 |
0.294 |
-0.003 |
0.046 |
0.001 |
-0.096 |
0.009 |
-0.017 |
0.217 |
0.028 |
0.027 |
0.04 |
1.146 |
1,220 |
1,197 |
|
|
4,400 |
0.051 |
0.019 |
0.061 |
0.121 |
0.046 |
0.004 |
0.085 |
0.163 |
0.005 |
0.053 |
0.015 |
1,011 |
1,242 |
1.122 |
|
|
4,340 |
0.001 |
0.088 |
0.087 |
0.07 |
0.048 |
0.058 |
-0.116 |
0.123 |
0 |
0.069 |
0.023 |
0.882 |
1,256 |
1,071 |
|
|
4,410 |
0.096 |
0.032 |
0.024 |
0.129 |
0.035 |
0.025 |
-0.036 |
0.209 |
0.018 |
0.039 |
0.005 |
0.998 |
1210 |
1,171 |
|
|
4,440 |
0.188 |
0.041 |
0.03 |
0.004 |
0.19 |
0.064 |
0 |
0.258 |
0.022 |
0.026 |
0.033 |
1,237 |
1.193 |
1,230 |
|
|
4,450 |
0.188 |
0.022 |
0.024 |
0.068 |
0.032 |
0.034 |
0 |
0.258 |
0.022 |
0.019 |
0.024 |
1,100 |
1,193 |
1,230 |
|
|
4,360 |
0.186 |
0.017 |
0.033 |
0.068 |
0 |
0.001 |
0.111 |
0.135 |
0.036 |
0.029 |
0.013 |
1.118 |
1,251 |
1.136 |
|
|
4,340 |
0.213 |
0.003 |
0.007 |
0.064 |
0.047 |
0.052 |
0.016 |
0.252 |
0.008 |
0.006 |
0.017 |
0.878 |
1.157 |
1,180 |
|
|
4,400 |
0.213 |
0.023 |
0.034 |
0.064 |
0.027 |
0.008 |
-0.016 |
0.252 |
0.008 |
0.012 |
0.031 |
0.928 |
1,157 |
1.18 |
|
|
4,430 |
0.174 |
0.127 |
0.031 |
0.067 |
0.206 |
0.017 |
0.015 |
0.247 |
0.002 |
0.017 |
0.025 |
0.968 |
1,108 |
1.128 |
|
|
4,420 |
0.25 |
0.002 |
0.005 |
0.067 |
-0.061 |
0.089 |
0.014 |
0.238 |
-0.001 |
0.006 |
0.001 |
0.78 |
1,130 |
1,152 |
|
|
4,310 |
0.254 |
0.018 |
0.037 |
0.092 |
0.07 |
0.083 |
0.045 |
0.244 |
0.048 |
0.041 |
0.033 |
1.106 |
1,186 |
1,224 |
|
|
4,380 |
0.254 |
-0.026 |
0.01 |
0.097 |
0.085 |
0.028 |
0.045 |
0.244 |
0.039 |
0.044 |
0.013 |
0.586 |
1,186 |
1,224 |
The variable Y1 represents the dependent variable (IC50) while X22, X24, X25, X26, X27, X36, X37, X38, X39, X40, X 41, X42, X43 and X44 are the independent variables coded for Hydrogen bonding capacities, Molecular polarizabilities, Daylight, MDL keys, UNITY, Parachor, Taft steric parameter, HOMO and LUMO energies, Orbital electron densities, Superdelocalizabilities, Atom-atom polarizabilities, Molecular polarizabilites, Dipole moments and polarity indices and Energies respectively
Table 3: Correlation matrix of the selected descriptors
|
|
X22 |
X24 |
X25 |
X26 |
X27 |
X36 |
X37 |
X38 |
X39 |
X40 |
X41 |
X42 |
X43 |
X44 |
|
X22 |
1 |
0.294 |
0.34 |
0.457 |
0.286 |
0.27 |
0.702 |
0.682 |
0.463 |
0.611 |
0.166 |
0.245 |
0.426 |
0.716 |
|
X24 |
0.294 |
1 |
0.303 |
0.114 |
0.477 |
0.092 |
0.221 |
0.125 |
0.455 |
0.115 |
0.268 |
0.151 |
0.239 |
0.483 |
|
X25 |
0.34 |
0.303 |
1 |
0.162 |
0.463 |
0.351 |
0.486 |
0.529 |
0.177 |
0.353 |
0.149 |
0.064 |
0.614 |
0.267 |
|
X26 |
0.457 |
0.114 |
0.162 |
1 |
0.189 |
0.156 |
0.144 |
0.29 |
0.023 |
0.362 |
0.551 |
0.508 |
0.012 |
0.408 |
|
X27 |
0.286 |
0.477 |
0.463 |
0.189 |
1 |
0.43 |
0.196 |
0.404 |
0.081 |
0.312 |
0.086 |
0.175 |
0.231 |
0.041 |
|
X36 |
0.27 |
0.092 |
0.351 |
0.153 |
0.43 |
1 |
0.486 |
0.361 |
0.645 |
0.199 |
0.323 |
0.816 |
0.106 |
0.648 |
|
X37 |
0.702 |
0.221 |
0.486 |
0.144 |
0.196 |
0.486 |
1 |
0.866 |
0.489 |
0.315 |
0.321 |
0.177 |
0.576 |
0.812 |
|
X38 |
0.682 |
0.125 |
0.529 |
0.29 |
0.404 |
0.361 |
0.866 |
1 |
0.122 |
0.641 |
0.39 |
0.126 |
0.733 |
0.774 |
|
X39 |
0.463 |
0.455 |
0.177 |
0.023 |
0.081 |
0.3645 |
0.489 |
0.122 |
1 |
0.236 |
0.04 |
0.578 |
0.252 |
0.6 |
|
X40 |
0.611 |
0.115 |
0.353 |
0.362 |
0.3612 |
0.199 |
0.315 |
0.641 |
0.236 |
1 |
0.043 |
0.135 |
0.701 |
0.336 |
|
X41 |
0.166 |
0.268 |
0.149 |
0.551 |
0.086 |
0.323 |
0.321 |
0.39 |
0.04 |
0.046 |
1 |
0.344 |
0.144 |
0.342 |
|
X42 |
0.245 |
0.151 |
0.064 |
0.508 |
0.175 |
0.816 |
0.177 |
0.126 |
0.248 |
0.135 |
0.344 |
1 |
0.388 |
0.57 |
|
X43 |
0.426 |
0.239 |
0.614 |
0.012 |
0.231 |
0.106 |
0.576 |
0.733 |
0.252 |
0.701 |
0.144 |
0.388 |
1 |
0.198 |
|
X44 |
0.716 |
0.483 |
0.267 |
0.408 |
0.041 |
0.648 |
0.812 |
0.774 |
0.6 |
0.336 |
0.342 |
0.57 |
0.198 |
1 |
The QSAR model generated for the series was Y1 = – 0.4774 (± 2.1577) X22 – 0.0508 (± 3.5947) X24 – 1.9975 (± 3.6127) X25 – 0.2072 (± 5.2926) X26 + 0.3986 (± 2.1048) X27 + 0.4511 (± 5.0172) X36 + 4.0973 (± 11.3330) X37 – 1.5179 (± 11.7555) X38 + 0.2627 (± 15.8665) X39 + 5.4838 (± 26.9774) X40 – 2.3725 (± 6.2801) X41 + 0.7132 (± 2.1632) X42 + 2.4254 (± 14.1013) X43 – 3.6584 (± 10.4779) X44 + 5.1057 (± 10.6776)
The coefficient analysis values are presented in Table 4& Figure 2.
Table 4: Coefficient analysis values for the QSAR model
|
|
Coef. |
Stdev |
95% Conf. |
t-ratio |
P |
|
Constant |
5.1057 |
0.8404 |
10.6776 |
6.0757 |
0.0260 |
|
X22 |
-0.4774 |
0.1698 |
2.1577 |
-2.8113 |
0.1067 |
|
X24 |
-0.0508 |
0.2829 |
3.5947 |
-0.1795 |
0.874 1 |
|
X25 |
-1.9975 |
0.2843 |
3.6127 |
-7.0252 |
0.0197 |
|
X26 |
-0.2072 |
0.4165 |
5.2923 |
-0.4975 |
0.6682 |
|
X27 |
0.3986 |
0.1657 |
2.1048 |
2.4061 |
0.1379 |
|
X36 |
-0.4511 |
0.3949 |
5.0172 |
1.1423 |
0.3716 |
|
X37 |
4.0973 |
0.8919 |
11.333 |
4.5937 |
0.0443 |
|
X38 |
-1.5179 |
0.9252 |
11.7555 |
-1.6406 |
0.2426 |
|
X39 |
0.2627 |
1.2437 |
15.8665 |
0.2104 |
0.8529 |
|
X40 |
5.4838 |
2. 1232 |
26.9n4 |
2.5828 |
0.1229 |
|
X41 |
-2.3725 |
0.4943 |
6.2801 |
-48,002 |
0.0408 |
|
X42 |
0.7132 |
0.1703 |
2. 1632 |
4. 1892 |
0.0525 |
|
X43 |
2.4254 |
1.1098 |
141,013 |
2.1854 |
0.1604 |
|
X44 |
-3.6584 |
0.8246 |
10.4779 |
-4.4.364 |
0.0472 |
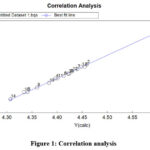 |
Figure 1: Correlation analysis. |
The validation of the predictive ability of the model was performed using the LOO method and the residual values are presented in the Table5.
Table 5: Residual analysis values for the predictive ability of the QSAR model
|
Residual Table No. |
Compounds |
Y (obs) |
Y (calc) |
Y (res) |
StDev. Res |
|
1 |
|
4.45 |
4.448 |
0.002 |
0.199 |
|
2 |
|
4.46 |
4.459 |
0.001 |
0.055 |
|
3 |
|
4.42 |
4.424 |
-0.004 |
-0.307 |
|
4 |
|
4.4 |
4.397 |
0.003 |
0.269 |
|
5 |
|
4.34 |
4.341 |
-0.001 |
-0.075 |
|
6 |
|
4.41 |
4.413 |
-0.003 |
-0.226 |
|
7 |
|
4.44 |
4.44 |
0 |
-0.006 |
|
8 |
|
4.45 |
4.455 |
-0.005 |
-0.392 |
|
9 |
|
4.36 |
4.36 |
0 |
0.033 |
|
10 |
|
4.34 |
4.334 |
0.006 |
0.465 |
|
11 |
|
4.4 |
4.401 |
-0.001 |
-0.089 |
|
12 |
|
4.43 |
4.43 |
0 |
-0.039 |
|
13 |
|
4.42 |
4.422 |
-0.002 |
-0.192 |
|
14 |
|
4.31 |
4.307 |
0.003 |
0.228 |
|
15 |
|
4.38 |
4.384 |
-0.004 |
-0.319 |
|
16 |
|
4.6 |
4.595 |
0.005 |
0.365 |
|
Analysis of variance |
|||||
|
Source |
DF |
SS |
MS |
F |
P |
|
Regression |
14 |
0.0664 |
0.0047 |
30.297 |
0.1416 |
|
Error |
1 |
0.0002 |
0.0002 |
|
|
|
Total |
15 |
0.0665 |
|
|
|
The regression analysis parameters of the model were obtained to determine the fitting of the model in predicting the anti-urease action (Table6).
Table 6: MLR results
|
Property |
Value |
|
n |
16 |
|
k |
14 |
|
R2 |
0.9976 |
|
R2-Adj. |
0.9647 |
|
s |
0.0125 |
|
F |
30.297 |
|
p |
0.1416 |
|
Q2 |
-75.3805 |
|
Spress |
2.2545 |
|
SDEP |
0.5821 |
|
C.V. |
0.2835 |
The QSAR model suggested that the variables X27, X36, X37, X39, X40, X42 and X43 correlated positively with IC50 while X22, X24, X25, X26, X38, X 41 and X44 correlated negatively with IC50.With a regression coefficient of 0.9976 (R2), the created model was determined to have strong predictive power.
Discussion
QSAR studies are intended for predicting the effect of the properties of molecules on the biological action. The properties of molecules are affected by the presence of substitution on the nucleus. The electronic, steric, physicochemical and quantam chemical properties play a vital role in interaction of the molecule with the receptor and also in stabilizing the drug receptor complex. QSAR models present a means to predict the biological action of molecules by varying the substitutions and obtain rational to create better molecules. A QSAR models suggests that some properties correlate negatively suggesting that these properties might present a negative effect on the biological activity of the molecule whereas a positive correlation suggest improved biological activity.17
The results obtained from the QSAR study led to a model with good prediction ability. The best fit model with a R2 value of 0.9976 revealed that while most of the quantum chemical properties of the molecule correlated negatively with biological action, it were the steric parameters like Taft’s steric constant, and UNITY that had a positive effect on the urease inhibition potential that is exhibited by 1,2,4-triazole derivatives.
Conclusion
It was evident that from the results that the variables X27, X36, X37, X39, X40, X42 and X43 correlated positively with IC50 while X22, X24, X25, X26, X38, X 41 and X44 correlated negatively with IC50. The predictive ability of the QSAR model could be easily used to design newer molecules with better anti-urease action and the molecules would be beneficial for the treatment of several diseased conditions.
References
- Mishra, R.; Mishra, B.J. Pharmacol. Biomed. 2017, 1, 103-114.
CrossRef - Dahmani, R.;Manachou, M.; Belaidi, S.; Chtita, S.; Boughdiri,S. New J.Chem.2021, 45, 1253-1261.
CrossRef - Wang, X.; Duan, W.; Lin, G.; Li, B.; Chen, M.; Lei,F. Front. Chem.2021,9, 757584.
CrossRef - Mishra, B.; Mishra, R. J. Pharmacol. Biomed. 2017,1, 119-128.
- Mishra, B.J.; Mishra, R.; HariNarayanaMoorthy, N.S.Asian J. Chem. 2007, 19, 484-487.
- Neekhara, R.; Mishra, B.J.;Moorthy,N.S.H.N. Asian J. Chem.2006, 18, 1167-1173.
- Elrayess, R.; Elgawish, M.S.; Elewa, M.; Nafie, M.S.; Elhady, S.S.;Yassen, A.S.A. Pharmaceuticals.2020,13, 370.
CrossRef - Saber, S.; Mohamad, H.; Aziz,M. Int. Conf. Adv. Sci.Engg. (ICOASE).2018, 380.
- Ghaleb, A.; Aouidate, A.; Ghamali, M.; Chtita, S.; Ousaa, A.; Bouachrine, M.; Lakhlifi, T.;Sbai, A. RHAZES: Green Appl.Chem.2018, 3, 33-46.
- Tahlan, S.; Kumar, P.; Ramasamy, K.; Mani, V.; Mishra, R.K.; Abdul Majeed, A.B.;Narasimhan, B. Arabian J. Chem.2017, 10, S2009-S2017.
CrossRef - Singla, R.K.;VaradarajBhat, G.J. Enzyme Inhib.Med. Chem.2010, 25, 696-701.
CrossRef - Dimova, V.;Nada,P.-J.Macedonian J. Chem. Chemical Engg. 2009,28, 79-89.
CrossRef - Svane, S.; Sigurdarson, J.J.; Finkenwirth, F.; Eitinger, T.; Karring, H.Scient. Rep. 2020, 10, 8503; doi: 10.1038/s41598-020-65107-9
CrossRef - Kumari, M.; Tahlan, S.; Narasimhan, B.; Ramasamy, K.; Lim, S.M.; Shah, S.A.A.; Mani, V.; Kakkar, S. BMC Chem.2021,15, 5; doi: 10.1186/s13065-020-00717-y
CrossRef - Bucklew, J. IEEE Transac. Inform. Theory.1998,44, 2877-2891.
CrossRef - Shamshara, J.The Open Med.Chem.J.,2017, 11, 212- 221.
CrossRef - Mishra, R.; Mishra B. J Pharmacol Biomed.,2017, 1, 103-114
CrossRef

This work is licensed under a Creative Commons Attribution 4.0 International License.
About The Author
![]()
A New Edition of Web of Science
Journal Impact Factor
2022: 0.5
Five Year: 0.8
Journal is Indexed in

Cabells Whitelist
![]()


