Non Carcinogenic Risk Assessment of Fluoride: A Case Study on Distribution of Water Quality Parameters in Groundwater of Kurnool District
Dasari Manjunath1, Dilip Kumar Behara3 , Gopireddy Venkta Subba Reddy2* and Suggala Venkata Satyanarayana2
1Jawaharlal Nehru Technological University Anantapur, Ananthapuramu, Andhra Pradesh 515002 India.
2Department of Chemistry, JNTUA College of Engineering, Pulivendula, Constituent college of Jawaharlal Nehru Technological University Anantapur, Ananthapuramu, Andhra Pradesh 515002 India.
3Department of Chemical Engineering, JNTUA College of Engineering, Anantapuramu Constituent college of Jawaharlal Nehru Technological University Anantapur, Ananthapuramu, Andhra Pradesh 515002 India.
Corresponding Author E-mail: gopireddy.chemistry@jntua.ac.in
DOI : http://dx.doi.org/10.13005/ojc/390331
Article Received on : 10 Mar 2023
Article Accepted on : 15 Jun 2023
Article Published : 22 Jun 2023
Reviewed by: Dr. A. Kistan
Second Review by: Dr. PVS Machiraju
Final Approval by: Dr. Virendra Tiwari
The current investigation was carried out to find available fluoride concentration in groundwater in Kurnool District, Andhra Pradesh where the major source for drinking is ground water. Around 141 samples are collected from bore wells and hand pumps of selected villages in Kurnool district by using Grid map. The samples were analyzed for selected Physico-chemical parameters. The fluoride ion content was found out in the range of 0.2 to 3.6 mg/l with mean 1.1 mg/l. Human risk assessment was carried out in terms of Hazard quotient. The Average Hazard Quotient observed for children were 1.13, for males were 1.04, and for females it is 0.92. The observed HQ values are above 1 which may prone to risk, particularly for children due to their low body weight. Compared to BIS water quality standards, the remaining parameters are also within the permissible limit except nitrate ion. The elevated nitrate level in groundwater was due to excess utilization of nitrogen based fertilizers.
KEYWORDS:Fluoride; Hazard Quotient; Human Risk assessment; Physico - Chemical parameters
Download this article as:| Copy the following to cite this article: Manjunath D, Behara D. K, Reddy G. V. S, Satyanarayana S. V. Non Carcinogenic Risk Assessment of Fluoride: A Case Study on Distribution of Water Quality Parameters in Groundwater of Kurnool District. Orient J Chem 2023;39(3). |
| Copy the following to cite this URL: Manjunath D, Behara D. K, Reddy G. V. S, Satyanarayana S. V. Non Carcinogenic Risk Assessment of Fluoride: A Case Study on Distribution of Water Quality Parameters in Groundwater of Kurnool District. Orient J Chem 2023;39(3). Available from: https://bit.ly/3NIRGny |
Introduction
The quality of groundwater depends on the composition of the recharged water, the interactions between the water and the soil, dissolved gases, geological conditions, the residence time and reactions that take place within the aquifer. Therefore, considerable variations of water quality may be found, hence it is necessary to monitor all aspects related to provision of suitable quality of water for various purposes and a special attention needs to be made on identifying various physical, parameters influencing ground water quality. Among different chemicals, a few have been shown to cause widespread health effects in humans as a consequence of exposure through drinking-water when they are present in excessive quantities. These include fluoride, arsenic and nitrate.
Fluoride is the anion state of fluorine element, and it is one of the extensive element available in nature. For proper growth of calcium based elements such as bones, and teeth in humans, requires fluoride ion, which act as a micro nutrient. The bacteria which is present in the mouth, damage the tooth enamel by the release of acid, at low concentration of Fluoride ion hamper enzymes that breed bacteria and fluoride ion bind with the calcium ions for strengthening tooth enamel1. But high concentration fluoride leads to Dental and Skeletal Fluorosis. Recent studies prove that high fluoride through ingestion into the body cause mitochondrial damage, oxidative stress, and chronic kidney diseases 2,6 Hence it was observed that, fluoride ions in the water have both benefits and detrimental on the human health. According to WHO, the permissible fluoride concentration in water for drinking purpose is 0.50 to 1.50 ppm7. If the Fluoride concentration in drinking water is below 0.50 mg/l then it leads to tooth decay, and above 1.50 ppm steer to dental and skeletal fluorosis8. Some of the studies proved that excess fluoride in Groundwater of Andhra Pradesh state and it was shown in table 1 9, 14. Generally, fluoride mobility in ground water is governed by many factors such as Geological condition, excess fertilizer utilization, Industrial Pollution, natural and anthropogenic inputs. The fluoride bearing minerals such as Fluorite, Horn blende, Biotite presence in the lithology are the reason behind the fluoride presence in ground water naturally. But fluoride ion dissolution is regulated by the parameters such as pH, Alkaline, Residence time, and temperature 15, 20. Arid and semi-arid climate is also one of considerable factor regulating the fluoride level in ground water it will accelerates leaching process and adsorption which directly increase the fluoride concentration18. According to Andhra Pradesh geological Scenario, the state is covered with older and younger peninsular Gneiss, Younger granite, Cuddapah super group and country rocks which mainly contain the minerals such as apatite, fluorite, biotite, muscovite, and hornblende 21,22. From the research studies, proved that Granites contains 520-850 mg/kg fluoride23. Hydroxyl ion is major parameter for dissolution of fluoride into the groundwater because it replaces fluoride from the fluoride bearing minerals. More time of residence in the aquifer mainly caused by the high rate of evapotranspiration and a zone with less conductivity of hydraulic are the accompany parameters that dissolution the fluoride from the fluoride bearing minerals24. Some of the anthropogenic activities such as fluorinated industrial waste, excessive agricultural production by using fertilizer and pesticides are also reasons for the elevated fluoride in ground water25. So the investigation is carried out in rural villages of Kurnool district, Andhra Pradesh.
Table 1: Fluoride Distribution in the State Of Andhra Pradesh.
|
S.No |
Location |
Concentration of Fluoride (ppm) |
Permissible Limit |
|
1 |
Vishakhapatnam district |
0.6 – 2.10 |
0.5-1.5 (BIS/WHO) |
|
2 |
Talupula village, Anantapur district |
0.78 – 6.10 |
|
|
3 |
Coastal region dug wells |
0.00 – 8.24 |
|
|
4 |
Coastal region Bore wells |
0.25 – 2.00 |
|
|
5 |
Rayalaseema dug wells |
0.04 – 3.88 |
|
|
6 |
Rayalaseema Bore wells |
0.30 – 5.00 |
|
|
7 |
Guntur district |
0.30 – 1.80 |
|
|
8 |
Coastal region between Chirala and Ongole. |
0.60 – 1.80 |
|
|
9 |
Markapur, Prakasam district |
0.40 – 5.80 |
|
|
10 |
Kurnool district |
0.20 – 3.60 |
Study area
The Kurnool is one of the district in Andhra Pradesh and belongs to Rayalaseema region, which is situated between 14⁰ 54’ – 16⁰ 18’ North latitude and 76⁰ 58’ -79⁰ 34’ East longitudes. It is surrounded North by Mahabubnagar (Telangana state), East by Prakasam, South by Ananthapuramu and YSR Kadapa, and west by Karnataka state. 17617 sq. kms is the total area of the district. 6.42% area of state and ranks the third position. As per 2011 census the total population of the district was 4,053,463 and 28.4% population in Urban and 71.6% population in rural areas. The three rivers Tungabhadra, Krishna, and kunderu are flowing in the state. The average rainfall of the year in the district is 670.3 mm, mainly receives rainfall from the south west monsoon. Highest amount of rainfall is 902 mm received during the year 2000-2001 and 505 mm was the lowest rainfall recorded in the year 2002-2003. The district is underlain by varied geological formations ranging from Archaean to recent age. Nearly 40% of the district is underlain by hard rocks belonging to the peninsular gneissic complex, Dharwar of Archean to lower Proterozoic age, 40% belongs to sediments of Kurnool group, 20% sediments of Cuddapah super group belonging to middle to upper Proterozoic age26 .
Materials and Methods
Water Quality Parameters
In the study area, total 141 samples were collected from the bore well and Hand pump, which is mainly used for drinking purpose, provided under the scheme MPWSS (Mini protected water supply scheme) by the Government. Samples were collected in a 2 liter polyethylene bottles by using APHA Specifications and labeled with chronological order pattern of collection. The collected samples were analyzed for insitu parameters and exsitu parameters. The insitu parameters such as Hydrogen potential (pH), Electrical Conductivity (EC), Salinity (S), Dissolved Oxygen (DO), Temperature (T), Total Dissolved solids (TDS) were analyzed by using Systronics water analyzer 37127 and exsitu parameters such as chloride (Cl–), Fluoride (F–), Nitrate (NO3–), Sulphate (SO42-), Total Hardness (TH), Total Alkalinity (TA), Carbonate (CO32-), Bicarbonate (HCO3–) by using standard procedures. The parameters TH and TA are estimated by titrimetric method of analysis using EDTA and H2SO4 titration respectively. The spectrophotometric method was used for the analysis of Sulphate anion with UV-Visible spectrophotometer instrument, the corresponding wavelength for Sulphate are 420 nm. Argentometric method was used for chlorine determination. Potentiometric method of Analysis (Ion Selective Electrode method) was carried out for the anions Fluoride and Nitrate by using Hanna pH- ISE Meter (HI 5222) instrument28.
Non Carcinogenic Risk Assessment
As the ingestion of fluoride ion into humans, by drinking could be the main reason for the fluorosis29. So, Risk assessment is carried out to determine whether the fluoride ion content in Ground water in study area is Non carcinogenic to children, Adults or not. For the evaluation of risk assessment, United State of Environmental protection Agency (USEPA) proposed Human risk Assessment, which is a mathematical technique to understand the probability of negative health effects in humans. Human Risk assessment is evaluated by using Hazard Quotient (HQ). HQ was estimated for the collected samples in the study area. According to USEPA, If HQ calculated value is below 1, the fluoride content is ingestion by drinking into humans, does not show any adverse effects in humans, but the HQ value is above 1, shows adverse health effects.
Hazard quotient
It is defined as the ratio of potential exposure to a substance and the level at which no adverse effects are expected. It is evaluated by using the following equation.
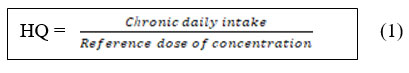
Whereas, the Chronic Daily intake is measured in mg/kg/day and the reference dose of concentration is taken from integrated risk information system (IRIS) database of the USEPA.
REF value for fluoride through drinking route = 0.06 mg/kg/day.
Chronic daily intake
It is defined as the exposure expressed as a mass of substance contacted per unit time body weight per unit time, averaged over a long period of time. CDI is evaluated by using the following equation. Corresponding parameters are displayed in table 2.

Whereas C = Concentration of Fluoride in water sample (mg/l)
IR = Ingestion rate of water (l/day)
ED = Exposure Duration (years)
EF = Exposure Frequency (days/years)
BW = Average Body weight (kg)
AT = Average time for non-carcinogenic risk (day)
Table 2: Risk Exposure Factors Standard Values
|
Risk Exposure Factors |
Units |
Children |
Adults |
|
|
Males |
Females |
|||
|
Ingestion rate |
liter/day |
1 |
4 |
3 |
|
Exposure Duration |
years |
12 |
64 |
67 |
|
Exposure Frequency |
days/years |
365 |
365 |
365 |
|
Average Body weight |
kgs |
15 |
65 |
55 |
|
Average time |
day |
4380 |
23360 |
24455 |
Results and Discussions
The water samples collected from the various parts of Kurnool district were analyzed for both insitu and exsitu parameters using APHA standards methods, which were already discussed in materials and methods section. Statistical data analysis was performed to understand the variation between BIS/WHO Standard limits and observed values for the collected samples. Further Non Carcinogenic risk assessment was carried out. The following section describes the same. Statistical data analyses of the water quality parameters which include Insitu, Exsitu parameters obtained values were displayed in table 3.
Insitu Parameters
The Parameters which are analyzed at the site immediately after the sample collection is known as Insitu parameters. The insitu parameters such as pH, EC, TDS, Temperature, Dissolved oxygen, and salinity were analyzed for the collected samples. Further the samples data were compared with BIS and WHO standards 7, 30.
pH
The potential of hydrogen is measured to known whether the water is acidic or alkaline in nature. If the sample within the range of 0-7 it is acidic in nature. If the samples are in the range of 7-14, it is alkaline in nature. The pH of fresh ground water is decreased if carbon dioxide present in air reacts with water to form carbonic acid. Alkaline nature of fresh ground water is may be due to the dissolution of carbonate minerals which produces bicarbonates, Alkali metals contains in rocks and some of the anthropogenic activities. In the study area the pH values observed in the range 6.39 – 7.99 with mean 7.13. Nearly, all samples values are in the range of BIS and WHO limits and it was showed in fig.1a
Electrical Conductivity
It is defined as the measurement of material ability to allow or conduct an electric current. EC values are used to find the presence of salts which conducts electric current. The EC values are observed in the range 367- 9390 μS/cm with a mean 2160.6 μS/cm. Fig. 1 b shows the distribution of EC in the study area.
 |
Figure 1: a) pH Histogram; b) EC Histogram. |
Total dissolved salts
The presence of inorganic salts, and few organic salts, which produces unwanted waste and diluted colour, is measured by using total dissolved solid parameter. Water is classified, such as Fresh, Brackish, Saline, Brine based on the TDS value. In the study areas the collected samples TDS value in the range of 218 – 5440 ppm with mean 1147 ppm. The collected samples in the study area, 52% fresh and remaining 48 % samples brackish nature31 fig.2a shows the TDS distribution.
Temperature
The temperature of the collected samples is in the range of 28 – 38.7 ⁰C with mean value 32.8 ⁰C. Excess temperature is also responsible for dissolution of anions from anion bearing minerals. The variation of the temperature parameter is shown in the fig 2b
 |
Figure 2: a) TDS Histogram, b) Temperature Histogram. |
Table 3: Statistical Analysis of Parameters and Comparison to WHO/BIS Standards
|
Parameter |
Min |
Max |
Average |
Median |
BIS |
WHO |
||
|
Desired |
Permissible |
Desired |
Permissible |
|||||
|
pH |
6.39 |
7.99 |
7.13 |
7.08 |
6.5-8.5 |
No relaxation |
6.5 |
8.5 |
|
EC (μS/cm) |
367.0 |
9390.0 |
2160.6 |
1800.0 |
– |
– |
400 |
– |
|
TDS (ppm) |
218.0 |
5440.0 |
1147.20 |
950.0 |
500 |
2000 |
500 |
– |
|
Temperature |
28.0 |
38.7 |
32.8 |
32.8 |
– |
– |
– |
– |
|
DO (ppm) |
0.8 |
10.0 |
3.6 |
2.9 |
– |
– |
– |
– |
|
Salinity (ppm) |
180.0 |
5370.0 |
1144.2 |
940.0 |
– |
– |
– |
– |
|
Chloride (ppm) |
28.3 |
1301.3 |
212.1 |
169.8 |
250 |
1000 |
200 |
600 |
|
Fluoride (ppm) |
0.2 |
3.6 |
1.1 |
0.8 |
1.0 |
1.5 |
0.5 |
1.5 |
|
Nitrate (ppm) |
20.3 |
792.0 |
173.6 |
144.0 |
45 |
No relaxation |
0 |
45 |
|
Sulphate (ppm) |
3.2 |
749.1 |
109.9 |
80.5 |
200 |
400 |
– |
– |
|
TH (ppm) |
30.0 |
890.0 |
223.1 |
200.0 |
200 |
600 |
100 |
500 |
|
TA (ppm) |
100.0 |
550.0 |
313.8 |
310.0 |
200 |
600 |
– |
– |
Dissolved Oxygen
It is defined as the amount of oxygen present in the water. Generally oxygen from the atmosphere and from aquatic plants is responsible for the dissolved oxygen in water. In the study the observed DO in the range of 0.8 – 10.0 ppm with mean 3.6 ppm. The variation of the DO parameter is shown in the fig3a.
Salinity
The concentration of dissolved mineral salts present in water samples is evaluated by calculating Salinity parameter. The samples values Salinity present in the range of 180 – 5370 ppm with average 1144.2 ppm. Fig.3b shows the salinity content in the study area.
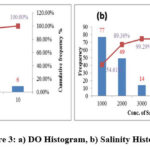 |
Figure 3: a) DO Histogram, b) Salinity Histogram |
Ex-Situ Analysis
The collected samples from the various parts in the study area were analyzed at laboratory by using different techniques such as Potentiometric, Titration, and Spectrophotometric with different instruments which were already discussed in previous section. The Ex-situ analyses are Chloride, Fluoride, Nitrate, Sulphate, Total Hardness and Total Alkalinity were analyzed for the collected samples. All samples data were compared with BIS/WHO limits.
Chloride
The chloride ion concentration presented in the samples is determined by using Argentometric Analysis. Generally the chloride in water is due to presence of salts naturally and anthropogenically due to effluents, irrigation discharge, and sewage discharge etc. The chloride in the sample is in the range of 28.3- 1301.30 ppm with mean 212.1. The BIS permissible limit for chloride in drinking water is 250 ppm and WHO standard limits is 200 ppm. 72% samples are in the range of BIS standards and 28% samples are above the prescribed limit. fig.4a shows the chloride ion distribution. Excess chloride in groundwater becomes dangerous to humans.
Fluoride
The fluoride present in the groundwater is mainly due to fluoride bearing minerals. But elevated fluoride in ground water is due to factors like Adsorption, Precipitation, Ion exchange, Leaching and some other biochemical reactions which speed up the dissolution of fluoride ion into Groundwater. Arid and semi-arid alkaline soil regions are the favorable for acceleration of fluoride in ground water. Residence time and temperature also increase the fluoride ion concentration in Ground water by the dissolution of fluoride from fluoride bearing minerals. Some of the anthropogenic activities like Fertilizer usages, Chemical leaching from industries will also accelerates the fluoride in Ground water. Fig 4b shows Fluoride ion histogram.
The collected samples are analyzed by Ion selective electrode method. The fluoride values are in the range of 0.2 – 3.6 ppm with mean 1.1 ppm. The BIS standards for fluoride are 1-1.5 ppm and WHO standard limits are 0.5-1.5 ppm. The variations in the standards are mainly due to the change in climatic conditions. 81% of the samples are in the BIS standards. Remaining 19% samples are above the prescribed limit. If this ground water is used for the drinking purpose leads to tooth decay. The low fluoride in the study area is due to the presence of surface storage structures which dilute the fluoride concentration in drinking water32.
 |
Figure 4: a) Chloride ion Histogram, b) Fluoride ion Histogram. |
Nitrate
The Nitrate concentration is identified by using Ion selected electrode method. The Nitrate values in the samples are observed in the range of 20.3 – 792 ppm with average 173.6 ppm. According to BIS/WHO this water is unfit for drinking due to the presence of excess nitrate. 45 ppm is the prescribed limit but in the stud area the samples are above 60 ppm which is not acceptable for drinking purpose. Excess nitrate level in the ground water is due to the utilization of excess nitrogen based fertilizer33, 35. Nitrate content in the ground water does not change with respective to time and concentration is relatively stable. The following figure 5a shows the distribution of Nitrate ion.
Sulphate
The Sulphate is determined by using UV-Visible Spectrophotometer. The Sulphate in the study area varies from 3.2-749.1 ppm with mean 109.9 ppm. All the samples are in the range of BIS Standards. Figure 5b shows the Sulphate ion distribution in the study area.
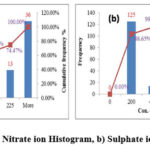 |
Figure 5: a) Nitrate ion Histogram, b) Sulphate ion Histogram |
Total Hardness
Total hardness is determined by titrimetric method of analysis using EDTA. The total hardness in the samples varies in the range 30-890 ppm with average 223.1 ppm. The BIS standards for the total hardness are 200 to 600 ppm. Nearly all samples are in the range of BIS Prescribed standards. Figure 6a shows the distribution of Total hardness concentration in the study area.
Total Alkalinity
Total Alkalinity is determined by using H2SO4 with titrimetric method of analysis. The total alkalinity is in the range of 100 – 550 ppm with average of 313.8 ppm. All the samples are below the standard prescribed limits given by BIS. Fig.6b displays the Total alkalinity concentration in study area.
 |
Figure 6: a) Total Hardness Histogram, b) Total Alkalinity Histogram. |
Non-Carcinogenic Risk Assessment:
By using different risk exposure factors and the observed fluoride content in Groundwater the CDI was calculated mathematically. Next the hazard quotient is calculated. The average values of Hazard quotient for children, males and females are 1.13, 1.04, and 0.92 respectively. The HQ mean values are above 1, so it may be non-carcinogenic risk for humans. Further, it can be observed from the values, the children are more prone to risk compare to adults due to their low body weight, but among adults, males are more prone to risk compare to female even though high body weight, it was due to ingestion rate. Finally, the 39% samples are having HQ values above 1, which is not fitted for drinking.
Conclusion
The collected samples in the study area confirms that fluoride concentration within the limits, prescribed by BIS and WHO, but risk assessment data proved that some of the samples in the area having Hazard quotient greater than 1 which leads great risk to children if this water is used for drinking purpose. In some places it is below the requirement, it may be due to the dilution of fluoride from the surface reservoirs which are located near study area. So the Government and Non-Government Organizations should monitor the quality of drinking water regularly and provided defluoridation filter plants for the removal of excess fluoride otherwise dependence of groundwater should be minimize by providing other water sources. In the study area samples having high nitrate concentration so the water is not fit for drinking purpose.
Acknowledgment
All authors are humbly thankful to the Board of Research in Nuclear Sciences (BRNS), Bhabha Atomic Research Centre, Trombay, and Mumbai. Also, the authors thank to research colleagues, laboratory staff of the department of Chemical Engineering, JNTUA college of Engineering, Anantapuramu, and the residents of the Rayalaseema districts for their collaboration during sample collections.
Conflict of Interest
The authors declare that they have no known competing financial interests or personal relationships that could have appeared to influence the work reported in this paper.
References
- Susheela, A.K., Mudgal, A., Fluoride in water: an overview, UNICEF water front issue 1999,13,11-13
- Zuo, H., Chen, L., Kong, M., Qiu, L., Lu, P., Wu, P., Yang, Y., Chen, K. Toxic effects of fluoride on organisms, Life Sci. 2018, 198, 18-24.
CrossRef - Yang, K., and Liang, X., Fluoride in Drinking Water: Effect on Liver and Kidney Function, Encyclopedia of Environmental Health, Elsevier, 2011, 769-775.
CrossRef - Singh, A., and Singh, J., Chapter 1 – Effects on Human Health due to Fluoride, Green Technologies for the Defluoridation of Water, 2021,1-16
CrossRef - Solanki Y.S., Agarwal M., Gupta A. B., Gupta S., and Shukla P. Fluoride occurrences, health problems, detection, and remediation methods for drinking water: A comprehensive review, Sci Total Environ. 2022, 807, 150601,
CrossRef - Nagendra, A. H., Najar, M. A., Bose, B., and Sudheer, S. P. High concentration of sodium fluoride in drinking water induce hypertrophy versus atrophy in mouse skeletal muscle via modulation of sarcomeric proteins, J. Hazard. Mater. 2022, 432, 128654
CrossRef - WHO, “Guidelines for Drinking Water Quality,” Geneva, 2011.
- Adimalla N and Wu, Groundwater quality and associated health risks in a semi-arid region of south India: Implication to sustainable groundwater management, J. Hum. Ecol. risk assess. 2019, 25, 191-216.
CrossRef - Rao N.S. Fluoride in groundwater, Varaha River Basin, Visakhapatnam District, Andhra Pradesh, India, Environ. Monit. Assess. 2009, 152, 47-60
CrossRef - Arveti N., Sarma M. R. S., Aitkenhead-Peterson J. A., and Sunil K, Fluoride incidence in groundwater: a case study from Talupula, Andhra Pradesh, India, Environ. Monit. Assess. 2011, 172, 427-443.
CrossRef - Rao P. N., Rao A.D., Bhargav J. S., Siva Sankar K., and Sudarshan G. Regional appraisal of the fluoride occurrence in groundwaters of Andhra Pradesh, J. Geol. Soc. India. 2014, 84, 483-493.
CrossRef - Subba rao, N. Groundwater quality: focus on fluoride concentration in rural parts of Guntur district, Andhra Pradesh, India , Hydrol Sci J. 2003,48, 835-847.
CrossRef - Rao, N. S., Rao, P. S., Dinakar, A., Rao, P. V. N., and Marghade, D. Fluoride occurrence in the groundwater in a coastal region of Andhra Pradesh, India Appl. Water Sci. 2017, 7, 1467-1478.
CrossRef - Adimalla, N., Venkatayogi, S., and Das, S. V. G. Assessment of fluoride contamination and distribution: a case study from a rural part of Andhra Pradesh, India, Appl. Water Sci. 2019, 9, 94,
CrossRef - Chicas, S. D., Omine, K., Prabhakaran, M., Sunitha, T. G., and Sivasankar,V. High fluoride in groundwater and associated non-carcinogenic risks at Tiruvannamalai region in Tamil Nadu, India Ecotoxicol. Environ. Saf, 2022, 233, 113335
CrossRef - Handa, B., Geochemistry and genesis of fluoride- containing ground waters in India. 1975.
CrossRef - Saxena,V., and Ahmed,S. Dissolution of fluoride in groundwater: a water-rock interaction study Environ. Geol. 2001, 40, 1084-1087.
CrossRef - Adimalla,N. Groundwater Quality for Drinking and Irrigation Purposes and Potential Health Risks Assessment: A Case Study from Semi-Arid Region of South India Expos. Health. 2019, 11, 109-123.
CrossRef - Adimalla,N., and Li,P. Occurrence, health risks, and geochemical mechanisms of fluoride and nitrate in groundwater of the rock-dominant semi-arid region, Telangana State, India Hum. Ecol. risks assess. 2019, 25, 81-103
CrossRef - Adimalla,N. and Rajitha,S. Spatial distribution and seasonal variation in fluoride enrichment in groundwater and its associated human health risk assessment in Telangana State, South India Hum. ecol. risk assess. 2018, 24, 2119-2132
CrossRef - Sreenivasan,G., and Wodeyar,B. Occurrence of fluoride in the groundwaters and its impact in Peddavankahalla basin, Bellary District, Karnataka–A preliminary study, Current Science. 1996,70(1), 71-74
- Adimalla,N., and Sudarshan,V. Assessment of fluoride contamination in groundwater from Basara, Adilabad District, Telangana State, India Appl. Water Sci. 2017,7, 2717-2725
CrossRef - Adimalla,N., and Qian,H., Spatial distribution and health risk assessment of fluoride contamination in groundwater of Telangana: A state-of-the-art, Geochemistry, 2020, 80(4), 125548,
CrossRef - Adimalla, N. Controlling factors and mechanism of groundwater quality variation in semiarid region of South India: an approach of water quality index (WQI) and health risk assessment (HRA), Environ Geochem Health. 2020, 42, 1725-1752.
CrossRef - Jacks,G., Bhattacharya,P., Chaudhary,V., and Singh,K.P. Controls on the genesis of some high-fluoride groundwaters in India, Appl. Geochem. 2005, 20, 221-228.
CrossRef - Department of mines and geology, “District Survey report-Kurnool,” 2018.
- Central pollution control board, “Guidelines for water quality monitoring,” Delhi, 2007.
- American Public Health Association, “Standards methods for the examination of water and waste water.” 2005.
- USEPA, “Preliminary health risk reduction and cost analysis—revised national primary drinking water standards for radio nuclides,” 2000.
- Bureau of Indian standards, Indian Standard DRINKING WATER — SPECIFICATION, Second revision. IS 10500 : 2012, 2012.
- Meride,Y., and Ayenew,B. Drinking water quality assessment and its effects on residents health in Wondo genet campus, Ethiopia, Environmental Systems Research. 2016,5, 1
- Onipe,T., Edokpayi,J.N., and Odiyo,J.O. Geochemical characterization and assessment of fluoride sources in groundwater of Siloam area, Limpopo Province, South Africa Scientific Reports. 2021,1, 14000 .
- Yu,G., Wang,J., Liu, L., Li,Y., Zhang,Y., and Wang,S. The analysis of groundwater nitrate pollution and health risk assessment in rural areas of Yantai, China BMC Public Health. 2020, 20, 437.
- Kalwania, G.S., and Radhey, S. Seasonally Variation of Nitrate Level Before and After Fertilizers Application in Ground Water of Sikar District (India), Orient. J. Chem. 2012. 28(1), 547-552.
- Arunkumar,P., Kumar Das,S., and Chatterjee,A. A Study on Groundwater Quality Based on Major Ion Chemistry of Jharkhand State in India: A Review Orient. J. Chem. 2021, 37(4) 962-971.

This work is licensed under a Creative Commons Attribution 4.0 International License.
About The Author
![]()
A New Edition of Web of Science
Journal Impact Factor
2022: 0.5
Five Year: 0.8
Journal is Indexed in

Cabells Whitelist
![]()


