Green Procedure for the synthesis of Copper Nanoparticles using Nerium Oleander Leaf Extract: Characterizations and Applications
Helen Merina Albert1* and C. Alosious Gonsago2
1Department of Physics, Sathyabama Institute of Science and Technology, Chennai, India.
2Department of Electronics Science, Mohamed Sathak College of Arts and Science, India.
Corresponding Author E-mail: drhelenphy@gmail.com
DOI : http://dx.doi.org/10.13005/ojc/390332
Article Received on : 14 Apr 2023
Article Accepted on : 06 May 2023
Article Published : 22 Jun 2023
Reviewed by: Dr. Sachin Kamble
Second Review by:
Final Approval by: Dr. Ayssar Nahle
In the present study, Copper nanoparticles (Cu-NPs) are produced using Nerium Oleander leaf extract via a green process. The prepared samples were examined by powder‒X-ray diffraction (P-XRD), ultraviolet-visible (UV-Vis) spectroscopy; Fourier transforms infrared (FTIR) spectroscopy, field emission scanning electron microscopy (FESEM) and antibacterial screenings. According to XRD measurements, the Cu-NPs have a monoclinic form. According to UV-Vis study, the minimal absorbance between 250 and 1000 nm is due to by the formation of high-quality samples. The functional groups of Cu-NPs were verified by FT-IR spectroscopy. According to the FE-SEM analysis, the Cu-NPs are clusters of smaller cylindrical objects with good uniformity. The antibacterial results show that the samples are fairly effective against Escherichia coli and Salmonella typhi bacterium. The findings indicate that Cu-NPs can be used in the medical sector for surgical tools.
KEYWORDS:Antibacterial ability; FT-IR; FESEM; Green synthesis
Download this article as:| Copy the following to cite this article: Albert H. M, Gonsago C. A. Green Procedure for the synthesis of Copper Nanoparticles using Nerium Oleander Leaf Extract: Characterizations and Applications. Orient J Chem 2023;39(3). |
| Copy the following to cite this URL: Albert H. M, Gonsago C. A. Green Procedure for the synthesis of Copper Nanoparticles using Nerium Oleander Leaf Extract: Characterizations and Applications. Orient J Chem 2023;39(3). Available from: https://bit.ly/3Nd8Ojy |
Introduction
Nanotechnology is the study and control of matter at sizes between 1 and 100 nanometers, where different phenomena alter novel applications. These materials’ physical and chemical characteristics will be completely different from those of their bulk form at the nanoscale. Metal nanoparticles are currently very important due to their catalytic activity, optical and electrical, magnetic characteristics, and antibacterial capabilities. Metal-based nanobiotechnology has become increasingly popular due to its cutting-edge nature and a wide variety of applications in nearly all scientific and technological fields, notably health and life sciences 1-3. Due to their unique biological and mechanical characteristics, copper nanoparticles (Cu-NPs) have drawn the most attention among metal nanoparticles. Cu-NPs exhibit an electron correlation effect, spin dynamics, and high-temperature superconductivity. These attributes have greatly increased its applications as a heterogeneous catalyst, antimicrobial agent, drug delivery system, and antioxidant in the biomedical industry 4-5.
Metal-nanoparticles can be synthesized through a wide range of physical, chemical, biological, and hybrid methods. Physical and chemical processes typically produce low yields, are hazardous, and are not environmentally friendly. Due to contamination from precursor chemicals, the nanoparticles produced through chemical means are not suitable for use in healthcare. One of the most straightforward and environmentally beneficial ways to make metal nanoparticles is through plant-mediated synthesis due to its non-toxicity, quickness and low cost 6, 7. In comparison to physical and chemical methods, the green process has additional benefits such affordability, energy efficiency, and compatibility with medications. This background influences the use of the plants as a reducing and capping reagent for the generation of copper nanoparticles (Cu-NPs) as well as their characterization and applications in medical field. The biodiversity of plants has received considerable attention for the synthesis of metallic nanoparticles due to the availability of potent phytochemicals in various plant extracts such as aldehydes, ketones, flavones, amides, phenols, carboxylic and ascorbic acids. These elements have the ability to convert metal salts into metallic nanoparticles. These chemicals found in plant leaf extracts have a remarkable ability for reducing the metal ions in shorter periods of time. In light of this, plant leaf extracts are regarded as excellent and secure binding agents for the creation of metallic nanoparticles.
In the literature, various plant extract-mediated Cu-NPs synthesis processes have been described. Leaf extracts of many plants, including Tecoma castanifolia, Duchsnea indica, Psidium guajava, Camellia sinensis, Solanum marginatum, Tamarix gallica, Polyalthia longifolia, Syzygium alternifolium, Suaeda maritime, Artemisia deserti, Juglans regia, Leucas aspera, Achillea Nobilis, and Muntingia calabura have been utilized for forming Cu-NPs ,8-21. In keeping with the earlier research, we employed an extract of fresh Nerium Oleander leaves as a capping agent and a bioreductant to produce Cu-NPs using this environmentally friendly method. The green synthesis, spectral, optical characterizations, and antibacterial capabilities of the Cu-NPs have all been described by previous studies 22,23. In the present analysis, we performed a P-XRD study to establish the structure of the sample, UV spectral analysis to find the optical absorbance, FTIR analysis to assess the presence of functional groups, FE-SEM to identify the surface morphology, and an antibacterial study to examine the antibacterial performance of the samples.
Experimental Methods
Synthesis of leaf Extract
Fresh Nerium oleander leaves were collected from Pandhanallur, Thanjavur district, Tamil Nadu, India. The leaves were surface cleaned with tap water to eliminate dust, and then rinsed with distilled water. To remove any remaining moisture, the leaves were then allowed to dry for a week. The dried leaves were processed into a fine powder in a blender and kept in a dimly lit area. The extract was prepared by mixing 10g of powdered Nerium oleander leaves with 100ml of distilled water, and then boiling the mixture for 20 minutes at 80°C. After being cooled to room temperature, the mixed solution was filtered through whatman filter paper to get a clear solution. The solution now appears into a golden yellowish shade.
Synthesis of Cu–NPs
First, 100 ml of Copper Chloride (0.1M) was stirred for two hours in an Erlenmeyer flask to prepare CuCl2 solution. Following that, 20 ml of the aqueous Nerium oleander extract was added to 80 ml of CuCl2 solution at room temperature, and the mixture was agitated for a whole day. The colour shift was periodically checked every 30 minutes. Visually, the transition of color from light to dark indicates the formation of Cu-NPs. It can be seen in Figure 1. This color shift could be due to the surface plasmon absorption of copper nanoparticles, which was caused by an interaction between the incident light radiation and the conduction electrons of Cu-NPs. In the synthesis process copper chloride was used as a precursor, while Nerium oleander leaf extract was employed as a capping and reducing agent.
 |
Figure 1: (a) Nerium Oleander Leaves, (b) Leaves extract, (c) CuCl2 solution, and (d) Color shift |
Results and Discussion
Powder-XRD Analysis
Powder–XRD is a nondestructive method for determining crystal structure at the atomic level. This method has a lot of potential for characterizing both bulk and nanomaterials [24]. Any crystal might very well reflect X-ray light, causing a variety of diffraction patterns. These patterns will reveal the physicochemical properties of the crystal structures. By contrasting the diffracted beams with the reference database JCPDS library, one can identify and recognize each material since everyone has a unique diffraction pattern. The purity of the substances can also be recognized in the diffracted patterns. The XRD plot of the as-synthesized Cu-NPs is displayed in Fig. 2. The pattern shows a large number of sharp, intense peaks that substantiate the formation of the Cu-NPs as well as crystalline nature. The prominent diffraction peaks at 32.20, 38.12, 46.29, 54.66, and 64.48° depict the Bragg’s reflection planes of Cu-NPs at 2θ values of (101), (111), (-112), (020) and (113), respectively. In addition to these peaks, the XRD pattern also displays a number of other small peaks that were not assigned. These extra peaks are thought to be the result of the bioorganic phase coagulating on the surface of the Cu-NPs. Furthermore, the analysis shows that all the diffraction peaks fit well with the monoclinic structure of Cu-NPs. The average crystal size of the green synthesized Cu-NPs has been determined using Debye–Scherrer’s equation 25:

Where, d stands for the mean crystal size (in nm), λ for the wavelength of Cu-Ka radiation, β for full width at half maximum (in radians), and θ for scattering angle (in degrees). The typical size of Cu-NPs was calculated using the above equation to be around 30 nm.
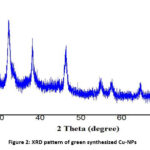 |
Figure 2: XRD pattern of green synthesized Cu-NPs |
UV-Vis spectroscopy
The UV-Vis spectroscopy is employed to identify, or ascertain the chemical, molecular, and structural characteristics of a material. Electromagnetic radiation will be reflected, absorbed, or emitted distinctly by different kinds of atomic particles. These characteristics allow spectroscopy to assess the nature of sample 26,27. UV-Vis absorbance plots of the synthesized the Cu-NPs were recorded at various wavelengths between 200 and 1000 nm at a scan rate of 200nm/min and are shown in Fig. 3. The spectra show a significant characteristic emission peak around 220nm. The emission of tiny Cu particles may be responsible for the emission peak’s shift towards a lower wavelength, which is most likely owing to surface plasmon resonance (SPR).
 |
Figure 3: UV–Vis plot of green Cu-NPs |
FTIR spectroscopy
The analysis of pharmaceutical materials now routinely employs infrared spectroscopy, with both mid and near-IR spectroscopy serving as standard methods for examining both active ingredients and active medicinal components 28. The non-invasive FT-IR analysis is used to categorize the molecules and functional groups that are available in the synthesized Cu-NPs. When the incident FTIR light at a particular resonance frequency comes into contact with a group or bond vibrating at the same frequency, absorption takes place. The kind of molecular potential energy, vibrational coupling, and atomic masses are responsible for specific energy absorption. The distinctive atom arrangements in each drug or molecule account for the observed variations in their FTIR spectra. The FTIR studies were conducted between 4000‒400 cm‒1 and the curves are displayed in Fig. 4.
The FTIR curve of Nerium Oleander Leaves extract displays some considerable peaks at 3200, 2900, 1600, 1320, 1100, and 536 cm−1. The broad and intense band at 3200 cm−1 shows the existence of N-H stretching in the aliphatic primary amine. The band at 2900 cm−1 represents the C–H stretching of the –CH2 group. The existence of the C=O stretching of ketones or acids is represented by the band at 1600 cm−1. The band around 1320 cm−1 denotes the existence of COO– group of carboxylic acid. The band at 1100 cm−1 the represents the C−NH2 primary aliphatic amines and the absorbance at 536 cm−1 reveals the presence of a C–H bond.
Meanwhile, the FTIR curve of green synthesized Cu-NPs, displays some significant bands at 3412, 3310, 2140, 1685, 1342, 1086, 812, 546, and 390 cm−1. The absorbance band at 3412 cm−1 relates to the O−H stretch of the phenolic compound exists in the plant extract. The existence of that N-H stretching in the aliphatic primary amine is shown by the broad and intense band at 3310 cm−1. The band at 2140 cm−1 represents the C=C stretching of alkaline. The band at 1685 cm−1 shows the existence of C=O stretching of the ketones or acids. The existence of COO– group of thecarboxylic acid is denoted by the absorbance around 1342 cm−1. The band at 1086 cm−1 represents the C−NH2 primary aliphatic amines and the band at 812 cm−1 denotes the C-H bending vibration. The characteristics absorbance at 546 cm−1 and 387 cm−1 reveal the formation of Cu-NPs.
 |
Figure 4: FTIR curves (a) Nerium Oleander Leaves extract, (b) green synthesized Cu-NPs. |
FESEM spectroscopy
The imaging method used in FESEM enables the viewing of incredibly minute structures with a dimension of a few nanometers or less. The FESEM offers extremely high imaging at low accelerating voltages and close working distances. Biologists, chemists, and physicists employ this technique to find structures that may be as small as 1 nm 29,30. It makes use of an electron beam that is narrowly focused and scans the surface of the sample. Secondary electrons are created as a result of the electron beams contact with the sample, and they contain data regarding surface topography. The FE-SEM pictures of the fabricated Cu-NPs are displayed in Figure 5. Figure 5a depicts the observation of the nanoparticles at 50.0 KX magnification, whereas Figure 5b depicts the view at 100.0 KX magnification over the 5.8mm width of the sample at an operating voltage of 5KV. The Cu-NPs produced with Nerium Oleander leaves extract have a well-dispersed, adaptable, and cylindrical shape, which is illustrated in the micrographs. Rather than forming a dense, tightly packed assembly state, the nanoparticles formed a relatively open, quasi-linear superstructure. Additional research reveals that Cu-NPs are polydisperse clusters of smaller cylindrical objects with good homogeneity.
 |
Figure 5: FESEM images of Cu-NPs with (a) 50 KX, and (b) 100 KX magnifications. |
Antibacterial ability
Much focus is being paid to the high rate of resistance of different microorganisms to most antimicrobial agents. Antibiotic-resistant pathogenic microbes pose a serious danger to both human and animal health, according to statements made by the World Health Organization. Antimicrobial resistance keeps rising at an alarming pace due to the extensive use of therapeutic antimicrobial agents. In order to test for antibiotic susceptibility, Mueller-Hinton agar is frequently utilized. Mueller-Hinton agar is employed in clinical diagnosis 31, 32. Using agar well diffusion method, the susceptibility of the Cu-NPs against multidrug-resistant bacterial strains was ascertained. In the present investigation, the antibacterial efficacy of green synthesized Cu-NPs against two bacterial species, Escherichia coli and Salmonella typhi, have been observed using Mueller-Hinton agar plates.
MHA was prepared and poured in the autoclaved sterile glass Petri dishes. After to the solidification of the agar plates, 100 µl of the test organisms (overnight culture) were spread over the surface using an L-rod. A hole was punctured using a sterile tip in a diameter of 2mm aseptically; test samples and control were loaded into the well. Then the agar plates were incubated in the microbiological incubator at 37°C. Following overnight incubation, results were noted. A zone of inhibition was identified around the well, immediately after the incubation period. Antibacterial efficacy of the synthesized Cu-NPs was found by finding the diameter of the zone of inhibition. Antibacterial abilities were tested for three distinct concentrations 20, 40 and 60µl and are shown in Fig. 6. Briefly, E. coli showed zones of inhibition of 1.60 mm, 2.40 mm, and 3.80 mm for the samples put in 20µl, 40µl, and 60µl, respectively. Similarly, S. typhi showed zones of inhibition of 2.6 mm, 3.4 mm, and 4.8 mm for the samples put in 20µl, 40µl, and 60µl, respectively. It has also been noted that raising the concentration enhances the antibacterial effectiveness. According to the results, the samples were fairly effective against E. coli and S. typhi bacterium.
 |
Figure 6: Antibacterial test for Cu-NPs against (a) E. Coli, and (b) S. typhi. |
Conclusions
In the present analysis, leaf extract of Nerium Oleander has been applied as the reducing agent to convert copper chloride into Copper nanoparticles (Cu-NPs). Powder-XRD, UV-Vis absorption, FTIR spectroscopy, FESEM analysis, and antimicrobial tests have all been performed to describe the green synthesized Cu-NPs. The monoclinic crystalline structure of the Cu-NPs was determined using XRD investigation and the particle size was around 30 nm. The UV-Vis spectra revealed a minimal absorbance in between 250 and 1000 nm, caused by the formation of good-quality nanoparticles. The molecules and functional groups involved in the samples were identified using the FTIR technique. According to the FESEM analysis, Cu-NPs were well-homogenized clusters of smaller cylindrical objects. The antibacterial tests show that the samples were fairly effective against Escherichia coli and Salmonella typhi bacterium. The stated results indicate that they Cu-NPs might prevent the growth of common bacteria, suggesting that it may be applied to surgical instruments in the medical industry.
Acknowledgement
The authors gratefully acknowledge the experimental facilities provided by the Sathyabama Institute of Science and Technology, Chennai, and IGCAR, Kalpakkam, Tamil Nadu, India.
Conflicts of interest
The authors declare that no funds, grants or other support were received during the preparation of this manuscript.
References
- Mughal, B.; Zaidi, S.Z.J.; Zhang, X.; Hassan, S.U. Appl. Sci. 2021, 11, 2598.
CrossRef - Mariappan, N. Biomed. Pharma. 2019, 12, 1095‒1127.
CrossRef - Vadlapudi, V,; Kaladhar, D.S.V.G.K.; Behara, M.; Sujatha, B.; Kishore Naidu, G. Orient. J. Chem. 2013, 29, 1589‒1595.
CrossRef - Shavandi, A.; Saeedi, P.; Azam Ali, M.; Jalalvand, E. Adv. Funct. Poly. Biomed. Appl. 2019, 1263‒1271.
- Raja, S.; Ramesh, V.; Thivaharan, V. Arab. J. Chem. 2017, 10, 253‒261.
CrossRef - Henriquez, L.C.; Alfaro, K.A.; Alvarez, J.U.; Fernandez, L.V.; de Oca Vasquez, G.M.; Baudrit, J.R.V. Nanomater. 2020, 10, 1763.
CrossRef - Prakash, V.; Kaur, H.; Kumari, A.; Kumar, M.; Gupta, S.; Bala, R. Orient. J. Chem. 2021, 37, 648‒655.
CrossRef - Nishat Bhatia; Asha Kumari; Neelam Chauhan; Nitika Thakur; Rahul Sharma. Biocat. Agricult. Biotech. 2023, 47, 102574.
CrossRef - Sathiyavimal, S.; Vasantharaj, S.; Veeramani, V.; Mythili, S.; Rajalakshmi, G.; Thamaraiselvi. K.; Fahad, A.A.; Arivalagan, P. J. Environ. Chem. Engg. 2021, 9, 105033.
CrossRef - Emima Jeronsia, J,; Allwin Joseph, L.; Annie Vinosha, P.; Jerline Mary, A.; Jerome Das, S.; Camellia, S. Mater. Tod. Proceed. 2019, 8, 214‒222.
CrossRef - Suriya, A.; Muhammad Sadiq, Ganesh, M.R.; Arthanareeswari, M. Mater. Tod. Proceed. 2022, 68, A1‒A6.
CrossRef - Nasrollahzadeh, M.; Mohammad Sajadi, S.; Mehdi Maham. RSC Adv. 2015, 5, 40628‒40635.
CrossRef - Nagore, P.; Ghotekar, S.; Mane, K.;Ghoti, A.; Bilal, M.; Roy, A. BioNanoSci. 2021, 11, 579‒589.
CrossRef - Yugandhar, P.; Vasavi, T.; Shanmugam, B. Mater. Res. Exp. 2019, 6, 065034.
CrossRef - Peddi, P.; PTSRK, P.; Rani, N.U.; Tulasi, S.L. J. Gen. Engg. Biotech. 2021, 19, 131.
CrossRef - Shahriary, S.; Tafvizi, F.; Khodarahmi, P.; Shaabanzadeh, M. Bio. Conver. Bioref. 2022.
- Asemani, M.; Anarjan, N. Green Process. Syn. 2019, 8, 557‒567.
CrossRef - Radhakrishnan, R.; Liakath Ali Khan, F.; Muthu. A.; Manokaran, A.;
Savarenathan, J.A.; Kasinathan, K. Lett. Appl. NanoBioSci. 2021, 10, 2706‒2714.
CrossRef - Sepasgozar, S.M.E.; Mohseni, S.; Feizyzadeh, B.; Morsali, A. Bul. Mater. Sci. 2021, 44, 129.
CrossRef - Vidhya, S.; Mohammod, A.; Lai-Hock, T.; Syaza Amira, R.; Khaled, A.; Hend Ibraheem, A. Materials. 2021, 14, 6379.
- Meghana, S.; Kabra; P.; Chakraborty, S.; Padmavathy, N. RSC Adv. 2015, 5, 12293‒12299.
CrossRef - Sunday Adewale Akintelu; Aderonke Similoluwa Folorunso; Femi Adekunle Folorunso; Abel Kolawole Oyebamiji. Heliyon. 2020, 6, e04508.
CrossRef - Akl, M.A.; Nidá, M.S.; Marwa, M.A.; Abdul Aziz, F.M. Chem. Internat. 2020, 6, 42‒48.
- Albert, H.M.; Alosious Gonsago, C. J. Mater. Sci. Mater. Electron. 2022, 33, 2970‒2979.
CrossRef - Helen Merina Albert; Lohitha, T.; Karthik, A.; Alosious Gonsago, C.; Vinita, V. Mater Tod. Proceed. 2021, 47, 1030‒1034.
CrossRef - Alosious Gonsago, C.; Helen Merina Albert; Malliga, P.; Joseph Arul Pragasam, A. Mater. Manufact. Process. 2012, 27, 355‒359.
CrossRef - Albert, H.M.; Alosious Gonsago, C. J. Electron. Mater. 2022, 51, 4555‒4564.
CrossRef - Tereshchenko, A.A.; Polyakov, V.A.; Guda, A.A.; Bulgakov, A.N.; Tarasov, A.L.; Kustov, L.M.; Butova, V.V.; Trigub, A.L.; Soldatov, A.V. J. Surf. Invest. 2020, 14, 447‒458.
CrossRef - Khan, M.M.; Harunsani, M.H.; Tan, A.L.;Hojamberdiev, M.; Azamay, S.; Ahmed, M. Biopro. Biosys. Engg. 2020, 43, 1499‒1508.
CrossRef - Patel, H.; Joshi, J. J. Sol-Gel Sci. Tech. 2023, 105, 814‒826.
CrossRef - Nandan. C.P.; Keyur, D.B.; Dinesh, S.K. Orient. J. Chem. 2023, 39, 30‒39.
- Bayat, F.; Kordasht, S.A.; Amani-Ghadim, A,R.; Mohammadnejad. M. Mater. Chem. Phys. 2023, 299, 127514.
CrossRef

This work is licensed under a Creative Commons Attribution 4.0 International License.
About The Author
![]()
A New Edition of Web of Science
Journal Impact Factor
2022: 0.5
Five Year: 0.8
Journal is Indexed in

Cabells Whitelist
![]()


