Design of Experiments Approach for Method Development and Validation of Bilastine in Pure and Pharmaceutical Dosage form Using RP-UFLC
Sivasanker Reddy Lingareddygari1*
, Nageswara Rao Ravikrindhi1, Ishaq Mohammed Beludari2, Dastagiri Reddy Yennam3, Madana Gopal Nookala1 and Surendra Kammari1
1Department of Pharmaceutical Analysis, Santhiram college of pharmacy, NH-40, Nandyal-518501, Kurnool, Anadhra Pradesh, India.
2Department of Pharmacy, University of technology and applied sciences, Al-Khuwair, Muscat, Sultanate of Oman.
3Department of Pharmaceutics, Santhiram college of pharmacy, NH-40, Nandyal-518501, Kurnool, Anadhra Pradesh, India.
Corresponding Author E-mail: shiva_s_rl@yahoo.co.in
DOI : http://dx.doi.org/10.13005/ojc/390325
Article Received on : 29 Apr 2023
Article Accepted on : 10 Jun 2023
Article Published : 22 Jun 2023
Reviewed by: Dr. Saranjit Singh
Second Review by: Dr. Gavat Cristian
Final Approval by: Dr. Masoom Raza Siddiqui
Background: The Bilastine is a H1 receptor antagonist, used in the treatment of allergic urticaria, seasonal rhinitis etc. Few journals have reported the analytical related work on bilastine drug. Objective: The objective of the work is to develop a simple, precise, rapid and reproducible method, using design of experiments (DOE) and check the optimized conditions when run on Ultra Flow Liquid Chromatography(UFLC) would give the best method or not. Results: The DOE software was used to select optimized conditions with minimal runs. The central composite design was the best fit, with two variables that include flow rate and column temperature. A total of 13 runs gave optimum conditions of 1.2 ml/min flow rate, column temperature of 40°C and mobile phase-methanol: buffer (pH 6.0) in the ratio of 70:30 in the binary mode using the Shimadzu C18 column on an HPLC instrument. The retention time of bilastine was found to be 5.126min, the number of theoretical plates and asymmetric factor being within the limit. The proposed method was validated as per the ICH Q2R1 guidelines. The linearity was found to be in the range of 1.25µg/ml-10µg/ml. The correlation coefficient was found to be within the limits i.e., R2= 0.999. The accuracy of the current method was being performed using the % recovery at three stages 50%, 100%, and 150% and was found to be 99.5126%, 100.2765% and 99.6714% respectively. The LOD and LOQ of the bilastine was found to be 0.2094µg/ml and 0. 6346µg/ml.
Conclusion: The DOE software reduced the number of trials, saving both time and solvents consumption. This method can be conveniently used with confidence for regular assay, which is simple, precise, rapid and reproducible one for the estimation of bilastine in pure and pharmaceutical tablet dosage form using UFLC.
Bilastine; Design of Experiment(DOE); ICH Q2R1 guidelines; Mdethod development; RP-UFLC
Download this article as:| Copy the following to cite this article: Lingareddygari S. R, Ravikrindhi N. R, Beludari I. M, Yennam D. R, Nookala M. G, Kammari S. Design of Experiments Approach for Method Development and Validation of Bilastine in Pure and Pharmaceutical Dosage form Using RP-UFLC. Orient J Chem 2023;39(3). |
| Copy the following to cite this URL: Lingareddygari S. R, Ravikrindhi N. R, Beludari I. M, Yennam D. R, Nookala M. G, Kammari S. Design of Experiments Approach for Method Development and Validation of Bilastine in Pure and Pharmaceutical Dosage form Using RP-UFLC. Orient J Chem 2023;39(3). Available from: https://bit.ly/3ppPYhj |
Introduction
Bilastine is a new oral antihistaminic drug which is used for the treatment of seasonal allergic rhinitis and urticaria. The tablet dosage form of bilastine available in 20mg. The mechanism of action of bilastine is inhibition of the production of immune system reactions by binding on the peripheral H1 receptors. Many but not all immune system reactions mediated by the release of Histamine can be controlled by this drug. It has moderate to high affinity for the histamine H1 receptors.
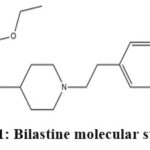 |
Figure 1: Bilastine molecular structure |
Quality by design is the trend in most of the fields of Science and Technology. Use of different softwares which simulate the practical experiments has helped the scientific community to save the time and the money by minimizing the number of experiments in a project. In this study, we have used design of experiments to run few trials and obtain the optimum conditions to develop method, validate the same for the drug bilastine in its pure and dosage form using high performance liquid chromatography. Many papers have published the use of such softwares(Design of experiments); Sharma G, Thakur K, Raza K, Katare O.P together published an article related to the use design of experiments for establishing the approximate parameters to begin the method development[1]. Shakya A.K applied Quality by Design to develop method fot the estimation of Valsartan and Hydrochlorthiazide[2]. Simultaneous determination of levetiracetam and pyridoxine HCl in prepared tablets using the quality by design was reported by Hashem H and his colleagues[3]. Basso J and his team used the Analytical Quality by Design Approach for the Disulfiram Assay[4]. The method development and validation of the drug methotrexate using high performance liquid chromatography (HPLC) was established with the aid of design of experiments [5]. A monograph of the drug was retrieved from the “Indian Practitioner” Journal [6-7]. Very few methods were reported for the estimation of Bilastine drug of which Mr.V. Amarendra Chowdary and his colleages developed RP-HPLC method for quantification of Bilastine using mobile phase methoanol, water in the ratio of 60:40[8]. A. M. Beltagi and his team usedbuffer pH 6.0, acetonitrileand, methanol (50:25:25) as the mobile phase[9]. R. Ouarezki and his members studied Bilastine degradation under degradation studies[10]. Pardeshi P. P, Gaware V. M., Dhamak K. B. have used methanol and orthophosphoric acid as mobile phase[11]. Peethala Prathyusha, Raja Sundararajan, Palyam Bhanu, Mathrusri Annapurna reported a method HPLC method in which formic acid and methanol was used in equal proportions[12]. A few more drugs were also reported in the journals about their analytical development along with usage of the quality by design software. Patel, K.Y and his members used QbD approach to develop HPLC method development and validation of ceftriaxone sodium[13]. Peraman, R and his research members applied quality by design approach in RP-HPLC method development for the assay of etofenamate in dosage forms[14]. Panda, S.S and his analytical department analytical quality by design (AQbD)-oriented RP-UFLC method in quantification of lansoprazole[15]. International Council for Harmonization (ICH Q2R1) guidelines were followed for method development and validation of the drug bilastine using the HPLC [16]. Full factorial design for development and validation of a RP-HPLC method for the estimation of Letrozole in Nano formulations was reported [17].
Analytical Method Validation:
An analytical procedure is the most important key in analytical method validation. Analytical procedures determine the characteristics of the drug product or drug substance. It also gives the acceptance criteria for the drug product or dug substance. The analytical method validation parameters include- Accuracy, Precision, Specificity, Linearity, Detection limit, Quantification limit, Robustness and Range.
Materials and Method
Materials
The drug bilastine was gifted from the apcure labs, Hyderabad. Methanol and water for HPLC were bought from Merck chemicals. KH2PO4 was of SD fine chemicals. The supplier of these chemicals is Bros Scientifics, Tirupati, Andhra Pradesh 517507. The Design of Experiments software was used for the prediction of optimal system suitability conditions. The weighings were done using Shimadzu balance of ATY model having 0.1mg capacity. The entire project was done on Shimadzu UFLC (20AD), Column- C18, 4.6X 250mm, 5µm (Shimadzu Shim-Pack GIST). The filters used for preparation of mobile phase were Durapore 0.22µm, while the filters for preparation of sample were 0.45µm-both being manufactured by Millipore. The sonicator used was SONICA supplied by Spincotech Pvt.Ltd. The Lab solutions software was used in the LC system. Bilastine API was obtained as a gift sample from APCURE Labs, Hyderbad, Andhra Pradesh. The Bilastine film coated tablets were procured from local pharmacy under the brand name BILAST, manufactured by Micro Labs Limited. A trial version of Design of Experiment; File version: 13.0.6.0, study type-Response surface methodology, design type-Central composite design was used.
Method
Preparation of kh2po4 buffer pH 6.0
A quantity of 8.5gm of KH2PO4 was weighed, transferred into a 1000ml volumetric flask, a small volume of water was added to dissolve KH2PO4 and made up to the mark of the 1000ml volumetric flask and adjusted the pH with 0.1N NaOH to obtain the pH at 6.0. Finally, the solution was filtered through vacuum filter using 0.45µm membrane filter then, the solution was kept in sonicator for 15 min to remove the dissolved gases.
Preparation of Mobile phase
To prepare mobile phase, 70ml of Methanol and 30 ml of prepared KH2PO4 (Potassium dihydrogen Orthophosphate) buffer pH 6.0 were mixed together to form in the ratio of 70:30.
Preparation of Standard solution
Initially, 10mg of bilastine Active Pharmaceutical Ingredient (API) was accurately weighed on analytical electronic balance, transferred into 10ml volumetric flask and using mobile phase, made up to the mark of 10ml volumetric flask. The mobile phase was prepared in the ratio of 70:30(v/v) using methanol and potassium dihydrogen orthophosphate buffer (pH 6.0). The solution was kept in sonicator for dissolving. From the above standard solution, 0.05ml(50µl) was taken with the help of the micropipette (1-100µl capacity) and transferred into an another 10ml volumetric flask and the prepared mobile phase was added up to the mark of the volumetric flask, mixed well, filtered through 0.45µm filter. The final concentration was found to be 5µg/ml.
Optimization of the method using DO
Initially, trial and error method were applied to obtain preliminary data of the method to be developed. Further, the central composite design with response surface methodology was employed for the optimization of experimental conditions of the method. The independent factors used were two levels resulting in total 13 experimental runs were shown in Table 1. The factors selected were flow rate and column temperature while the responses include were retention time, theoretical plates and tailing factor. The linear polynomial equations are generated from ANOVA (Analysis of Variance), depicted below.
Table 1: Central composite design runs.
|
Runs
|
Factors
|
Responses
|
|||
|
|
Flow rate(ml/min)
|
Column temperature(°C)
|
Retention time |
Theoretical plates
|
Tailing factor
|
|
1 |
0.90 |
37.50 |
06.100 |
4032 |
1.172 |
|
2 |
0.60 |
40.00 |
09.032 |
5382 |
1.203 |
|
3 |
0.90 |
37.50 |
06.100 |
4032 |
1.172 |
|
4 |
1.32 |
37.50 |
04.282 |
2956 |
1.131 |
|
5 |
0.90 |
37.50 |
06.100 |
4032 |
1.172 |
|
6 |
0.60 |
35.00 |
09.290 |
6052 |
1.249 |
|
7 |
0.90 |
37.50 |
06.100 |
4032 |
1.172 |
|
8 |
0.90 |
33.00 |
06.177 |
3936 |
1.152 |
|
9 |
0.90 |
41.00 |
06.103 |
4167 |
1.147 |
|
10 |
0.47 |
37.50 |
11.459 |
5782 |
1.238 |
|
11 |
0.90 |
37.50 |
06.100 |
4032 |
1.172 |
|
12 |
1.20 |
35.00 |
04.696 |
3141 |
1.142 |
|
13 |
1.20 |
40.00 |
05.126 |
4221 |
1.140 |
The optimized factors include flow rate of 1.2 ml and column temperature of 40°C were selected as the retention time, theoretical and tailing factor was best for these combinations.
From the model summary statistics, it was concluded that quadratic equation best suits for this study. The equation to interpret the relation between the factors and the responses is as follows
Retention time = 6.10 – 2.34A – 0.0041B + 0.1470AB + 0.88672A2 + 0.0214B2
where A is flow rate and B is temperature
Theoretical plates = 4032 – 1008.57A – 92.09B + 437.50AB + 290.69A2 + 131.94B2
where A is flow rate and B is temperature
Taling factor = 1.17 – 0.0402A – 0.0069B + 0.0110AB + 0.0104A2 – 0.0071B2
where A is flow rate and B is temperature
System suitability
System suitability was performed by taking six replicates of the prepared concentration i.e., 5µg/ml, the six replicates were injected into HPLC (High Performance (or) Pressure Liquid Chromatography) setting the optimized conditions and finally the peak areas, retention times, tailing factors, theoretical plates, peak heights were noted from the chromatograms.
Specificity
Preparation of standard solution
Followed the same procedure as mentioned in the system suitability. The optimized concentrations i.e., 5µg/ml were prepared, filtered, injected and the peak responses were noted.
Sample solution preparation
10 tablets of bilastine were taken, each tablet was weighed individually and the average weight of 10 tablets was calculated i.e., 113.23mg. The equivalent weight to 10mg was calculated from the average weight of the 10 tablets and label claim and the equivalent weight was found to be 56.615mg. Next 56.615 mg of bilastine powder was weighed accurately, transferred into 10 ml volumetric flask, made up to the mark of the volumetric flask using mobile phase, mixed well, the solution was filtered through 0.45µm filter sonicated finally. Six optimized concentrations were prepared from the above stock solution. The concentrations were injected into the HPLC and the peak responses were clearly noted.
Linearity
Preparation of stock solution
An amount of 10mg of bilastine API was accurately weighed and transferred to 10ml volumetric flask, the mobile phase was made up to the mark of volumetric flask, it becomes 1000µg/ml, then the solution was kept in sonicator to dissolve the bilastine completely. The suitable dilutions were made(25.0, 33.75, 50.0, 62.5, 75.0 and 100µl solutions were pipetted from 1000µg/ml solution and diluted to 10ml in 10 ml volumetric flask) to obtain the following concentrations of 2.5µg/ml, 3.75µg/ml, 5µg/ml, 6.25µg/ml, 7.5µg/ml, 10µg/ml and were filtered through 0.45µm filter, sonicated for 5min, then the concentrations were injected into the UFLC after that the peak responses were noted. Finally, a graph was plotted between the area on x-axis and concentrations on y-axis.
Precision
Preparation of sample solution
Followed the same procedure for the preparation of samples as mentioned in the specificity. Two types of precisions were performed here, they are
Intraday precision
Interday precision
Intra-day precision
Intraday precision was preformed within a day at 3 stages, for every 3 hours 9AM, 12PM and 4PM.
The optimized concentrations 5µg/ml was prepared from the stock solution and six replicates of it were injected into HPLC and the peak responses were noted. The %RSD was measured from the six replicates.
Inter-day precision
Interday precision was performed on 3 days consecutively. In this, one optimized concentration (5µg/ml) was prepared from the stock solution and six replicates of it were injected into HPLC on 3 days consecutively. The peak responses were noted individually, the %RSD was calculated.
Accuracy
Preparation of sample solution
10 tablets of bilastine were weighed accurately, and the average weight of 10 tablets was calculated. The equivalent weight of tablet powder to 10mg was calculated i.e., 56.615mg. Then, 56.615mg of tablet powder was weighed, transferred into 10 ml volumetric flask and made up to the mark of the volumetric flask using mobile phase. The powder was dissolved and kept in sonicator for dissolving and filtered through 0.45µm filter. To perform accuracy, a series of 50%, 100%, and 150% sample solutions were prepared.
50% sample solution
Pipette out 0.05ml from the above solution(1000µg/ml) into 10 ml volumetric flask, to this 0.025ml of standard stock solution(1000µg/ml) was added and made up to the mark with mobile phase, filtered, sonicated and six replicates of it were injected into the HPLC and the peak responses were noted clearly.
100% sample solution
Pipette out 0.05ml from the above solution(1000µg/ml) into 10 ml volumetric flask, to this 0.05ml of standard stock solution(1000µg/ml) was added and made up to the mark with mobile phase, filtered, sonicated and six replicates of it were injected into the HPLC and the peak responses were noted clearly.
150% sample solution
Pipette out 0.05ml from the above solution(1000µg/ml) into 10 ml volumetric flask, to this 0.075ml of standard stock solution(1000µg/ml) was added and made up to the mark with mobile phase, filtered, sonicated and six replicates of it were injected into the HPLC and the peak responses were noted clearly.
Limit of Detection (LOD)
LOD= 3 × standard deviation/ slope
Limit of Quantification (LOQ)
LOQ= 10 × standard deviation/ slope
Robustness
The robustness was done by changing the parameters such as wavelength, flow rates, and temperature. The optimized concentrations(5µg/ml) were prepared from the stock solution. The flow rate was changed to 1.0ml/min, 1.2ml/min and 1.4ml/min respectively. The wavelength was set to 280nm, 282nm and 284nm. The column temperatures were tuned to 37°C, 40°C and 43°C. The peak responses were noted after injecting the sample into the HPLC for all the changes of flow rate, wavelength and column temperature.
Degradation Studies (or) Stability Studies
Degradation studies were performed to know the stability time period of the tablet. These studies were performed using four degradations methods, they are
- Acid degradation method
- Base degradation method
- Hydrogen peroxide degradation method
- Degradation by using UV light
Acid degradation method
A volume of 0.05ml of sample solution was taken into 10 ml volumetric flask from the prepared stock solution, to this 3ml of 0.1M HCl (Hydrochloric Acid) was added and kept it over heating mantle at 50°C for 15min and cooled. To this cooled solution, 3ml of 0.1N NaOH (Sodium Hydroxide) was added to neutralize the solution and made up to the mark with mobile phase, injected into HPLC and the peak responses were noted.
Base degradation method
The procedure for the base degradation is same as acid degradation procedure except for the use of acid and base is vice versa.
h2o2 degradation method
A volume of 0.05ml of sample solution was taken in 10 ml volumetric flask from the prepared stock solution, to this 3ml of 3% h2o2 (Hydrogen Peroxide) was added and made up to the mark of the volumetric flask using mobile phase, then the solution was kept in room temperature for 12 hours. Finally, the solution was injected into the HPLC and the peak responses were noted.
Degradation by using UV light
A volume of 0.05 ml of sample solution was taken from 10 ml volumetric flask containing the stock solution and made up to the mark of the volumetric flask using mobile phase to obtain 5µg/ml This solution was kept under UV light of 254nm for 72 hours. After elapsed time, the solution was directly injected into the HPLC and the peak responses were noted.
Results and Discussion
Determination of wavelength
The standard solution of Bilastine (10µg/ml) was scanned in UV range of 200-800 nm using the solvent (Methanol and kh2po4 buffer at pH 6.0 in the ratio of 70:30). The bilastine solution showed the maximum absorbance at 282 nm, which was selected as the λmax of the bilastine drug.
 |
Figure 2: λmax Spectrum of Bilastine in mobile phase (Methanol:Buffer=70:30). |
Table 2: ANOVA results.
|
S.no |
Responses |
Retention time |
Theoretical plates |
Tailing factor |
|
1 |
±SD |
0.2085 |
261.68 |
0.0107 |
|
2 |
Mean |
6.6600 |
4292.08 |
1.17 |
|
3 |
%CV |
3.1300 |
6.10 |
0.9092 |
|
4 |
Press |
2.1600 |
3.409E+06 |
0.0057 |
|
5 |
r2 |
0.9939 |
0.9525 |
0.9496 |
|
6 |
Adjusted r-square |
0.9895 |
0.9186 |
0.9136 |
|
7 |
Predicted r-square |
0.9566 |
0.6625 |
0.6416 |
|
8 |
Adequate precision |
47.0711 |
17.5684 |
16.3531 |
|
9 |
p-value |
<0.0001 |
0.0002 |
0.0002 |
The p value is less than 0.0001 which suggests that the selected model best fits the study. The predicted r2 value and adjusted r2 valueare for retention time are quite closer.
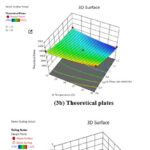 |
Figure 3: (3D plots of ANOVA results). |
 |
Figure 4: (Normal plots of ANOVA results). |
Analytical Method Development
The DOE software has shown to perform 13 runs. The trial with flow rate1.2ml and column temperature of 40°C was selected as the optimized conditions. The peak passed all the system suitability parameters. Further, validation parameters were performed following ICH Q2 R1 guidelines.
Table 3: Optimized method.
|
S. No |
Parameter |
Conditions |
|
1. |
Mobile phase |
Methanol and kh2po4 buffer at pH 6.0 (70:30) |
|
2. |
Column |
C18, 4.6X 250mm, 5µm (Shimadzu Shim-Pack GIST) |
|
3. |
Flow rate |
1.2ml/min |
|
4. |
Column oven temperature |
40°C |
|
5. |
Detection of wavelength |
282 nm |
|
6. |
Run time |
6.5min |
|
7. |
Retention time |
5.126min |
|
8. |
Concentration |
5µg/ml |
|
9. |
Injection volume |
20µL |
 |
Figure 5: Bilastine chromatogram. |
Single peak was eluted, the retention time, theoretical plates, peak area, peak height, all parameters were good, so the method was optimized.
Table 4: Linearity.
|
S. No. |
Linearity level (%) |
Concentration |
Peak area |
|
1. |
25% |
1.25µg/ml |
56526 |
|
2. |
50% |
2.50 µg/ml |
82783 |
|
3. |
75% |
3.75 µg/ml |
108088 |
|
4. |
100% |
5.00 µg/ml |
133849 |
|
5 |
125% |
6.25 µg/ml |
155855 |
|
6. |
150% |
7.50 µg/ml |
181249 |
|
7. |
200% |
10.0 µg/ml |
227900 |
Linearity was found in between the range of 1.25-10µg/ml.
 |
Figure 6: A graph represents linearity of Bilastine. |
A graph was plotted between the concentration on x-axis vs. peak area on y-axis and R2 was obtained 0.999 in the graph which was found to be within the limit. Based upon the above limits the linearity was passed.
Analytical method validation
Analytical method validation parameters were performed following ICH Q2R1 guidelines and limits are; specificity: no interference; linearity: R2=0.999-1.0; accuracy:98-102%; precision: Relative Standard Deviation (RSD)<2%; Detection Limit: S/N ˃2 or 3; Quantification limit :S/N ˃10; Robustness: % Assay 99-102%.
Table 5: System Suitability.
|
S. No. |
Peak Area |
Retention time |
Theoretical plates |
Peak height |
Tailing factor |
|
1. |
158524 |
5.117 |
4252 |
13816 |
1.14 |
|
2. |
157219 |
5.136 |
4243 |
13576 |
1.14 |
|
3. |
159711 |
5.084 |
4217 |
13959 |
1.14 |
|
4. |
159281 |
5.140 |
4227 |
13790 |
1.14 |
|
5. |
160764 |
5.154 |
4219 |
13869 |
1.14 |
|
6. |
161097 |
5.236 |
4350 |
13879 |
1.14 |
|
Average |
159432.67 |
5.140 |
4251.33 |
13814.83 |
1.14 |
|
STDEV |
1440.064 |
0.051 |
50.242 |
130.763 |
0.002 |
|
%RSD |
0.90 |
0.99 |
1.18 |
0.95 |
0.15 |
The % RSD and standard deviation were calculated and the values were found within the limits.
Precision
Table 6: Intermediate precision.
|
S. No. |
Day-1 |
Day-2 |
Day-3 |
|
|
Peak area |
||
|
1. |
157489 |
157044 |
157281 |
|
2. |
157092 |
157140 |
157175 |
|
3. |
157059 |
156852 |
155097 |
|
4. |
157646 |
157444 |
156227 |
|
5. |
157289 |
156838 |
156275 |
|
6. |
157552 |
158436 |
156249 |
|
Average |
157354.50 |
157292.33 |
156384.00 |
|
STDEV |
246.00 |
602.69 |
792.64 |
|
%RSD |
0.16 |
0.38 |
0.51 |
The % RSD is within the limits and hence passed intermediate precision.
Table 7: Intra- day precision.
|
S. No. |
9:00 AM |
1:00 PM |
5:00 PM |
|
|
Peak area |
||
|
1. |
150621 |
153384 |
155569 |
|
2. |
151360 |
154340 |
150217 |
|
3. |
150257 |
159664 |
159155 |
|
4. |
151570 |
158801 |
155635 |
|
5. |
153546 |
156082 |
156733 |
|
6. |
151953 |
152170 |
154311 |
|
Average |
151551.17 |
155740.17 |
155270.00 |
|
STDEV |
1159.12 |
3004.67 |
2963.40 |
|
%RSD |
0.76 |
1.93 |
1.91 |
The intraday precision % RSD is also within limits, thus passed the test for intraday precision
Accuracy
Table 8: at 50% accuracy.
|
S. No. |
Concentratioof sample (µg/ml) |
Concentration of standard added(µg/ml) |
Concentration recovered (µg/ml) |
% Recovery |
|
1 |
5.0 |
2.5 |
2.5053 |
100.3773 |
|
2 |
2.4640 |
98.7262 |
||
|
3 |
2.4815 |
99.4273 |
||
|
4 |
2.5046 |
100.3521 |
||
|
5 |
2.4463 |
98.0162 |
||
|
6 |
2.5002 |
100.1762 |
At 50% accuracy level, mean % recovery 99.5126% is well within the prescribed range.
Table 9: For 100% accuracy.
|
S. No |
Concentratioof sample (µg/ml)) |
Concentration of standard added(µg/ml) |
Concentration recovered (µg/ml) |
% Recovery |
|
1 |
5.0 |
5.0 |
5.0316 |
100.7995 |
|
2 |
4.9989 |
100.1448 |
||
|
3 |
4.9860 |
99.8853 |
At 100% accuracy level, mean % recovery 100.2765% is also well within the mentioned limit.
Table 10: At 150% accuracy
|
S. No |
Concentratioof sample (µg/ml)) |
Concentration of standard added(µg/ml |
Concentration recovered (µg/ml) |
% Recovery |
|
1 |
5.0 |
7.5 |
7.4626 |
99.6673 |
|
2 |
7.4636 |
99.6807 |
||
|
3 |
7.4636 |
99.6799 |
||
|
4 |
7.4638 |
99.6828 |
||
|
5 |
7.4626 |
99.6678 |
||
|
6 |
7.4613 |
99.6497 |
At 150 % accuracy level, mean % recovery 99.6714%.
The mean % recovery was calculated and found to be within the limits (98-102%). By based upon the above results the accuracy test was passed.
Robustness.
Table 11: Robustness
|
S. No. |
Parameter |
Condition |
Peak area |
% Assay |
|
1 |
Flow rate |
1 ml |
159077 |
99.78 |
|
2 |
1.2 ml |
159433 |
99.83 |
|
|
3 |
1.4 ml |
156431 |
98.12 |
|
|
4 |
Wavelength |
280 nm |
157178 |
98.59 |
|
5 |
282 nm |
159433 |
100.00 |
|
|
6 |
284 nm |
156735 |
98.31 |
|
|
7 |
Temperature |
37°C |
157767 |
98.96 |
|
8 |
40°C |
157816 |
98.99 |
|
|
9 |
43°C |
158732 |
99.56 |
The % assay was calculated from the different conditions and the values were found within the limit, so test for robustness was passed.
Degradation studies
Table 12: Degradation studies (or) stability studies.
|
S. No. |
Condition |
Peak area |
% Assay |
% Degradation |
|
1 |
Acid |
143091 |
89.750 |
10.25 |
|
2 |
Base |
145500 |
91.261 |
8.7390 |
|
3 |
H2O2 |
143032 |
89.713 |
10.287 |
|
4 |
UV |
146332 |
91.783 |
8.217 |
In the degradation studies, the optimized concentration of dosage form was degraded by different conditions. The method still can quantify the amount of the drug present after degradation also.
Limit Of Detection (LOD) and Limit of Quantification (LOQ)
For LOD-Standard Deviation from system suitability= 2155.81; Correlation coefficient, R2= 0.994; Slope from Linearity= 33971and LOD was 0.2094µg/ml. For LOQ-Slope= 33971; Standard deviation= 2155.81 and the LOQ was 0.6346µg/ml.
Assay
Table 13: Assay
|
S. No |
Peak area |
% Assay |
|
1 |
159968 |
100.336 |
|
2 |
158428 |
99.370 |
|
3 |
158434 |
99.374 |
|
4 |
159071 |
99.773 |
|
5 |
159592 |
100.100 |
|
6 |
159512 |
100.050 |
|
Average |
159167.50 |
99.83 |
|
STDEV |
637.79 |
0.40 |
|
% RSD |
0.40 |
0.40 |
The percentage of assay was found to be within the limits- 98%-102%.
Conclusion
A method for the estimation of Bilastine in API and its tablet dosage form was developed using RP-UFLC. The method was successfully validated following ICH Q2R1 guidelines. Before physically working on the instrument, the DOE software was used to obtain the optimized conditions with an input of flow rate and column temperature as the variables. The thirteen-runs were given by the software and from that we have chosen the best variable conditions satisfying the Q2R1 guidelines. The linearity was in the range of 1.25µg/ml to 10µg/ml, and the theoretical plates were found well beyond 2000. The %RSD for accuracy, precision, and robustness were all found <2% which indicates that the parameters are within the limits of the guidelines. The LOD & LOQ were found to be 0.292µg/ml and 0.974µg/ml respectively. The degradation studies were also performed to the tablet dosage form. The % assay was found to be within the limits 98%-102%. The linearity range is more in the developed method when compared with the already reported methods. The mobile phase used is methanol and buffer which are comparatively cheaper than most solvents used in the literature. Thus, we can consider that this method as sensitive, economical, reproducible and considerably rapid in the assay of bilastine in API and dosage form.
Acknowledgement
The authors thank the principal and management of the Santhiram college of Pharmacy for providing the facilities to complete the project.
Conflict of Interest
All the authors have made significant contributions in completion of the project. The authors declare that they have no conflict of interests. This work is not sponsored by any government or non government organizations and is purely self financed.
References
- Sharma, G.; Thakur, K.; Raza, K.; Katare, O.P. Stability kinetics of fusidic acid: development and validation of stability indicating analytical method by employing analytical quality by design approach in medicinal products. J Chromatogr B Analyt Technol Biomed Life Sci. 2019, 1120, 113-124.
CrossRef - Shakya, A.K. Development and Validation of a Stability-Indicating Liquid Chromatographic Method for Determination of Valsartan and Hydrochlorthiazide Using Quality by Design. Orient. J. Chem. 2016, 32(2), 777-788.
CrossRef - Hashem, H.; Elayed, H.M. Quality by design approach for development and validation of a RP-HPLC method for simultaneous determination of co-administered levetiracetam and pyridoxine HCl in prepared tablets. Microchemical J. 2018, 143, 55-63.
CrossRef - Basso, J.; Ramos, M.L.; Pais, A.; Vitorino, R.; Fortuna, A.; Vitorino, C. Expediting Disulfiram Assays through a Systematic Analytical Quality by Design Approach. Chemosensors. 2021, 9(172), 1-20.
CrossRef - Jain, A.; Beg, S.; Saini, S.; Sharma, T.; Katare, O.P.; Singh, B. Application of chemometric approach for QbD-enabled development and validation of an RP-HPLC method for estimation of methotrexate. J. Liq. Chromatogr. Relat. Technol, 2019, 42(15-16), 502-512.
CrossRef - Narayanan, V. Drug Profile: Bilastine. The Indian practitioner, 2019, 72(5), 45-47.
- National Center for Biotechnology Information. PubChem Compound Summary for CID185460: Bilastine. https://pubchem.ncbi.nlm.nih.gov/ compound/Bilastine. (Accessed-Sept. 26, 2021).
- Amarendra, C.V.; Anusha, K.; Muneer, S. Method development and validation of new RP-HPLC method for the estimation of Bilastine in pharmaceutical dosage form. World J Pharm Pharm Sci, 2017, 6(8), 2297-2315.
CrossRef - Beltagi, A.M.; Lashin, I.A.; Essa, W.A; Hathoot, A.A.; Azzem, M.A. Evolution and effectiveness of HPLC technique for rapid estimation of an antiallergenic agent bilastine. Asian J. Pharm. Ana., 2021, 11(2), 55-62.
CrossRef - Ouarezki, R.; Guermouche, S.; Guermouche, M.H. Degradation kinetics of Bilastine determined by RP-HPLC method and identification of its degradation product in oxidative condition. Chem. pap, 2020, 74(4), 1133–1142.
CrossRef - Pardeshi, P.J.; Gaware, V.M.; Dhamak, K.B. Development and Validation of RP-HPLC Method for the Estimation of Bilastine from bulk and Formulation. Asian J. Pharm. Anal, 2020, 10(2), 109-111.
CrossRef - Prathyusha, P.; Sundararajan, R.; Bhanu, P.; Mukthinuthalapati, M.A. A new stability indicating RP-HPLC method for determination of Bilastine in bulk and pharmaceutical formulation. Res. J. Pharm. Technol, 2020, 13(6), 2849-2853.
CrossRef - Patel, K.Y.; Dedania, Z.R.; Dedania, R.R.; Patel, U. QbD approach to HPLC method development and validation of ceftriaxone sodium. Future J. Pharm. Sci. 2021, 7(1), 1-10.
CrossRef - Peraman, R.; Bhadraya, K.; Reddy, Y.P.; Reddy, C.S.; Lokesh, T. Analytical quality by design approach in RP-HPLC method development for the assay of etofenamate in dosage forms. Indian J. Pharm. Sc., 2015, 77(6), 751-757.
CrossRef - Panda, S.S.; Ravi K.B.V.V.; Beg, S.; Mandal, O. Analytical quality by design (AQbD)-oriented RP-UFLC method for quantification of lansoprazole with superior method robustness. J. Liq .Chrom .Relat. Tech, 2017, 40(9), 479-485.
CrossRef - European Medicines Agency. ICH Topic Q2 (R1) Validation of Analytical Procedures: Text and Methodology. 1995.
- Hegde, A.R.; Managuli, R.S.; Naha, A.; Koteshwara, K.B.; Reddy, M. S.; Mutalik, S. Full factorial experimental design for development and validation of a RP-HPLC method for estimation of letrozole in nanoformulations. Curr. Pharm. Anal, 2018, 14(3), 320-330.
CrossRef

This work is licensed under a Creative Commons Attribution 4.0 International License.
About The Author
![]()
A New Edition of Web of Science
Journal Impact Factor
2022: 0.5
Five Year: 0.8
Journal is Indexed in

Cabells Whitelist
![]()


