Anaerobic/Oxic/Anoxic Mode Sequencing Batch Reactor: Treatment Performance and Development of Aerobic Granular Sludge
Mohd Rayaz1* , Fehmeeda Khatoon1 and Abid Ali Khan2
Department of Applied Sciences and Humanities, Jamia Millia Islamia (A Central University) New Delhi, 110025, India.
2Lab MiTE Group, Department of Civil Engineering, Jamia Millia Islamia (A Central University), New Delhi, 110025, India
Corresponding Author E-mail: mohdrayazpaswal1@gmail.com
DOI : http://dx.doi.org/10.13005/ojc/390302
Article Received on : 02 May 2023
Article Accepted on : 11 Jun 2023
Article Published : 22 Jun 2023
Reviewed by: Dr. Vasi Uddin Siddiqui
Second Review by: Dr. Afzal Ansari
Final Approval by: DR. Ravindra M Kumbhare
Objective: The objective of the present work was to reduce the start-up time of aerobic granular sludge (AGS) formation using medium-strength sewage and to find the most effective anaerobic, aerobic (oxic), and anoxic (A/O/A) cyclic time distribution over the 6-hour cycle time for the removal of nutrients. Methods: A rectangular sequencing batch reactor (SBR) operated systematically in A/O/A cycle was designed for AGS formation. In order to achieve complete nutrient removal, the anoxic phase (5% of the total cycle duration) was introduced in the SBR cycle. Results: Growth in the biomass profile was observed after 20 days of operation, and complete granulation was achieved within 35 days of operational studies. Regular-shaped, compact granules with visible outlines and clear boundaries predominate inside the system, with an average particle size of 220.19 µm. The A/O/A system achieved average removal efficiencies of 70.02 ± 5.98%, 78.21 ± 18.66%, 60.62 ± 9.69%, and 53.49 ± 8.14% for COD, NH4+-N, TN, and PO43--P, respectively. The reasons for poor COD and PO43--P removal
performance were the short anaerobic phase (25% of total cycle duration of 6 hours) and higher biomass concentration. However, the long aerobic phase (60% of total cycle duration of 6 hours) with the anoxic phase achieved outstanding (100%) NH4+-N removal efficiency after the system reached a steady state. SEM results inferred that rod-shaped bacteria, cocci, and filamentous fungi were the dominant microorganisms found within the cultivated granules. Conclusions: Sewage with a high COD loading rate accelerates AGS formation and development within an A/O/A cycle SBR reactor. The rapid granulation and simultaneous removal of organics and nutrients by the A/O/A mode SBR without any support materials provide an alternative for wastewater treatment.
Aerobic granules; Aerobic granular sludge; Anaerobic; Oxic; Sequencing Batch Reactor
Download this article as:| Copy the following to cite this article: Rayaz M, Khatoon F, Khan A. A. Anaerobic/Oxic/Anoxic Mode Sequencing Batch Reactor: Treatment Performance and Development of Aerobic Granular Sludge. Orient J Chem 2023;39(3). |
| Copy the following to cite this URL: Rayaz M, Khatoon F, Khan A. A. Anaerobic/Oxic/Anoxic Mode Sequencing Batch Reactor: Treatment Performance and Development of Aerobic Granular Sludge. Orient J Chem 2023;39(3). Available from: https://bit.ly/3Np8nTs |
Introduction
Aerobic granular sludge (AGS) is an excellent alternative technology for treating both low- strength and high-strength wastewater. Up to now, various biological wastewater treatment processes have been implemented at full scale in the field and at lab scale for industrial and municipal wastewater treatment 1-5. The activated sludge process (ASP) is considered
one of the best conventional biological treatment approaches as it utilizes microorganisms to eliminate biodegradable contaminants found in different types of wastewaters. However, AGS offers several advantages over conventional activated sludge (CAS) systems. These advantages include outstanding settling properties, a compact microbial structure, the potential for nutrient recovery, the ability to handle high organic loading rates (OLRs), high efficiency in removing organics and ammonia, reduced electricity requirements (23–40%), lower operation costs (20–25%), and decreased space requirements (50–75%) compared to CAS systems 4-7.
However, the long start-up periods and instability during long-term operation are some of the major factors that hindered the wide application of AGS based wastewater treatment plants (WWTPs). The previous studies reported that a minimum of 25–35 days were required to achieve complete granulation from CAS if no support material was applied 4. Moreover, the high costs associated with operation and maintenance pose further obstacles to the widespread growth of AGS technology. Therefore, it is crucial to explore methods that can accelerate the granulation system while focusing on cost savings and resource consumption 1.
The AGS was commonly used in sequencing batch reactors (SBRs) for the treatment of low- strength and high-strength wastewater. The typical operation regime of an SBR involves several steps, including filling, reaction (consisting of aerobic, anaerobic, and oxic phases), and decanting or removing the effluent from the SBR [8]. The cycle types are very important factors in determining treatment performance, stability, and the generation of AGS in SBRs 18-10. Anaerobic, aerobic (oxic), and anoxic (A/O/A) cycles were introduced a few decades ago with the aim of enriching microbial communities for the simultaneous removal of organics and nutrients throughout the granulation process 11.
In A/O/A cycles, the oxic phase that follows the anoxic phase promotes the proliferation of denitrifying glycogen-accumulating organisms (DGAOs) and denitrifying phosphate- accumulating organisms (DPAOs) 8,12. It has been observed that in A/O/A cycles, the residual oxygen in the anoxic phase can effectively remove NH4+-N from the wastewater 13.. However, researchers have also noted that the competition between DGAOs and DPAOs for carbon sources can lead to low phosphorus removal and the accumulation of nitrite (NO2–N) and nitrate (NO3–N) in the effluents, as both groups of organisms require carbon sources 12,13.
Anaerobic slow feeding, also known as “filling,” is typically beneficial for slow-growing microorganisms such as glycogen-accumulating organisms (GAOs) and polyphosphate- accumulating organisms (PAOs) 11. The granulation process, involving the development of nitrifying bacteria, PAOs, and GAOs, can benefit from alternating anaerobic and aerobic conditions, as the growth of heterotrophic bacteria is hindered in the aerobic phase due to the lack of a carbon source 11.
In anaerobic and oxic (A/O) cycles, which involve an anaerobic phase along with an aerobic or oxic phase, a higher percentage of the oxic phase (accounting for 65% of the overall cycle length) has been found to promote the formation of granules with good settling ability and resistance 8. Conversely, long anaerobic or anoxic phases in A/O/A cycles resulted in the formation of puffy and unstable granules, despite their effectiveness in nutrient removal [8]. Previous studies have also reported that including medium aerobic phase duration (55% of the total cycle time) and short anoxic phase duration (10% of the total cycle time) in A/O/A cycles led to superior treatment performance and stability of granules in SBRs7,8.
Therefore, the objective of this study was to address the issue of long start-up times for AGS formation and optimize the distribution of cycle times as a cost-effective and environmentally friendly approach for organic and nutrient removal in wastewater treatment. In this work, we designed a novel strategy A/O/A mode SBR reactor in which the aeration period is fixed at 60% of the total cycle duration of 6 hours for complete nitrification and phosphorous sequestration. The remaining times were adjusted in the anaerobic and anoxic phases. This strategy reduced operational costs, specifically energy costs, while improving the removal efficiency of nutrients and organics matter.
Materials and Methods
Reactor configuration
A rectangular reactor was set up for the cultivation of AGS with a total volume of 20 litres and a working volume of 14 litres. The volume exchange ratio (VER) was 40%, and the hydraulic retention time (HRT) was fixed at 12 hours. The reactor configuration is depicted in Figs. 1 (a) and 2. The current study lasted for 60 days, whereby an alternating A/O/A mode SBR reactor was fed with sewage collected from the partition chamber of sewage treatment plant (STP) Bahadurgarh, Haryana, India. The cycle time was adjusted to 6 hours, which included the filling phase (20 minutes, or 5% of the total cycle duration), the anaerobic phase (90 minutes, or 25% of the total cycle duration), the oxic phase, or aerobic phase (216 minutes, or 60% of the total cycle duration), and the anoxic phase (18 minutes, or 5% of the total cycle duration), which is followed by settling and decanting for 10 minutes and 6 minutes, respectively.
The influent (sewage) was pumped into the A/O/A SBR reactor using a peristaltic pump (PP- 274-6A NEOLAB). Aeration was introduced into the reactor with an aquarium air pump (SB- 348A, SEBO) and dispersed by the four diffusers located at the base of the reactor. During the aerobic phase, mixing was carried out using an agitator at a constant speed of 40 rpm. The influent filling phase, anaerobic phase, and anoxic phase were considered static, without aeration and stirring. The whole automatic cyclic operation was regulated by the laptron timers. An effluent discharge port was located at an 8-cm height, through which treated effluent was discharged with the help of a solenoid valve (2W-160-15 AKARI). The AGS was not discharged throughout the operational studies. The highest lab temperature, DO during the oxic phase, influent pH, and effluent pH were monitored daily, typically in the ranges of 15-24 °C, 3-4 mg/L, 6.9-8.1, and 7.4-8.2, respectively.
Wastewater composition and seed sludge
The seed sludge used in this study was obtained from a 36 MLD STP in Bahadurgarh, Haryana, India, based on SBR technology. The seed sludge had a mixed liquor suspended solids (MLSS) concentration of 4490 mg/L and a mixed liquor volatile suspended solids (MLVSS) concentration of 2560 mg/L. On day 0 of the study, the reactor was seeded with
3.8 litres of aerobically cultivated sludge. The reactor was fed with sewage collected from the partition chamber after the fine screen of the UASB-based full-scale STP Bahadurgarh throughout the experimental studies. The average composition of sewage used as an influent in this experimental work was as follows: COD 818.01 ± 121.98 mg/L, BOD 353.33 ± 103.66 mg/L, PO43- -P 15.11 ± 1.54 mg/L, Total Nitrogen (TN) 63.99 ± 9.39 mg/L, SO42- 62.99 ± 98.72 mg/L, and S2- 8.71 ± 1.65 mg/L, respectively.
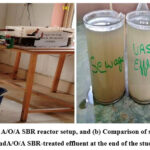 |
Figure 1: (a) A/O/A SBR reactor setup, and (b) Comparison of sewage, UASB effluent, and A/O/A SBR-treated effluent at the end of the study (Day 60). |
 |
Figure 2: Schematic flow diagram of SBR. |
Analytical methods
The influent (sewage) and lab-scale SBR reactor-treated effluent samples were collected twice a week for analysis. Parameters such as COD, TN (sum of NH4+-N, NO2- -N, NO3–N), PO43- -P, and SO42- were measured via spectrophotometer following the standard methods (APHA 2005). Meanwhile, alkalinity, BOD, and S2- concentrations were monitored by titration methods (APHA 2005). DO, pH, and temperature were regularly monitored using WTW Oxical SL probes, a pH meter, and a thermometer, respectively. To assess the biomass concentration in the reactor, MLSS, MLVSS, and the sludge volume index (SVI) were measured using the standard protocol for the examination of water and wastewater. The TSS and VSS were also evaluated according to the standard (APHA 2005) protocol. The settling velocity, formation, and development of granules were examined by particle size analysis, SV30, SV10, and SV5. The AGS size was measured through a Zeta potential analyzer.
Statistical methods
All analysis were carried out in triplicate, and the results were expressed as the mean value of triplicates. The data was statistically analyzed using Two-way analysis of variance (ANOVA) and Pearson correlation coefficient, etc., using Origin 2022.
Scanning electron microscopy (SEM)
SEM was performed at the Centre for Nanoscience and Nanotechnology, Jamia Milia Islamia, New Delhi, India, for the examination of microstructure, microbial communities, and morphology of biomass in the A/O/A cycle SBR reactor as described by M.W. Mirza et al., [14]. Two AGB samples were collected, one on day 0 seed sludge and another on day 60 mature granules in the reactor, immobilized onto a poly-L-lysine-coated glass slide, and allowed to air dry. After that, 2.5% glutaraldehyde was used to fix these dried samples, and stored in a freezer at 4 0C for twenty-four hours. Afterwards, phosphate buffer solution with pH of 7.4 was used to rinse these fixed samples in a centrifuge at a speed of 4000 rotations per minute (rpm) for a minute. The free-moving upper supernatant was discarded, and solid sludge samples were collected. After this step, double distilled water was utilized for the preparation of a graded ethanol series consisting of distinct proportions of 30%, 40%, 70%, and 100%, respectively. The samples were then dehydrated using a succession of increasing concentrations of ethanol, followed by drying in a hot air oven at 110 0C. Finally, these prepared samples were coated with gold (100 nm) and examined via scanning electron microscopy.
Fourier transform infrared spectroscopy (FT-IR)
An FTIR investigation was carried out to explore the functional groups. The FTIR spectra were acquired using potassium bromide (KBr) pellet techniques. The seed sludge used to start the SBR reactor and the mature AGS obtained after 60 days of operation were collected and dried in an oven. 2 mg of dried AGS sample was mixed with 250 mg of potassium bromide and ground into a fine powder. The mixture was then compressed into a pellet using a hydraulic press (Spectrachrome instrument CAP-15T). The prepared pellet was placed in the holder, and FT-IR spectra were obtained using an FT-IR instrument (Varian 7000 FTIR) at Jawaharlal Nehru University, New Delhi, India.
Results and Discussion
Formation and development of granules
Sewage or high-strength industrial wastewater contains various carbon sources along with different other pollutants such as particulate matter, endocrine disrupting agents, colloidal species, etc., which are not easily removed by biological treatment processes. The cultivation of AGS using real sewage leads to different morphological structures of granules, such as poorer physical strength and stability, and further effects on EPS composition and the microbial community when compared with AGS grown with synthetic wastewater. In this experimental work, we focused on developing granules in A/O/A cycle SBR reactor fed with real sewage. The formation and development mechanisms of AGS occurred in four stages: acclimating, shaping, developing, and finally maturing.
In the acclimating phase, the microbial communities within the granules were adjusted to the environmental conditions of a lab-scale reactor. After that, the color and shape of the granular sludge changed over time. The seed sludge used in this study was slightly black in color on day 0, as shown in Fig. 3 (a). When sewage was introduced into the reactor, the granules began to change color. On day 15, the entire sludge had turned brown, as shown in Fig. 3 (b), which turned a yellowish-brown color on day 20 of the experimental studies. AGS was mostly observed in yellow, but it was also seen in black [15]. According to F. A. Dahalan et al., [16], the yellow- brown morphology of granular sludge indicates the presence of aerobic microorganisms on the outer surface of the granules. During the initial stages of the study, minor amount of fine silt was present in the reactor along with particulate matter, which had adverse effects on the morphology, structure, shape, and size of the granules.
The average size of AGS was initially measured at 150.10 µm on day 0 using a particle size analyzer. During the initial start-up phase of operational studies (5-15 days), when the aeration phase ended, the entire reactor was filled with floccular sludge due to poor biomass settling velocity. However, after 20 days of operation, a few small, irregular granules were observed inside the reactor, indicating the initiation of granule growth. Afterward, a significant number of irregular granules were visible on day 25 of the study. Moreover, as a result of hydraulic shear force and aeration intensity, many round-shaped (regular) granules were observed in the reactor on day 34. At this stage, granules become dominant inside the reactor. The reactor ran continuously for 60 days. At the end of the study, 90% of the granules were regular, round-shaped, and exhibited a compact structure, with an average particle size of 220.19 µm.
 |
Figure 3: (a) Seed sludge (on day 0), and (b) AGS after 15 days of experimental work. |
Biomass profile and settling characteristics
The initial characteristics of seed sludge were determined as MLSS 4490 mg/L and MLVSS 2560 mg/L, with SVI 46.77 mg/L. Fig. 4 shows SVI, MLSS, and MLVSS concentration dynamics. The results reveal that during the initial start-up phase of the operational studies, both MLSS and MLVSS concentrations exhibited a decreasing trend. On day 6 of the experimental work, the MLSS was detected at 3990 mg/L, whereas the MLVSS was determined at 1890 mg/L. Subsequently, on day 20 of the operational study, the MLSS and MLVSS were measured to be 2450 mg/L and 1580 mg/L, respectively. During this period, a significant amount of floccular sludge was washed out with the treated effluent, resulting in a reduction of MLSS and MLVSS concentrations. This decrease was attributed to the collapse of AGS due to hydraulic pressure, causing the breakdown of fewer compact granules. Consequently, granules with low settling abilities were washed out from the reactor.
Fig. 4 indicates that the biomass profile started to increase after day 20 of the operational studies and continued to exhibit an increasing trend throughout the experimental period. At the end of the study, on day 60, a large amount of biomass had accumulated in the reactor, with MLSS and MLVSS concentrations reaching 8150 mg/L and 4330 mg/L, respectively. The abundant biomass concentration was observed because AGS was only discharged through effluent withdrawal, and 50 mL of sludge was taken twice a month during the aeration phase for biomass concentration analysis.
The settling velocity of the AGS was determined by calculating the SVI. The initial SVI value of the seed sludge used to inoculate the reactor was measured at 46.77 mL/g. During the initial start-up phase, the SVI values exhibited an increasing trend. On day 6, the SVI value was 57.64 mL/g, and it continued to increase until day 20, reaching 240.81 mL/g. As mentioned earlier, granules start growing after day 20 of the experimental work. As the granules formed, the SVI value decreased to 62.25 mL/g on day 34 of operation. At this stage, complete granulation was achieved within the system, with regular-shaped granules dominating and exhibiting good settling ability.
However, some of the granules disintegrated inside the reactor, causing a drop in MLSS concentration, and the SVI value increased to 95.04 mL/g on day 47 of the study. After 50 days of experimental work, growth in the biomass profile was observed, and the system reached a stabilized state. At the end of the study, compact, round-shaped granules became dominant within the system, demonstrating good settling ability. The SVI value was measured at 84.66 mL/g, indicating a significant decrease (p < 0.05) and suggesting an improvement in the settling properties of AGS. According to Y. Liu and Q. S. Liu. [11], an SVI below 80 mL/g in the SBR reactor indicates long-term stability and good settling ability of the AGS.
 |
Figure 4: Variation in biomass profile and settling properties. |
Reactor performance
Organics removal
Fig. 5 illustrates the concentration of COD in the influent and treated effluent, as well as the percentage of COD removal over time. The average influent COD concentration was observed to be 818.01 ± 121.98 mg/L, while the average COD concentration in the A/O/A SBR treated effluent was measured at 246.61 ± 59.72 mg/L throughout the operational study.
During the AGS start-up phase, the COD removal efficiency decreased from 82.39% on day 7 to 66.17% on day 14. This decrease was attributed to the washout of poor-settling granules. However, after day 20 of operation, the granules began to grow, and the removal percentage resumed to 68.12% on day 28. Afterward, no significant differences occurred in the removal efficiency.
In the stabilization period, after 30 days of the study, the biomass concentration increased, while the COD removal efficiency fluctuated between 66% and 69% on most of the days, as shown in Figures 4 and 5. At the end of the study, a COD removal percentage of 78.25% was achieved. The average COD removal percentage over the entire study period was 70.02 ± 5.98%.
It should be noted that the results obtained in this study differ from those presented by S. L. de S. Rollember et al., [8], where a COD removal efficiency of 90% was achieved in an A/O/A cycle SBR reactor. In the current study, the reactor was fed with medium-strength sewage containing COD of 818.01 ±
121.98 mg/L, including filling + anaerobic phase (30%), and aerobic phase (60%), over a 6- hour cycle duration. In contrast S. L. de S. Rollemberg et al., 8 used low-strength synthetic wastewater (COD 550 mg/L) along with filling + anaerobic phase (35%), and aerobic phase (55%), within a 6-hour cycle duration. This indicates that the shorter anaerobic phase in this study may have led to poorer COD removal performance.
Another possible reason for the lower organic removal efficiency could be the higher biomass concentration of approximately 7.7 g/L in the reactor. A. Alattabi et al. 17 have reported that an increase in biomass concentration from 4 to 6 g/L resulted in a 10% decrease in COD removal percentage. They also suggested that a higher biomass concentration reduces food-to-microorganism (F/M) ratio in SBR reactors, making them less effective in organic removal.
 |
Figure 5: COD removal performance. (Inf-Influent & Eff-effluent). |
Nutrient removal
The aerobic granular biomass in the system contains ammonium-oxidizing bacteria (AOB) and nitrate-oxidizing bacteria (NOB), which play a crucial role in the nitrification process. These bacteria oxidize NH4+-N to NO2- -N or NO3–N while simultaneously removing organic matter from the wastewater. In this study, the average concentrations of NH4+-N in the influent and A/O/A SBR treated effluent were found to be 42.5 ± 8.5 mg/L and 10.11 ± 9.11 mg/L, respectively, with corresponding removal percentages of 78.21 ± 18.66%.
During the start-up phase of the operational study, the NH4+-N removal percentages ranged from 56% to 58%. After day 17 of operation, there was a continuous increase in NH4+-N removal efficiency, indicating improvement within the system. This observation suggested that the system raised NH4+-N removal efficiency with the formation and development of granules. At the end of the stabilization period, after 30 days of experimental studies, the system achieved 100% NH4+-N removal efficiency.
The higher NH4+-N removal indicated the presence of enriched nitrifying bacteria (ammonium-oxidizing bacteria) in the reactor. These results differ from those reported by A. Alattabi et al.17, who observed an 11% decrease in NH4+-N removal rate with an increase in MLSS concentration from 4 to 6 g/L. However, the present study demonstrates that NH4+-N removal efficiency increased by 20% with biomass accumulation from 3 to 7 g/L inside the reactor. These findings suggest that increasing biomass concentration did not affect NH4+-N removal performance.
 |
Figure 6: NH4+-N removal performance. |
Fig. 7 shows significant differences in the removal of TN in the A/O/A cycle SBR reactor. The average TN concentration in the influent was observed to be 63.99 ± 9.39 mg/L, while in the treated effluent, it was 25.73 ± 8.75 mg/L. As mentioned earlier, complete NH4+-N nitrification occurred after the system reached a steady state. Additionally, the average NO2- – N concentration in the treated effluent was very low (1.42 mg/L), indicating complete nitrification.
These results are in agreement with the results reported by S. Rollemberg et al. [8], who observed that a minimum of 50% aerobic phase is required for complete nitrification in the treatment of medium- strength wastewater. However, complete denitrification did not occur, as a high amount of NO3–N was detected in the treated effluent. In the start-up phase of the study, 5-12 mg/L NO3–N was present inside the reactor, and its concentration increased in the treated effluent after the stabilization period, ranging from 15 to 22 mg/L until day 56 of the study. This accumulation of NO3–N in the treated effluent may be attributed to a higher level of NO3–N in the sewage.
The average removal of TN over the experimental studies was measured at 60.62 ± 9.69%. Overall, poor TN removal efficiency was observed in this experimental work due to the small size of the granules. The results reveal that complete nitrification and partial denitrification occurred after the stabilization period in the A/O/A cycle SBR reactor.
 |
Figure 7: Profile of Total Nitrogen (TN). |
The A/O/A cycle SBR performance for PO43–P removal is presented in Fig. 8. During the initial start-up phase of the operational studies, it was observed that the removal performance of PO43–P was reduced. On day 7, the PO43–P removal percentage was 66.66%, which decreased to 65.5% on day 14 and further to 43.75% on day 21 of the experiment. These findings suggest a decrease in PO43–P removal, which could be attributed to the washout of phosphate-accumulating organisms (PAOs) with low settling biomass. At this stage, MLSS results indicated that biomass washout occurred with the treated effluents.
After 30 days of experimental work, the system reached a steady state, and as a result, the PO43–P removal percentage continuously increased until the end of the study. Throughout the 60-day experimental period, the average PO43–P removal efficiency was measured at 53.49 ± 8.14%.
The overall poor removal of PO43–P can be attributed to the competition between phosphate- accumulating organisms (PAOs) and glycogen-accumulating organisms (GAOs). While GAOs metabolize carbon compounds and volatile fatty acids similar to PAOs, but GAOs are unable to accumulate PO43–P 7. Another likely factor is the absence of sludge discharge or withdrawal during the experimental work. According to 7, 18, PO43–P removal efficiency increases with the removal of old sludge from the bottom of the reactor.
The results obtained in this experimental study differ from those reported by S. L. de Sousa Rollemberg et al. 8, who observed 70% phosphorus removal in an A/O/A cycle SBR reactor fed with medium-strength synthetic wastewater, in which the average influent PO43--P concentration was 10 mg/L. In contrast, this study used sewage as a substrate, which had a higher average PO43--P concentration of 15.11 ± 1.54 mg/L.
 |
Figure 8: Profile of PO43- -P concentration in influent, effluent with removal percentage. |
Morphology of AGS
AGS samples were taken for the SEM analysis: (i) seed sludge on day 0, and (ii) final mature aerobic granular sludge on day 60 at the end of the experiments. The SEM results revealed changes in the physical and morphological properties of the sludge over time, as depicted in Figs. 9 (a) and 9 (b). Fig. 9 (a) illustrates the loose, irregular, and fluffy structure of the seed sludge used to start the system. In contrast, the mature granular sludge exhibited a regular shape and compact structure, with clear and visible outline boundaries for 90% of the granules, as shown in Fig. 9 (b).
Furthermore, the SEM results showed the presence of spherical-shaped cocci, coccobacillus, and bacillus rod-like bacteria in the seed sludge. Extracellular polymeric substances (EPS) were also observed within the system. The microbial diversity and morphology of AGS changed with the passage of time. At the end of the experimental period, mature granules were observed, where groups of rod-shaped bacteria compacted with each other to form single colonies. Some cocci and filamentous fungi were also embedded on the surface of the rod-shaped bacteria. These findings align with the results reported by O. T. Iorhemen et al.,19, who observed the dominance of rod-shaped bacteria such as Flavobacterium species, Azoarcus species, and Thauera species in similar systems. The dense microbial population facilitates simultaneous nutrient and organic matter removal. Additionally, it also makes cell surface less water- repellent and makes it easier for biomass to settle.
 |
Figure 9: (a) Seed sludge used as inoculum, and (b) Mature AGS at the end of the study (day 60). |
Fourier transform infrared spectroscopy (FT-IR) analysis
FTIR analysis was conducted to determine the functional groups and structure of proteins that were present in the seed sludge used to start the granulation process and analyze the functional groups that were responsible for the AGS development and treatment system. Two samples were taken: sample (I) represented the seed sludge used as inoculum on day 0, while sample (II) was taken at the final stages on day 60, after the completion of the experiments.
According to the findings of the FTIR analysis Fig. 10, the primary bands representing carbohydrate, carboxylic acid, nucleic acid, and amide groups were located in the range between 500 and 1700 cm-1. These functional groups were thoroughly investigated. The peak at 1454 cm-1 indicated the existence of carboxylic acid groups in both the seed sludge and the mature granules, suggesting the acidic nature of extracellular polymeric substances (EPS) 20. The amides (I), (II), and (III) were detected at the following frequencies: 1655 and 1646 cm-1, 1549 cm-1, and 1239 cm-1, respectively 21. Apart from this, the peaks at 2853 cm-1 and 2924 cm-1 were related to aliphatic methylene groups, and they served to stimulate the formation of lipids and fats 22. Additionally, the sharp bands within the wavelength range of 2800-3000 cm-1 are indicative of C-H stretching vibrations, which are characteristic of lipid constituents and can contribute to the formation of microbial films 23.
Lipids are a significant class of substances that are characterized by their low solubility in water and are typically located in sewage sludge. The presence of large bands at 1028 cm-1 indicates the degradation process of organic components in sewage 22. In addition, the absence of bands between 1300 -1400 cm-1 indicates the absence of functional groups (NO2– N and NH4+-N), which is beneficial for the nitrogen removal process 14. The FTIR spectra obtained from both samples show that the same primary components were present (at similar peak positions), but there was a difference in the degree to which they were enriched (the normalized peak absorbance value was different).
 |
Figure 10: FTIR spectra characteristics of seed sludge (on day 0) and mature granules (on day 60). |
Comparison of removal efficiency of different parameters
Fig. 11 shows the removal percentages of COD, alkalinity, NH4+-N, TN, and PO43–P at different times (days) over the experimental studies. Initially, the removal rates of COD decreased from 82.39% on day 7 to 66.17% on day 14, whereas the removal rates of TN increased from 48.81% to 52.41% on days 7 and 14, respectively. This decrease in COD removal profile was due to the discharge of biomass with poor settle ability, which could not resist the hydraulic shear forces in the start-up period 24,25. In the COD and TN removal rate comparison, results reveal that the removal rates of both parameters increased after granules started growing and remained in the same trend up to the end of the study. The overall removal rates of COD and TN all increased with the passage of time.
Similarly, the removal efficiency of NH4+-N and alkalinity showed a strong relationship. On day 14, the removal percentages of NH4+-N and alkalinity were 56% and 30%, respectively, and they exhibited a continuous increasing trend. On day 42, NH4+-N removal reached 100%, and alkalinity removal was found at 46.92%. After that, the NH4+-N removal rate remained constant at 100%, but the alkalinity removal rate declined to 37.44% on day 56. In the meantime, the alkalinity influent concentration was increased in sewage, which reduced the alkalinity removal rate. This result shows that the bloom of the nitrification process consumed more alkalinity from the sewage. Similar results were reported by S. Gao et al. ; Q. Su et al. 26,27.
Furthermore, a relationship can be observed between the removal rate of TN and the PO43–P. During the start-up period, the removal rate of TN increased from 48.81% to 63.86%, while the removal rate of PO43–P decreased from 66.67% to 43.75% on days 7 and 21, respectively. Likewise, COD and NH4+-N removal rates, TN and PO43–P removal rates were also found in the increasing trend after the development of granules. At the end of the study, the removal rates of TN and PO43–P were observed to be 80.17% and 54.85%, respectively. The statistical analysis (ANOVA) test confirmed that the TN and PO43–P removal rates were highly significant. The results of the Pearson correlation coefficient indicate that influent TN is positively correlated with effluent PO43–P (r2 = 0.71), whereas effluent TN is positively correlated with influent PO43–P (r2 = 0.74).
 |
Figure 11: Removal efficiency comparison. |
Analysis of variance (ANOVA) test
The ANOVA is a statistical method for comparing the total amount of variation in a set of data. Table 1 exhibits the ANOVA tests of the entire systematic variables of TN, alkalinity, COD, PO43–P, MLSS-MLVSS, and TN-PO43–P from A/O/A mode SBR reactor treatment performance. The two-way ANOVA test of TN removal performance turned to be highly significant with p-values < 0.05, while in the case of alkalinity, it was statistically non- significant with p-values > 0.05 (Table 1). Likewise, the ANOVA test of COD reduction and PO43–P removal in A/O/A reactor treatment performance is statistically non-significant with p-values > 0.05. However, in the case of MLSS-MLVSS dynamics over the experimental study, it was determined to be non-significant with p-values > 0.05 (Table 1). Furthermore, the TN-PO43–P assessment of A/O/A reactor treatment performance was found to be highly significant with p-values < 0.05. A similar study was conducted on the aerobic and anaerobic treatment of wastewater, and the statistical analysis results were comparable to the findings 28.
Table 1: ANOVA study of different treatment parameter of A/O/A mode SBR reactor
|
Total Nitrogen |
|
|||||
|
Source of |
SS |
df |
MS |
F |
P-value |
F crit |
|
Variation |
|
|
|
|
|
|
|
Rows |
1084.54 |
8 |
135.56 |
3.62 |
0.001 |
2.108 |
|
Columns |
29635.28 |
7 |
4233.61 |
113.34 |
1.06E-30 |
2.178 |
|
Error |
2091.70 |
56 |
37.35 |
|
|
|
|
Total |
32811.53 |
71 |
|
|
|
|
|
Alkalinity |
|
|
|
|
|
|
|
Source of |
SS |
df |
MS |
F |
P-value |
F crit |
|
Variation |
|
|
|
|
|
|
|
Rows |
52624 |
8 |
6578 |
2.47 |
0.110 |
3.438 |
|
Columns |
483472.22 |
1 |
483472.22 |
181.87 |
8.77E-07 |
5.317 |
|
Error |
21265.77 |
8 |
2658.22 |
|
|
|
|
Total |
557362 |
17 |
|
|
|
|
|
COD |
|
|
|
|
|
|
|
Source of |
SS |
df |
MS |
F |
P-value |
F crit |
|
Variation |
|
|
|
|
|
|
|
Rows |
111626.20 |
8 |
13953.27 |
3.104 |
0.064 |
3.438 |
|
Columns |
1469240.82 |
1 |
1469240.82 |
326.938 |
8.98569E-08 |
5.317 |
|
Error |
35951.53 |
8 |
4493.94 |
|
|
|
|
Total |
1616818.55 |
17 |
|
|
|
|
|
PO43--P |
|
|
|
|
|
|
|
Source of |
SS |
df |
MS |
F |
P-value |
F crit |
|
Variation |
|
|
|
|
|
|
|
Rows |
20.44 |
8 |
2.55 |
1.64 |
0.249 |
3.438 |
|
Columns |
296.05 |
1 |
296.05 |
190.32 |
7.35987E-07 |
5.317 |
|
Error |
12.44 |
8 |
1.55 |
|
|
|
|
Total |
328.94 |
17 |
|
SSS |
|
|
|
MLVSS |
|
|
|
|
|
|
|
Source of |
SS |
df |
MS |
F |
P-value |
F crit |
|
Variation |
|
|
|
|
|
|
|
Rows |
22108642.53 |
5 |
4421728.50 |
3.005 |
0.065 |
3.325 |
|
Columns |
94785829.36 |
2 |
47392914.68 |
32.212 |
4.37933E-05 |
4.102 |
|
Error |
14712603.6 |
10 |
1471260.36 |
|
|
|
|
Total |
131607075.5 |
17 |
|
|
|
|
|
TN-PO43--P |
|
|
|
|
|
|
|
Source of |
SS |
df |
MS |
F |
P-value |
F crit |
|
Variation |
|
|
|
|
|
|
|
Rows |
749.09 |
8 |
93.63 |
3.735 |
0.005 |
2.355 |
|
Columns |
17170.64 |
3 |
5723.54 |
228.356 |
8.96681E-18 |
3.008 |
|
Error |
601.53 |
24 |
25.06 |
|
|
|
|
Total |
18521.28 |
35 |
|
|
|
|
Correlation test
Table 2 shows the Pearson correlation matrices for sixteen variables. The correlation matrix result for the A/O/A mode SBR reactor treatment parameter shows a positive correlation between influent NH4+-N and effluent NH4+-N (r2 = 0.73), influent TN (r2 = 0.86), effluent TN (r2 = 0.82), influent PO43–P (r2 = 0.58), and effluent PO43–P (r2 = 0.65). On the other hand, NH4+-N is negatively correlated with influent COD (r2 = -0.54). Similarly, influent NO2–N shows a positive correlation with effluent NH4+-N (r2 = 0.58), influent PO43–P (r2 = 0.66), effluent PO43–P (r2 = 0.53) and is negatively correlated with influent NO3–N (r2 = – 0.59) and influent COD (r2 = -0.50). However, the correlated results of influent NO3–N reveal that it is positively correlated with influent pH (r2 = 0.59) and influent COD (r2 = 055) while negatively correlated with effluent NH4+-N (r2 = -0.59), effluent NO2–N (r2 = -0.59), and influent PO43–P (r2 = -0.52).
In spite of these parameters, influent TN is only positively correlated with effluent TN (r2 = 0.86), effluent alkalinity (r2 = 0.54), and effluent PO43–P (r2 = 0.71). The effluent NH4+-N results show a strong positive correlation with effluent NO2–N (r2 = 0.73), effluent TN (r2 = 0.65), and influent PO43–P (r2 = 0.80), while a negative correlation exists with influent COD (r2 = -0.70). Moreover, effluent NO2–N shows a negative correlation with effluent NO3–N (r2= -0.60), influent pH (r2 = -0.87), and effluent COD (r2 = -0.60). Likewise, effluent NO3–N shows a positive correlation with influent alkalinity (r2 = 0.63). The effluent TN shows positively correlated values with the influent alkalinity (r2 = 0.62), influent PO43–P (r2 = 0.74), and negatively correlated values with the influent COD (r2 = -0.74). Furthermore, the correlation matrices of this study show that COD activity is positively correlated with the effluent COD (r2 = 0.65) and negatively correlated with the influent PO43–P (r2 = -0.92).
Table 2: Correlation study of different treatment parameter of A/O/A mode SBR reactor
|
|
Time (Days) |
Influent NH4+-N |
Influent NO2–-N |
Influent NO3–-N |
Influent TN |
Effluent NH4+-N |
Effluent NO2–-N |
Effluent NO3–-N |
Effluent TN |
Influent pH |
Effluent pH |
Influent alkalinity |
Effluent alkalinity |
Influent COD |
Effluent COD |
Influent PO₄3ˉ-P |
|
Time (Days) |
1 |
|
|
|
|
|
|
|
|
|
|
|
|
|
|
|
|
Influent NH4+-N |
-0.64 |
1.00 |
|
|
|
|
|
|
|
|
|
|
|
|
|
|
|
Influent NO2–-N |
-0.68 |
0.42 |
1.00 |
|
|
|
|
|
|
|
|
|
|
|
|
|
|
Influent NO3–-N |
0.58 |
-0.45 |
-0.59 |
1.00 |
|
|
|
|
|
|
|
|
|
|
|
|
|
Influent |
-0.50 |
0.86 |
0.27 |
-0.03 |
1.00 |
|
|
|
|
|
|
|
|
|
|
|
|
Effluent NH4+-N |
-0.85 |
0.73 |
0.58 |
-0.59 |
0.44 |
1.00 |
|
|
|
|
|
|
|
|
|
|
|
Effluent |
-0.42 |
0.36 |
0.32 |
-0.59 |
-0.07 |
0.73 |
1.00 |
|
|
|
|
|
|
|
|
|
|
Effluent NO3–-N |
0.18 |
0.06 |
-0.27 |
0.48 |
0.47 |
-0.48 |
-0.60 |
1.00 |
|
|
|
|
|
|
|
|
|
Effluent |
-0.74 |
0.82 |
0.38 |
-0.21 |
0.86 |
0.65 |
0.27 |
0.35 |
1.00 |
|
|
|
|
|
|
|
|
Influent (pH) |
0.30 |
-0.13 |
-0.10 |
0.59 |
0.26 |
-0.46 |
-0.87 |
0.41 |
-0.16 |
1.00 |
|
|
|
|
|
|
|
Effluent (pH) |
0.21 |
0.19 |
0.24 |
0.44 |
0.43 |
-0.10 |
-0.32 |
0.26 |
0.11 |
0.62 |
1.00 |
|
|
|
|
|
|
Influent alkalinity |
-0.35 |
0.28 |
-0.07 |
0.03 |
0.54 |
0.08 |
-0.24 |
0.63 |
0.62 |
0.06 |
-0.13 |
1.00 |
|
|
|
|
|
Effluent alkalinity |
-0.15 |
0.38 |
-0.24 |
-0.22 |
0.26 |
0.43 |
0.39 |
-0.17 |
0.31 |
-0.37 |
-0.21 |
0.43 |
1.00 |
|
|
|
|
Influent COD |
0.94 |
-0.54 |
-0.50 |
0.55 |
-0.44 |
-0.70 |
-0.35 |
0.01 |
-0.74 |
0.37 |
0.43 |
-0.52 |
-0.17 |
1.00 |
|
|
|
Effluent COD |
0.58 |
-0.10 |
-0.18 |
0.36 |
0.13 |
-0.55 |
-0.60 |
0.39 |
-0.25 |
0.56 |
0.65 |
0.07 |
-0.01 |
0.65 |
1.00 |
|
|
Influent PO₄3--P |
-0.95 |
0.58 |
0.66 |
-0.52 |
0.48 |
0.80 |
0.42 |
-0.13 |
0.74 |
-0.26 |
-0.22 |
0.37 |
0.13 |
-0.92 |
-0.67 |
1.00 |
|
Effluent PO₄3--P |
-0.27 |
0.65 |
0.53 |
0.04 |
0.71 |
0.36 |
0.00 |
0.14 |
0.49 |
0.38 |
0.82 |
-0.11 |
-0.16 |
-0.03 |
0.27 |
0.25 |
(i) Strong correlation (r2= 1.0 to 0.5 or -1.0 to -0.5). (ii) Moderate correlation (r2 =0.3 to 0.5 or -0.5 to -0.3).
(iii) Weak correlation (r2 = 0.1 to 0.3 or -0.3 to -0.1). (iv) Very weak or no correlation (r2 = 0.1 to -0.1).
Conclusions
The conclusions drawn from this study on the anaerobic, oxic, followed by anoxic (A/O/A) cycle SBR reactor fed with sewage are as follows:
Granules growth was observed after 20 days of reactor start-up, resulting in round- shaped granules with a clearly visible outline and a compact structure that exhibited good settling ability were formed at the end of the study.
Average COD, NH4+-N, TN, and PO 3--P removal efficiencies were achieved 70.02 ± 5.98%, 78.21 ± 18.66%, 60.62 ± 9.69%, and 53.49 ± 8.14%, respectively.After the stabilization period, the NH4+-N removal efficiency reached 100%, indicating effective nitrification. However, the accumulation of NO3–N within the system indicated insufficient denitrification.
Long aerobic phase (60%) with a short anoxic phase (5%) improved the nitrification process but proved to be insufficient for denitrification. Complete denitrification required an extended anoxic phase of 10%.
In medium-strength wastewater with high PO 3--P concentration (15-17 mg/L) and COD concentration (800-1200 mg/L), the anaerobic phase comprising 25% of the total cycle duration was insufficient for achieving outstanding removal of PO43–P and COD.
SEM results revealed that rod-shaped bacteria, cocci, and filamentous fungi were the dominant microorganisms present within the cultivated granules.
Acknowledgement
One of the authors, M. R., is thankful to the University Grants Commission (UGC) for the National Fellowship and Scholarship for the Higher Education of ST Students (NFST). The authors would also like to acknowledge the valuable assistance provided by the Advanced Instrumentation Research Facility (AIRF) at Jawaharlal Nehru University (JNU) for the FTIR characterization. Additionally, the authors extend their appreciation to the Centre of Nanoscience and Nanotechnology at Jamia Millia Islamia, New Delhi, India, for their contribution to the characterization of the samples used in this study.
Conflicts of Interests
The authors declare no competing financial interest.
References
- K. Tanavarotai, H. Kamyab, A. N. Anuar, T. Khademi, A.Yuzir, V. Ashokkumar, and S. Rezania, “Storage and reactivation of aerobic granular sludge: A review,” Fuel, vol. 330, p. 125536, 2022, doi: https://doi.org/10.1016/j.fuel.2022.125536.
- R. Hamza, A. Rabii, F. Ezzahraoui, G. Morgan, and O. T. Iorhemen, “A review of the state of development of aerobic granular sludge technology over the last 20 years: Full-scale applications and resource recovery,” Case Stud. Chem. Environ. Eng., vol. 5, p. 100173, 2022, doi: https://doi.org/10.1016/j.cscee.2021.100173.
- J. Ming, Q. Wang, B. A. Yoza, J. Liang, H. Guo, Li, J. Li, S. Gao, and C Cen, “Bioreactor performance using biochar and its effect on aerobic granulation,” Bioresour. Technol., vol. 300, p. 122620, 2020, doi: https://doi.org/10.1016/j.biortech.2019.122620.
- Y. Zhang, X. Dong, M. Nuramkhaan, Z. Lei, K. Shimizu, Z. Zhang, Y. Adachi, D. J. Lee, and J. H. Tay, “Rapid granulation of aerobic granular sludge: A mini review on operation strategies and comparative analysis,” Bioresour. Technol. Reports, vol. 7, p. 100206, 2019, doi: https://doi.org/10.1016/j.biteb.2019.100206.
- S. Ahmad, W. A. Siddiqi, and S. Ahmad, “Sustainable nanocomposite porous absorbent and membrane sieves: Definition, classification, history, properties, synthesis, applications, and future prospects,” J. Environ. Chem. Eng., vol. 11, no. 2, p. 109367, 2023, doi: https://doi.org/10.1016/j.jece.2023.109367.
- S. Bengtsson, M. de Blois, B.-M. Wilén, and D. Gustavsson, “A comparison of aerobic granular sludge with conventional and compact biological treatment technologies,” Environ. Technol., vol. 40, no. 21, pp. 2769–2778, Sep. 2019, doi: 10.1080/09593330.2018.1452985.
- S. L. de Sousa Rollemberg, A. R. Mendes Barros, P. I. Milen Firmino, and A. Bezerra dos Santos, “Aerobic granular sludge: Cultivation parameters and removal mechanisms,” Bioresour. Technol., vol. 270, pp. 678–688, 2018, doi: https://doi.org/10.1016/j.biortech.2018.08.130.
- S. L. de S. Rollemberg, T. J. T. Ferreira, P. I. M. Firmino, and A. B. dos Santos, “Impact of cycle type on aerobic granular sludge formation, stability, removal mechanisms and system performance,” J. Environ. Manage., vol. 256, p. 109970, 2020, doi: https://doi.org/10.1016/j.jenvman.2019.109970.
- S. Kosar, O. Isik, Y. Akdag, H. Gulhan, I. Koyuncu, H. Ozgun, & M. E. Ersahin, “Impact of seed sludge characteristics on granulation and performance of aerobic granular sludge process,” J. Clean. Prod., vol. 363, p. 132424, 2022, doi: https://doi.org/10.1016/j.jclepro.2022.132424.
- Q. He, J. Song, W. Zhang, S. Gao, H. Wang, and J. Yu, “Enhanced simultaneous nitrification, denitrification and phosphorus removal through mixed carbon source by aerobic granular sludge,” J. Hazard. Mater., vol. 382, p. 121043, 2020, doi: https://doi.org/10.1016/j.jhazmat.2019.121043.
- Y. Liu and Q.-S. Liu, “Causes and control of filamentous growth in aerobic granular sludge sequencing batch reactors,” Biotechnol. Adv., vol. 24, no. 1, pp. 115–127, 2006, doi: https://doi.org/10.1016/j.biotechadv.2005.08.001.
- C. Zhang, H. Zhang, and F. Yang, “Optimal cultivation of simultaneous ammonium and phosphorus removal aerobic granular sludge in A/O/A sequencing batch reactor and the assessment of functional organisms,” Environ. Technol., vol. 35, no. 15, pp. 1979–1988, Aug. 2014, doi: 10.1080/09593330.2014.889218.
- N. Kishida, J. Kim, S. Tsuneda, and R. Sudo, “Anaerobic/oxic/anoxic granular sludge process as an effective nutrient removal process utilizing denitrifying polyphosphate-accumulating organisms,” Water Res., vol. 40, no. 12, pp. 2303–2310, 2006, doi: https://doi.org/10.1016/j.watres.2006.04.037.
- M. W. Mirza, T. C. D’Silva, K. M. Gani, S. S. Afsar, R. Z. Gaur, P.K. Mutiyar, A. A. Khan, V. Diamantis, and B. Lew, “Cultivation of anaerobic ammonium oxidizing bacteria (AnAOB) using different sewage sludge inoculums: process performance and microbial community analysis,” J. Chem. Technol. Biotechnol., vol. 96, no. 2, pp. 454–464, Feb. 2021, doi: https://doi.org/10.1002/jctb.6560.
- D. Gao, L. Liu, H. Liang, and W.-M. Wu, “Aerobic granular sludge: characterization, mechanism of granulation and application to wastewater treatment,” Crit. Rev. Biotechnol., vol. 31, no. 2, pp. 137–152, Jun. 2011, doi: 10.3109/07388551.2010.497961.
- F. A. Dahalan, N. Abdullah, A. Yuzir, G. Olsson, M. Hamdzah, M. F. M. Din, S. A. Ahmad, K. A Khalil, A. N. Anuar, Z. Z. Noor, and Z. Ujang, “A proposed aerobic granules size development scheme for aerobic granulation process,” Bioresour. Technol., vol. 181, pp. 291–296, 2015, doi: https://doi.org/10.1016/j.biortech.2015.01.062.
- A. W. Alattabi, C. B. Harris, R. M. Alkhaddar, M. Ortoneda-Pedrola, and A. T. Alzeyadi, “An investigation into the effect of MLSS on the effluent quality and sludge settleability in an aerobic-anoxic sequencing batch reactor (AASBR),” J. Water Process Eng., vol. 30, p. 100479, 2019, doi: https://doi.org/10.1016/j.jwpe.2017.08.017.
- S. L. de S. Rollemberg, L. Q. de Oliveira, A. R. M. Barros, V. M. M. Melo, P. I. M. Firmino, and A. B. dos Santos, “Effects of carbon source on the formation, stability, bioactivity and biodiversity of the aerobic granule sludge,” Bioresour. Technol., vol. 278, pp. 195–204, 2019, doi: https://doi.org/10.1016/j.biortech.2019.01.071.
- O. T. Iorhemen, R. A. Hamza, Z. Sheng, and J. H. Tay, “Submerged aerobic granular sludge membrane bioreactor (AGMBR): Organics and nutrients (nitrogen and phosphorus) removal,” Bioresour. Technol. Reports, vol. 6, pp. 260–267, 2019, doi: https://doi.org/10.1016/j.biteb.2019.03.015.
- M. Owaes, R. Z. Gaur, M. N. Hasan, K. M. Gani, S. Kumari, F. Bux, A. A. Khan, and A. A. Kazmi, “Performance assessment of aerobic granulation for the post treatment of anaerobic effluents,” Environ. Technol. Innov., vol. 17, p. 100588, 2020, doi: https://doi.org/10.1016/j.eti.2019.100588.
- T. Lotti, E. Carretti, D. Berti, M. R. Martina, C. Lubello, and F. Malpei, “Extraction, recovery and characterization of structural extracellular polymeric substances from anammox granular sludge,” J. Environ. Manage., vol. 236, pp. 649–656, 2019, doi: https://doi.org/10.1016/j.jenvman.2019.01.054.
- M. Grube, J. G. Lin, P. H. Lee, and S. Kokorevicha, “Evaluation of sewage sludge-based compost by FT-IR spectroscopy,” Geoderma, vol. 130, no. 3, pp. 324–333, 2006, doi: https://doi.org/10.1016/j.geoderma.2005.02.005.
- C. Mahata, S. Dhar, S. Ray, and D. Das, “Biohydrogen production from starchy wastewater in upflow anaerobic sludge blanket (UASB) reactor: Possibilities toward circular bioeconomy,” Environ. Technol. Innov., vol. 30, p. 103044, 2023, doi: https://doi.org/10.1016/j.eti.2023.103044.
- Y. Wang, J. Wang, Z. Liu, X. Huang, F. Fang, J. Guo, and P. Yan, “Effect of EPS and its forms of aerobic granular sludge on sludge aggregation performance during granulation process based on XDLVO theory,” Sci. Total Environ., vol. 795, p. 148682, 2021, doi: https://doi.org/10.1016/j.scitotenv.2021.148682.
- W. Jamile and da C. R. H. Ribeiro, “Aerobic Granulation in a Sequencing Batch Reactor Using Real Domestic Wastewater,” J. Environ. Eng., vol. 139, no. 11, pp. 1391–1396, Nov. 2013, doi: 10.1061/(ASCE)EE.1943-7870.0000760.
- S. Gao, Q. He, and H. Wang, “Research on the aerobic granular sludge under alkalinity in sequencing batch reactors: Removal efficiency, metagenomic and key microbes,” Bioresour. Technol., vol. 296, p. 122280, 2020, doi: https://doi.org/10.1016/j.biortech.2019.122280.
- Q. Su, C. Domingo-Félez, Z. Zhang, J.-M. Blum, M. M. Jensen, and B. F. Smets, “The effect of pH on N2O production in intermittently-fed nitritation reactors,” Water Res., vol. 156, pp. 223–231, 2019, doi: https://doi.org/10.1016/j.watres.2019.03.015.
- A. Ansari V. U. Siddiqui, M. Akram, W. A. Siddiqi, A. Khan, A. N. Al-Romaizan, M. H. Hussein, and M. Puttegowda, “Synthesis of Atmospherically Stable Zero-Valent Iron Nanoparticles (nZVI) for the Efficient Catalytic Treatment of High-Strength Domestic Wastewater,” Catalysts, vol. 12, no. 1. 2022. doi: 10.3390/catal12010026.

This work is licensed under a Creative Commons Attribution 4.0 International License.
About The Author
![]()
A New Edition of Web of Science
Journal Impact Factor
2022: 0.5
Five Year: 0.8
Journal is Indexed in

Cabells Whitelist
![]()


