Removal of Indigo Blue Dye Using Iron Oxide Nanoparticles – Process Optimization Via Taguchi Method
Sangita Yadav , Subhash Chander, Neha, Sweta Kumari, Ankur and Asha Gupta*
Department of environmental science and engineering, GJUST, Hisar-125001, Haryana, India.
Corresponding Author E-mail: guptaasha.env@gmail.com
DOI : http://dx.doi.org/10.13005/ojc/390215
Article Received on : 21 Mar 2023
Article Accepted on :
Article Published : 18 Apr 2023
Reviewed by: Dr. Kamala Mitra
Second Review by: Dr. Rambabu Kumar
Final Approval by: Dr. Dinesh Garg
In this study, the parameters for the adsorption of indigo blue dye onto iron oxide nanoparticles were optimized in a batch system (Fe3O4@ME nanoparticles nanomaterials synthesized using bacterial extracts and Fe3O4 nanomaterials synthesized using bacterial cell mass). The Taguchi optimization approach (an L9 array design) was utilized to estimate the significance and interaction impacts of many examined parameters (initial concentration of indigo blue dye, adsorbent dose, and contact time) on the adsorption process. It was observed that the ideal conditions were 0.125 gm of adsorbent, 13 mg/lit of initial dye concentration, and 90 minutes of contact time at pH 7, room temperature. In this study, at optimized conditions, the percent dye removal for Fe3O4 and Fe3O4@ME nanoparticles was 86 and 76, respectively. The percentage contribution of each process parameter to the elimination of indigo blue dye was determined using the Analysis of Variance (ANOVA) method. It was found that Taguchi could accurately forecast the outcomes. In order to support the accuracy of the process parameter optimization under the specified experimental conditions, it was found that the percentage removal of the indigo blue dye obtained in the confirmatory experiments carried out under optimized conditions was higher than that optimized in each of the Taguchi design's test runs.
KEYWORDS:Analysis of Variance (ANOVA); iron oxide nanomaterials; indigo blue dye; Taguchi; optimization
Download this article as:| Copy the following to cite this article: Yadav S, Chander S, Neha N, Kumari S, Ankur A, Gupta A. Removal of Indigo Blue Dye Using Iron Oxide Nanoparticles – Process Optimization Via Taguchi Method. Orient J Chem 2023;39(2). |
| Copy the following to cite this URL: Yadav S, Chander S, Neha N, Kumari S, Ankur A, Gupta A. Removal of Indigo Blue Dye Using Iron Oxide Nanoparticles – Process Optimization Via Taguchi Method. Orient J Chem 2023;39(2). Available from: https://bit.ly/3mP1SQx |
Introduction
For water and wastewater treatment procedures, the presence of micro and nanopollutants in water resources has recently emerged as a significant challenge. These pollutants are composed of waste products from both natural and manmade, such as pesticides, industrial chemicals, heavy metals, radioactive elements, personal care items, steroid hormones, industrial chemicals, and many other new emerging contaminants (Robledo-Padilla et al., 2020). Industrialization has significantly impacted the world economy in recent decades but has also had various detrimental environmental effects (Patnaik, 2018). One of the primary sources of pollution is the discharge of harmful chemicals into the environment via industrial wastewater (Yadav et al., 2022; Shindhal et al., 2021). The discharge of colored compounds is one of the main reasons for water contamination. These dyes are routinely dumped into natural streams that people use for everyday activities like drinking, bathing, and taking showers; therefore, this type of pollution may result in various significant issues for individuals. Most significantly, these wastewaters seriously endanger people’s health because they are toxic and cancer-causing. Additionally, impeding the introduction of synthetic dyes into natural streams has a negative effect on the photochemical processes cesses that take place in aquatic ecosystems (Zolgharnein, and Rastgordani, 2018). Dyes must thus be eliminated from all discharges due to more excellent knowledge of their toxicity and strict environmental safety regulations to prevent contamination of the biological ecology (Pundir et al., 2018). As a synthetic dye with an aromatic molecular structure that is more durable and more difficult to biodegrade, indigo dye wastewater treatment is one of the most challenging processes. By changing their chemical composition, new molecules called xenobiotics may develop that are potentially more dangerous than the original substances (Robledo-Padilla et al., 2020). These carcinogens have several adverse effects on aquatic organisms and significantly affect the environment’s natural food chain. Despite the development of numerous chemical, physical, and biological methods such as coagulation/flocculation, ozonation, electrochemical methods, biological treatment, photocatalyst, and adsorption for the treatment of wastewaters containing indigo blue dyes in the last decade, the design and development of new industrial techniques with high efficacy and reusability to treat these wastewaters before releasing them into the environment is a crucial requirement (Haghgir et al., 2022).
One of these strategies, adsorption, has proven to be particularly successful in eliminating different pollutants from wastewater streams (Abbasi, 2020). In the simple, efficient, cost-effective adsorption approach, various synthetic and natural materials can be used as adsorbents (Mosoarca et al., 2022b; Mosoarca et al., 2022c). Examples of frequently used adsorbents include activated carbon, lignin, zeolite, metal-organic frameworks, biomass residue, nanomaterials, etc. As nanotechnology has developed quickly in recent years, the application of nanomaterials in the environmental sphere has increased (Sultan et al., 2022; Wang et al., 2022). Nanosized materials are destructive sorbents with several benefits over their commercial analogs, including strong surface reactivity and ease of synthesis from readily available natural materials. They have also been shown to be superior adsorbent materials (Janani et al., 2022; Mansour et al., 2022). Time, initial dye concentration, pH, adsorbent dose, temperature, and ionic strength influence adsorption. In order to get the highest dye removal efficiency feasible, these parameters should be optimized. Optimizing experiment conditions is essential for adsorption. The Taguchi approach is one of the best methods for determining the best design configuration in multifactor situations (Babji et al., 2022; Mosoarca et al., 2022a). Numerous earlier experiments that use various optimization techniques to maximize dye removal are documented in the literature. The Taguchi method can maximize the response while minimizing the number of tests and considering how the various variables interact and affect each other.
However, some articles recommend Taguchi designs to enhance dye removal. Abbas et al. (2022) and Mahapatra, and Kumar, (2022), also found the Taguchi method appropriate, for the optimization process. This study removed indigo blue dye from synthetic water by adsorbing using iron oxide nanoparticles as an adsorbent. One of the key objectives was to use the Taguchi technique to determine the optimum adsorption parameters after assessing the effects of various controllable factors on the efficiency of the process and the signal-to-noise ratio (S/N). The percentage contribution of each parameter to the dye removal process was calculated using the ANOVA analysis. Additionally, it was determined that Taguchi model forecasts were accurate.
Methodology
Determining dye in the solution
The initial and final concentrations of the indigo blue dye in the solutions were calculated using UV-visible spectroscopy. On a UV-VIS Spectrophotometer, the wastewater’s equilibrium time and maximum absorbance wavelength (λ max) were measured. The standard solutions (10, 20, 40, 60, 80, and 100 mg/L), which cover the working ranges, were prepared using the reference standard stock solution for indigo blue dye, which has a concentration of 1000 mg/L. Using the calibration curve produced by the standard solutions of indigo blue dye, the concentration of the sample was determined by measuring its absorbance. The percentage of indigo blue dye adsorption (%b) by iron oxide nanoadsorbents was expressed as follows:
where Co (mg/L) is the initial concentration and Ce (mg/L) is the final concentration in the solution (Ghosh and Sinha, 2015).
Experimental design
The initial indigo blue dye concentration, contact time, and adsorbent dosage were used as independent (input) variables to investigate the effects of each on the removal of indigo blue dye from the aqueous matrix and there cumulative effects on dye adsorption. These parameters and their range were selected based on the literature (Palai et al., 2021) and according to some preliminary experiments. The pH and temperature conditions were set at 7 and 280 Celsius to make the adsorption process more affordable and environmentally friendly, respectively.
In particular, batch systems (polycarbonate cylindrical cells with lids) with continuous agitation (150 rpm) were used for the adsorption test. Because most conventional technologies are unsuccessful in treating dye pollution at low concentrations due to high operating costs, the initial indigo blue dye solution range was chosen to be 6-20 mg/L (Ghosh and Sinha, 2015). Table 1 displays the range of the initial indigo blue dye concentration, contact time, and adsorbent dosage employed in the this study. All statistical examinations for optimizing experimental variables were performed using Minitab software version 21.
Table 1: Range of the investigated parameters
|
Parameters |
Range |
|
|
Low |
High |
|
|
Dose (gm) Conc. (mg/lit.) Contact time (minutes) |
0.05 6 60 |
0.2 20 120 |
The variance analysis (ANOVA) was used to assess the degree to which these models accurately matched the experimental data. The Fischer (F-test) test with a 95 percent confidence interval was used to assess the statistical significance of the models and the interaction effects of each factor on the responses. The decision was made assuming that a model is a suitable approach to the actual data, the error resulting from lack of fit is insignificant, and the variation brought on by the regression is substantial at a 95% confidence level. Additionally, the model’s appropriateness was evaluated using the regression coefficient (R2), corrected regression coefficient (ADJ-R2), predicted multiple determination coefficient (Pre-R2), and the sum of squares of predicted residual errors (PRESS).
Taguchi
The Taguchi technique, an orthogonal design array-based fractional factorial design, was developed by the statistician and engineer Genichi Taguchi. This design makes it easy to conduct a limited number of experiments to examine the effects of various components on reactions at various levels. The orthogonal array architecture facilitates the organization of the variables and the levels at which they should be modified. In addition, the factorial design evaluates all possible combinations, saving time, money, and resources, whereas the Taguchi technique only examines at pairs of possibilities. These arrays can be used to determine the crucial elements of an experiment and predict the interactions between variables and operational parameters (Sy Mohamad et al., 2020).
Analyzing the signal-to-noise ratio (S/N) is also essential for assessing the results of experiments. Generally speaking, three alternative signal-to-noise ratios (S/N) can be used: lower is better, nominal is best, and larger is better. The signal-to-noise ratio can be calculated by using the following equation:
where n is the number of experiments conducted under similar experimental conditions, and PRE denotes the outcomes of the measurements (Ghosh, and Mondal, 2019).
Result and discussion
Taguchi and statistical analysis
The Taguchi method was used to identify the optimum conditions for indigo blue dye adsorption. In the Taguchi method, the phrases “signal” and “noise” refer to the desired and undesirable values for the output characteristic, respectively. The Taguchi technique uses the signal-to-noise (S/N) ratio to assess quality traits that differ from the target value. The S/N ratios change depending on the type of characteristic. In an orthogonal array of Taguchi experimental designs with two levels, the initial dye concentration, contact time, and adsorbent dose were the three variables employed. The Taguchi technique states that analyzing experimental results requires an investigation of the signal-to-noise ratio because the current experiment focuses on the “larger the better” option. The optimal levels of the parameters for getting the maximal response variable (dye adsorption %) were identified and are displayed in Fig. 1 according to the S/N ratio as the primary effect graph for the SN ratio. The results of the regression analysis were displayed in the main effect graphs. Only the significant variables at a 95% confidence level are displayed.
 |
Figure 1: Main effects plot for SN ratio A) Fe3O4 and B) Fe3O4@ME nanoparticles |
Regression analysis was used to determine the indigo blue dye’s adsorption rate (Eqs. 3 and 4). Model graphs, including 3D graphs and predicted vs actual value plots, as well as analysis of variance (ANOVA) (table 2) and model statistic summary (table 3), are used to express the mathematical model fitting and statistical analysis of observed experimental data for both nanoparticles for indigo blue dye adsorption ( % ). The significance of the regression coefficients was evaluated using a Student’s t-test with a 95% confidence level. Additionally, the model showed an adjusted correlation coefficient R2 (adj) for Fe3O4 and Fe3O4@ME nanoparticles of 90.86 %, and the predicted R2 coefficient for Fe3O4 and Fe3O4@ME nanoparticles is 94.28 and 94.29 %, respectively, which fit the statistical model rather well.
Dye adsorption Fe3O4 = 74.73 – 48.9 Dose (gm)- 0.619 Initial conc. (mg/lit) + 0.2206 Contact time (min) (3)
Dye adsorption Fe3O4@ME = 64.73 – 48.9 Dose (gm)- 0.619 Initial conc. (mg/lit) + 0.2206 Contact time (min) (4)
Table 2: Analysis of variance (ANOVA) for the adsorption of indigo blue dye using Fe3O4 and Fe3O4@ME nanoparticles
|
Fe3O4 |
Fe3O4@ME |
||||||||||
|
Source |
DF |
Adj SS |
Adj MS |
F-Value |
P-Value |
Source |
DF |
Adj SS |
Adj MS |
F-Value |
P-Value |
|
Regression |
3 |
806.70 |
268.899 |
27.52 |
0.002 |
Regression |
3 |
806.70 |
268.899 |
27.52 |
0.002 |
|
Dose (mg) |
1 |
80.67 |
80.667 |
8.26 |
0.035 |
Dose (mg) |
1 |
80.67 |
80.667 |
8.26 |
0.035 |
|
Conc. (mg/lit) Contact time (min) |
1 1 |
112.67 613.37 |
112.667 613.365 |
11.53 62.77 |
0.019 0.001 |
Conc. (mg/lit) Contact time (min) |
1 1 |
112.67 613.37 |
112.667 613.365 |
11.53 62.77 |
0.019 0.001 |
|
Error |
5 |
48.86 |
9.771 |
|
|
Error |
5 |
48.86 |
9.771 |
|
|
|
Total |
8 |
855.56 |
|
|
|
Total |
8 |
855.56 |
|
|
|
Figure 2 illustrates the accuracy of the predicted adsorption percent data using the Taguchi technique. The adsorption of indigo blue dye using Fe3O4 and Fe3O4@ME nanoparticles may be demonstrated to be reasonably predicted using Taguchi experimental design, even though it is based on a limited number of experiments as all the points are scattered around the middle straight line in a normal probability plot. The “actual” impacts are determined using a normal probability plot.
 |
Figure 2: Residual plots for PBD for A) Fe3O4 and B) Fe3O4@ME nanoparticles |
The relative importance and interactions of the main effects were readily evident on the Pareto chart (Fig. 3). The horizontal columns in the Pareto chart display these values for each effect. The calculated effects were tested using a student’s t-test to see if they differed statistically from zero. Values above a reference line or falling inside the 95 percent confidence interval are considered significant (Bingol et al., 2010). According to Fig. 3, the three major components (A, B, and C) that were beyond the reference line were significant at the 0.05 level.
 |
Figure 3: Pareto plots of A) Fe3O4 and B) Fe3O4@ME nanoparticles |
By examining surface plots of the adsorption percent vs different pairings of effective factors, one can better understand the simultaneous effects of the experimental variable on the dye adsorption process. The combined effects of the initial dye concentration, contact time, and adsorbent dosage are shown in Figs. 4 and 5.
Table 3: Model summary statistics
|
Model |
R2 |
Adjusted R2 |
Predicted R2 |
Std. Dev |
|
Taguchi (Fe3O4) |
0.9428 |
0.9086 |
0.7652 |
3.12593 |
|
Taguchi (Fe3O4@ME) |
0.9429 |
0.9086 |
0.7952 |
3.12593 |
 |
Figure 4: Three-dimensional response surfaces for indigo blue dye adsorption using Fe3O4 nanoparticle |
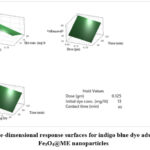 |
Figure 5: Three-dimensional response surfaces for indigo blue dye adsorption using Fe3O4@ME nanoparticles |
Conclusion
Indigo blue dye removal from a synthetic aqueous solution was the main focus of the current investigation, which focused on using Fe3O4 and Fe3O4@ME nanoparticles as adsorbents. Using batch mode tests, the Taguchi method optimized the process variables for the indigo blue dye’s adsorption. Using the Taguchi experimental design with an L9 orthogonal array, the process parameters were optimized for the highest percent elimination of indigo blue dye. The following is the order in which each parameter contributes to the percent removal of indigo blue dye: contact time > initial dye conc. > adsorbent dose for both Fe3O4 and Fe3O4@ME. The confirmation experiment’s dye removal percentage was higher than all test runs. Process parameters were carefully optimized to raise the indigo blue dye removal percentage. Additionally, the model demonstrated an adjusted square correlation coefficient R2 (adj) of 90.86%, for Fe3O4 and Fe3O4@ME nanoparticles, which fit the statistical model well. In this study, at optimized conditions, the percent dye removal for Fe3O4 and Fe3O4@ME nanoparticles was 86 and 76, respectively. This may be associated with presence of cell biomass for Fe3O4 nanomaterials which increases the percentage adsorption of indigo blue dye. This suggests that Fe3O4 has a greater impact on dye adsorption than Fe3O4@ME. These results suggest that indigo blue dye may be removed from synthetic aqueous solutions and that iron oxide nanoparticles can be utilized to treat industrial wastewater.
Conflict of Interest
The authors reported no potential conflict of interest.
Funding Sources
The University Grants Commission (UGC-JRF), Delhi, India supported this work [NTA Ref. No. – 190510167473].
References
- S. H., Younis, Y. M., Rashid, K. H. and Khadom, A. A. 2022. Removal of methyl orange dye from simulated wastewater by electrocoagulation technique using Taguchi method: kinetics and optimization approaches. React. Kinet. Mech. Catal. 135(5):2663-2679. https://doi.org/10.1007/s11144-022-02269-9
CrossRef - Abbasi, S. 2020. Adsorption of dye organic pollutant using magnetic Fe3O4 embedded on the surface of graphene oxide. J Inorg. Organomet. Polym. Mater. 30(6):1924-1934. https://doi.org/10.1007/s10904-019-01336-4
CrossRef - A., Rambabu, G., Balaji Naik, D. and Siva Kumar, G. 2022. Optimisation of performance parameters of a variable compression ratio diesel engine with hibiscus cocos nucifera biodiesel using Taguchi method. Int. J. Ambient. Energy. 1-12. https://doi.org/10.1080/01430750.2022.2102072
CrossRef - Bingol, D., Tekin, N. and Alkan, M. 2010. Brilliant Yellow dye adsorption onto sepiolite using a full factorial design. Appl. Clay Sci. 50(3):315-321. https://doi.org/10.1016/j.clay.2010.08.015
CrossRef - Ghosh, A., Das, P. and Sinha, K. 2015. Modeling of biosorption of Cu (II) by alkali-modified spent tea leaves using response surface methodology (RSM) and artificial neural network (ANN). Appl. Water Sci. 5(2):191-199. https://doi.org/10.1007/s13201-014-0180-z
CrossRef - Ghosh, S. B. and Mondal, N. K. 2019. Application of Taguchi method for optimizing the process parameters for the removal of fluoride by Al-impregnated Eucalyptus bark ash. Environ. Nanotechnol. Monit. Manag. 11:100206. https://doi.org/10.1016/j.enmm.2018.100206
CrossRef - A., Hosseini, S. H., Tanzifi, M., Yaraki, M. T., Bayati, B., Saemian, T. and Koohi, M. 2022. Synthesis of polythiophene/zeolite/iron nanocomposite for adsorptive remediation of azo dye: Optimized by Taguchi method. Chem. Eng. Res. Des. 525-537. https://doi.org/10.1016/j.cherd.2022.05.042
CrossRef - R., Gurunathan, B., Sivakumar, K., Varjani, S., Ngo, H. H. and Gnansounou, E. 2022. Advancements in heavy metals removal from effluents employing nano-adsorbents: way towards cleaner production. Environ. Res. 203:111815. https://doi.org/10.1016/j.envres.2021.111815
CrossRef - Taguchi Optimization Studies for Abatement of 2‐Chlorophenol Using Neem Seed Activated Carbon. Chem. Eng. Technol. 45(4):641-648. https://doi.org/10.1002/ceat.202100427
CrossRef - A. T., Alprol, A. E., Khedawy, M., Abualnaja, K. M., Shalaby, T. A., Rayan, G. and Ashour, M. 2022. Green Synthesis of Zinc Oxide Nanoparticles Using Red Seaweed for the Elimination of Organic Toxic Dye from an Aqueous Solution. Mater. 15(15):5169. https://doi.org/10.3390/ma15155169
CrossRef - Mosoarca, G., Popa, S., Vancea, C., Dan, M. and Boran, S. 2022(b). Removal of Methylene Blue from Aqueous Solutions Using a New Natural Lignocellulosic Adsorbent—Raspberry (Rubus idaeus) Leaves Powder. Poly. 14(10):1966. https://doi.org/10.3390/polym14101966
CrossRef - G., Vancea, C., Popa, S. and Boran, S. 2022(c). Optimization of crystal violet adsorption on common lilac tree leaf powder as natural adsorbent material. Global NEST. 24(1):87-96. https://doi.org/10.30955/gnj.003951
CrossRef - G., Vancea, C., Popa, S., Boran, S. and Radulescu-Grad, M. E. 2022(a). Crystal violet removal from aqueous solutions using dry bean pods husks powder–optimization and desorption studies. Univ. Ann. Chem. 33(2):129-134. https://doi.org/10.2478/auoc-2022-0019
CrossRef - Palai, P., Muduli, S., Priyadarshini, B. and Sahoo, T. R. 2021. A facile green synthesis of Fe3O4 nanoparticles and its adsorptive removal of Congo red dye from aqueous solution. Mater. Today: Proc. 38:2445-2451. https://doi.org/10.1016/j.matpr.2020.07.387
CrossRef - Patnaik, R. 2018. Impact of industrialization on environment and sustainable solutions–reflections from a south Indian region. In IOP Conference Series: Earth and Environmental Science (Vol. 120, No. 1, p. 012016). IOP Publishing. 10.1088/1755-1315/120/1/012016
CrossRef - R., Chary, G. H. V. C. and Dastidar, M. G. 2018. Application of Taguchi method for optimizing the process parameters for the removal of copper and nickel by growing Aspergillus sp. Water Resour. Ind. 20:83-92. https://doi.org/10.1016/j.wri.2016.05.001
CrossRef - F., Aquines, O., Silva-Núñez, A., Alemán-Nava, G. S., Castillo-Zacarías, C., Ramirez-Mendoza, R. A., and Parra-Saldívar, R. 2020. Evaluation and predictive modeling of removal condition for bioadsorption of indigo blue dye by Spirulina platensis. Microorg. 8(1), 82. https://doi.org/10.3390/microorganisms8010082
CrossRef - Shindhal, T., Rakholiya, P., Varjani, S., Pandey, A., Ngo, H. H., Guo, W. and Taherzadeh, M. J. 2021. A critical review on advances in the practices and perspectives for the treatment of dye industry wastewater. Bioengineered. 12(1):70-87. https://doi.org/10.1080/21655979.2020.1863034
CrossRef - M., Siddique, M., Khan, R., Fallatah, A. M., Fatima, N., Shahzadi, I. and Abbasi, A. M. 2022. Ligustrum lucidum Leaf Extract-Assisted Green Synthesis of Silver Nanoparticles and Nano-Adsorbents Having Potential in Ultrasound-Assisted Adsorptive Removal of Methylene Blue Dye from Wastewater and Antimicrobial Activity. Mater. 15(5):1637. https://doi.org/10.3390/ma15051637
CrossRef - Sy Mohamad, S. F., Mohd Said, F., Abdul Munaim, M. S., Mohamad, S. and Azizi Wan Sulaiman, W. M. 2020. Application of experimental designs and response surface methods in screening and optimization of reverse micellar extraction. Crit. Rev. Biotechnol. 40(3):341-356. https://doi.org/10.1080/07388551.2020.1712321 CrossRef
CrossRef - X., Zhang, P., Xu, F., Sun, B., Hong, G. and Bao, L. 2022. Adsorption of methylene blue on azo dye wastewater by molybdenum disulfide nanomaterials. Sustainability. 14(13):7585. https://doi.org/10.3390/su14137585
CrossRef - S., Punia, S., Sharma, H. R. and Gupta, A. 2022. Nano-remediation for the decolourisation of textile effluents: A review. Nanofabrication. 7. https://doi.org/10.37819/nanofab.007.226
CrossRef - Optimization of simultaneous removal of binary mixture of indigo carmine and methyl orange dyes by cobalt hydroxide nano-particles through Taguchi method. J. Mol. Liq. 262:405-414. https://doi.org/10.1016/j.molliq.2018.04.038
CrossRef

This work is licensed under a Creative Commons Attribution 4.0 International License.
About The Author
![]()
A New Edition of Web of Science
Journal Impact Factor
2022: 0.5
Five Year: 0.8
Journal is Indexed in

Cabells Whitelist
![]()


