Removal of Aniline from Aqueous Solution by Adsorption on a Modified Montmorillonite Clay Kinetic and Thermodynamic Studies
Dulail Nasir Hassan Algabary1* and Elbasheer HZE2
1Department of Chemistry, Faculty of Science, Al-Baha University, Saudi Arabia.
2Department of Chemistry, Turaba University College, Taif University, Saudi Arabia.
Corresponding Author E-mail: DulailNasir@gmail.com
DOI : http://dx.doi.org/10.13005/ojc/390220
Download this article as:
![]()
This work concerns the application of treated montmorillonite clay in the adsorption of Aniline as an organic pollutant in the wastewater. The characteristics of clay were evaluated by X-ray Fluorescence (XRF), X-ray diffraction (XRD) patterns, Fourier-transform infrared spectroscopy (FTIR) and Thermogravimetric Analysis (TGA). Additionally, the effect of different factors such as type of treatment, adsorbent dosage, contact time, solution temperature and pH were studied. The experimental data was evaluated by two kinetic models; pseudo-first and pseudo-second order. The results indicated that the adsorption followed pseudo-second-order models with coefficient R2 = 0.9928. The equilibrium time of Aniline was obtained after 3h. The thermodynamic parameters refer to the adsorption of Aniline on modified clay was endothermic and chemisorption. Because of advantages such as the abundance of clay and speed of the adsorption process, this method could be used to effectively remove aniline from wastewater.
KEYWORDS:Aniline; Montmorillonite Clay; Pseudo-first-order; Pseudo-second-order; Sustainable Treatment; Wastewater
Introduction
Water is fundamental part of life and is essential for irrigation and marine life for sustainable food supply 1-3 . Despite importance, water is most poorly managed resource in the world 4-6 . In developing countries, wastewater is released untreated into ponds, rivers, lakes and other water bodies. The untreated and uncontrolled disposal of wastewater into water bodies is major cause of water resources pollution 7. All industrial processes use large quantities of water and generate vast amounts of wastewater, which usually discharged untreated into common effluent drains 8,9.
Rapid industrialization, which resulted in increased organic pollution dumping into water supplies and the ecosystem, had substantial and negative environmental consequences, such as Aniline, which is a simple substance with a benzene ring and an NH2 bond in its aromatic ring. Table 1 shows some properties and chemical structure of Aniline 10. It’s a by-product of the paper and textile industries, and it’s utilized as a raw ingredient in the petrochemical and agrochemical sectors, as well as pesticide, plastics, rubber, pharmaceutical, and dyestuff industries 11.
 |
Table 1: Properties and chemical structure of Aniline |
Industrial activities produce a wide range of wastewaters containing toxins that are harmful to ecosystems and humans 12. Aniline is one of the pollutants that threaten the ecosystem, even if they are found in small concentrations, the Aniline can change hemoglobin into methaemoglobin which causing anorexia, damage to red blood cells and the effect of spleen 13. When Aquatic life poisoned by Aniline, it harmed their central nervous system, cardiovascular system, liver, and kidneys. The US Environmental Protection Agency has classified it as one of 129 priority pollutants. Aniline has been added to China’s “blacklist” of priority pollutants for the environment 14.
The wastewater treatment processes were classified into chemical, physical, and biological processes 15. There are many techniques that are used to treat wastewater, such as chemical precipitation, ion exchange technique 16, photocatalysis technology 17, electro-coagulation 18, reverse osmosis 19, adsorption, chlorination, filtration, incineration at high temperature, sedimentation, biological treatment and coagulation 20. In the chemical industry, adsorption methods have been effectively used to purify water in general, as well as for specific solutions and individual effluent streams 18. Adsorption has several advantages in comparison to other advanced treatment methods, it can remove both organic and inorganic contaminants even in very low levels, it is relatively simple and safe to run, it is possible to use both batch and continuous equipment, no sludge is formed, and the adsorbent could be regenerated and reused. Furthermore, the procedure is economical 21,22, especially when using low-cost, biodegradable, and environmentally acceptable materials 23. Various researchers use low-cost adsorbent materials such as saw slurry, dust, chitin, rice husk, biomass cellulose, chitosan, peat, orange waste, zeolite 24, wheat bran 25 and clays 25-28. El-maghrabi & Mikhail, reported that clay minerals as adsorbents, are commonly available, low-cost materials that provide a cost-effective alternative to traditional treatment methods. Clay’s porous nature and large surface area are advantageous for liquid adsorption 29.
“Clay” is a general term for a naturally present material that is primarily composed of fine-grained particles (clay minerals) 30. Nayak & Singh, stated the clay can be categorized by the differences in the layered structure include smectites (montmorillonite, saponite), kaolinite, mica (illite), serpentine, vermiculite, pylophyllite (talc), and sepiolite, among others. The adsorption properties of minerals as a result of a net negative charge on their structure. Clay’s negative charge allows it to absorb species with positive charges. The huge surface area and porosity of clay contribute to their sorption properties, Montmorillonite clay has the largest surface area and capacity for cation exchange of any clay 31. There is another classification mentioned by Macias-Quiroga et, al. based on the number and configuration of tetrahedral and octahedral slabs in their fundamental structure are divided into three layer types (1:1, 2:1, and 2:1:1). These are further divided into five classes according to their net charge (kaolinite, mica, vermiculite, smectite, and chlorite). Smectite refers to a collection of phyllosilicate minerals that includes montmorillonite, hectorite, saponite, beidellite, and nontronite 30.
Clays benefit the ecosystem by performing as a natural pollutant scavenger by removing cations and anions out of ion exchange, adsorption, or both. Acid activation is the process of treating clay minerals by inorganic acids at high concentrations and temperatures. Clay mineral acid treatments are a key control over mineral weathering and formation. exchangeable cations are commonly replaced by H+ ions, in addition to the escape of Al3+ and other cations from both tetra and octahedral positions, as a result leaving SiO4 groups mostly intact. The acidity and surface area of the clay minerals are both increased as a result of this process 16,32, as well as the removal of some mineral impurities and the partial dissolving of the exterior layers. As a result of acid treatment, clays’ surface area and porous structure change depending on the chemical composition, type of cations between the layers, type of acid, the process temperature and duration, and other environmental factors 16.
There are lots of factors that affect the adsorption process including: type of treatment, nature of the adsorbent, surface area and pore size of the adsorbent material 33, initial concentration 34,35, the amount of adsorbent 22, effect of time 29, solution temperature 33, and the pH of the aqueous solution 25,33.
The aim of this work is to prepare efficient and low-cost adsorbent (clay) involving treated by two activation agents H2SO4 and H3PO4. Studied the removal of Aniline from aqueous solution and compare the removal efficiency by different montmorillonite clay samples, determined the optimal adsorption conditions for the clay to remove Aniline and its efficiency, discussed the kinetic, and thermodynamic parameters.
Techniques and Instruments
The pH values were measured using pH meter Mi 105 pH/ temperature meter Milwaukee. Hot plate Fisher Scientific Isotemp was used for heating and shaking adsorption experiments. Sensitive balance SHIMADSU AUW220. Oven Json-050. Water distiller Gesellschaft für Labortechnik mbH D-30938 BURGWEDEL Type (2004) was used to distill the water used in all experiments. UV spectrophotometer (Thermo Fisher Scientific Evolution 300 UV/VIS Spectrometer MODEL EVO300 PC) was used to determine the concentration of aniline in the samples at 287 nm. TGA measurements were performed on Simultaneous Thermogravimetry – Differential Scanning Calorimetry (STA/TG-DSC) STA 449 F5 Jupiter – NETZSCH with constant heating rate of 20°C/min in the temperature range of 20-1000°C under nitrogen atmosphere. The elemental configurations of the clays were analyzed by XRF using Rigaku WD XRF ZSX PRIMUS II Spectrometer. using Ultima IV X-ray Diffractometer in the 2θ by using Cu Kα radiation (λ=1.5406 Å) to determine the XRD patterns. Infra-red spectra of adsorbents were recorded over the spectral range of 4000-400 cm-1 using Thermo Scientific Nicolet is50 FT-IR spectrophotometer. The adsorbents were separated from solution by centrifugation within 15 min at the rate of 6000 rpm using Centurion Scientific Ltd centrifuge.
Materials and Chemicals
The chemicals used in this study: Distilled water, 98% extra pure Sulfuric Acid (H2SO4), 37% Hydrochloric Acid (HCl), 98% extra pure Sodium Hydroxide pellets (NaOH), Phosphoric Acid (H3PO4) and 98.5% Aniline (C6H5NH2). Three different clay samples which are used for this research clay 1, 2 and 3, clay 1 and 2 were obtained from Thi Ain village and Nawan Urban respectively and all belongs to Al-Baha governance, while clay 3 was obtained from Turabah Valley which belongs to Taif city.
Methodology
Preparation and Characterization of used materials
Preparation of clay
First removed unwanted materials and water-soluble impurities by repeatedly washing the clay in distilled water, where the clay was immersed in distilled water then filtered. The clay was dried in oven at 100 ◦C for 24 h before being treated to completely vaporize the moisture content. Later on, it was used as an adsorbent. Chemical activation of the clay was done with H2SO4 or H3PO4. 10 g of dried clay was refluxed with 100 mL (2.5 M) Acid solution. The refluxing was performed at 80◦C for 3 h. After 3h, the clay was filtered then washed twice with hot water in order to remove residual organic and mineral matters, finally dried at 80 ̊C for 48 h.
Characterization of the adsorbent
The structure of the clays before and after treatment was characterized in powder form by XRD using Ultima IV X-ray Diffractometer in the 2θ by utilizing the Cu Kα radiation (λ=1.5406 Å) to find the crystal phase of clays. The elemental configurations of the clays were analysed by XRF using Rigaku WD XRF ZSX PRIMUS II Spectrometer. TGA of the various types of clays before and after treatment was carried out with the aid of STA 449 F5 Jupiter – NETZSCH Analysis system, all powder samples were exposed constant heating rate of 20°C/min was utilized from 20 to 1000°C in nitrogen atmosphere. The vibrational behavior of the respective samples was examined by FTIR spectrometer in the range 400-4000 cm−1.
Preparation of Aniline solutions (stock solution)
The stock solution of 50 ppm of Aniline was prepared by dissolved 1 g (0.98 mL) of Aniline in 1000 mL of distilled water, then 50 mL of 1000 ppm Aniline solution was diluted to mark in 1000 mL volumetric flask to obtain 50 ppm stock Aniline solution.
Adsorption experiments
20 mL of stock solution adds to the flask and the amount of adsorbent (clay) then stirred the solution for many hours, then the clay was separated from solution by centrifuge. Finally, the samples were analyzed by double beam UV spectrophotometer at 287 nm to determine of Aniline concentration. Effect of parameters like adsorbent nature, adsorbent treatment, adsorbent dosage, contact time, temperature, and pH were studied.
The removal efficiency % and capacity of adsorption (qe, mg/g) onto the clay were estimated by the equations 1 and 2: 11,13

C0: Initial concentrations of the adsorbate mg/L.
Cf: Final concentrations of the adsorbate mg/L.
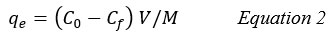
qe: Adsorption capacity.
M: The mass of the adsorbent (g).
V: The volume of the solution (L).
Cf: The final concentrations of adsorbate (mg/L)22.
Effect of adsorbent nature and type of treatment
The effect of adsorbent nature and type of treatment by using 3 samples clay1, 2 and 3. They were treated with two different acids (2.5M) sulfuric acid H2SO4 or (2.5M) phosphoric acid H3PO4.
Effect of adsorbent dose
Five different weights of Clay (0.05, 0.10, 0.15, 0.20 and 0.25 g) were added to five different flasks containing 20 mL of 50 ppm Aniline solution. After that, the flasks were stirred for 5h. The solution was separated by centrifugation to remove the clay particles from Aniline solution. Finally, Aniline solution was prepared for UV analysis to measure the concentration of aniline after the adsorption process.
Effect of time and kinetic experiments
0.100 g of clay was added to five different flasks containing 20 mL of 50 ppm of Aniline solution. After that, the flasks were stirred for 1, 2, 3, 4 or 5h separately. The solution was separated by centrifugation to remove the clay particles from Aniline solution. Finally, Aniline solution was prepared for UV analysis to measure the concentration of aniline after the adsorption process.
The adsorption capacity of Aniline at time t, qt (mg/g), was estimated by the following equation 36:
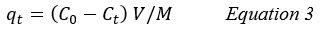
qe: Adsorption capacity of Aniline at time t.
M: The mass of the adsorbent (g)
V: The volume of the solution (L).
Ct: The concentrations of adsorbate at time (t), (mg/L).
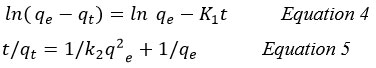
To further understand the mechanism of adsorption, kinetic studies were conducted. The rate of adsorbed metal to that of the adsorbate, as well as the equilibrium for the adsorption process, determine the kinetics of the adsorption. Pseudo-first- and pseudo-second-order kinetic models were used to examine the adsorption data 22.
In order to analyze adsorption kinetic data of adsorbate onto the adsorbent, two kinetic models, pseudo-first and pseudo-second order models, were used to choose the best fitted model for the experimental data. The pseudo-first and pseudo-second order are represented by Equations 4 and 5, respectively 11.
Effect of temperature and Aniline adsorption thermodynamics
0.100 g of clay was added to five different flasks containing 20 mL of 50 ppm of Aniline solution connected to a condenser and in a water bath to prevent any evaporating at certain temperature. The effect of temperature was studied from 25, 35, 45, 55 and 60°C for 5 h. The solution will be filtered and separated by centrifugation. Finally, analyzed the samples.
The determination of the main three parameters is required for a thermodynamic study of the adsorption process. These parameters were the standard enthalpy (ΔH̊), standard free energy (ΔG̊), and standard entropy (ΔS̊). The amounts of standard enthalpy and standard free energy were estimated by using the intercept and slope of vant Hoff plots of lnKL versus 1/T, respectively, and the following equation (6,7 and 8) 11:
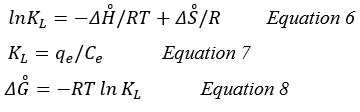
KL (L/g): the coefficient of distribution.
qe (mg/g): the adsorption capacity at equilibrium.
Ce (mg/L): the concentration in equilibrium.
R: (8.314 J/mol K) is universal gas constant.
T (°K): Solution temperature in Kelvin.
The adsorption mechanism (physisorption and chemisorption) can be determined through the thermodynamic parameters ∆H°, ∆G° and ∆S°. Chemical adsorption is caused by strong chemical interactions (chemical bonding), which leads to an electron transfer between the adsorbent and adsorbate, as opposed to physical adsorption, which is caused by relatively weak interactions like the Van der Waals force. Exothermic adsorption (-∆H°) which release energy as heat into the environment involves either physisorption, chemisorption, or a combination of the two processes. While its magnitude can estimate physisorption when (∆H°≤60 kJ/mol) or chemisorption (∆H°≥200 kJ/mol) 37. On the other hand, chemisorption is unmistakably responsible for an endothermic process (+∆H°), which absorbs energy in the form of heat from its surroundings 138.
Effect of pH
Adsorption samples were evaluated by convert the pH in the 3–12 range, to maintain the pH of Aniline solution, either 1 M of NaOH or 1 M HCl was added dropwise before carrying out adsorption. pH was monitored both before and after adsorption.
Results and Discussions2.
Characterization of the adsorbents
XRF characterization
XRF was conducted to determine the chemical compositions of studied adsorbents especially evaluating total silica, alumina, iron and alkali metals. The results of chemical compositions for clay 3 were presented in Table 2.
Table 2: Chemical compositions of the clay 3 before and after treatment by (2.5M) H2SO4
|
Parameter |
Clay 3-untreated |
Clay 3+H2SO4 |
|
Mass% |
||
|
Loss on Ignition LOI * |
13.29 |
11.94 |
|
Silica SiO2 |
41.08 |
45.06 |
|
Ferric Oxide Fe2O3 |
13.02 |
6.034 |
|
Aluminum Oxide Al2O3 |
14.53 |
8.999 |
|
Sulfur trioxide SO3 |
0.107 |
11.62 |
|
Chloride Cl– |
0.029 |
0.093 |
|
Total Calcium Oxide CaO |
9.346 |
10.38 |
|
Magnesium Oxide MgO |
3.657 |
0.909 |
|
Sodium Oxide Na2O |
0.768 |
1.112 |
|
Potassium Oxide K2O |
2.181 |
1.988 |
|
Phosphorus Pentoxide P2O5 |
0.319 |
0.121 |
|
Manganese Oxide MnO |
0.238 |
0.071 |
|
Nickel Oxide NiO |
0.024 |
<0.01 |
|
Chromium Oxide Cr2O3 |
0.039 |
0.074 |
|
Titanium Oxide TiO2 |
1.213 |
1.427 |
|
Zinc Oxide ZnO |
0.028 |
0.090 |
|
Strontium Oxide SrO |
0.066 |
0.054 |
*Ignition Loss (I.L) is measured by burning a one-gram sample at 1000°C until it reaches a constant weight 29.
Table 2 summarize some of the clay’s chemical features, as can be seen from the tables, the major constituents of the clay are SiO2, Al2O3, and Fe2O3, with additional oxides present in small amounts. Orumwense, stated that any of the major oxides present in the adsorbent, or their combined impact, is responsible for the adsorption process 39. Table 2 showed that the mass ratio SiO2/Al2O3 for clay 3 before and after treatment was 2.83 and 5.00 respectively, this increase in value suggests increasing the presence of a large amount of free silica (Quartz). As for loss on ignition (13.29 and 11.94 %) for (Clay3-untreated and Clay3+H2SO4) respectively may be due to the dehydroxylation of the clay and removal of its organic and carbonate compounds 34,40.
Clay mineral crystals currently composed of alternating silica and alumina slabs (1:1 type clay minerals, such as kaolinite) or in the order ‘silica-alumina-silica’ (2:1 type, such as illite, montmorillonite) 41. Macias-Quiroga et, al. stated that to identify the types of clay minerals, the SiO2/Al2O3 ratio has been established as a criterion, for the 40 montmorillonite samples tested, the average SiO2/Al2O3 ratio was 2.85 30. This ratio is very close to the SiO2/Al2O3 ratio of clay before treatment, indicating that the clay used in this study is montmorillonite clay. After the acid treatment, the chemical composition of the clay changed as presented in Table 2, it shows that the percentage of SiO2 increased whereas Al2O3, Fe2O3 and MgO decreased for the treatment clay regarding the untreated clay. Due to the exchangeable cations being replaced by H+ ions, and Al+3 and other cations escape from both tetrahedral and octahedral positions, leaving SiO4 groups mostly intact, the surface area and acidity of the clay minerals are both increased as a result of this process 16,34,42. Also Amari et, al. stated that the chemical examination of raw clay revealed the existence of key elements such as silica, alumina, calcium, and iron, as well as traces of sodium, phosphate, potassium and titanium oxides. clay mineral is an alumino-silicate substance, as evidenced by the greater mass percentages of silica and alumina, clay’s SiO2 content rose after acid activation, while the amount of Al2O3, Fe2O3, and MgO, has reduced, due to the octahedral layers (Al, Fe, and Mg-O layers) partially dissolution and the tetrahedral layers (Si-O layers) being exposed to the acid solution 43.
XRD characterization
In order to determine the crystal phase of clays particles, the samples were analyzed by utilizing the Ultima IV X-ray Diffractometer in the 2θ by using Cu Kα radiation (λ=1.5406 Å), Scan range 10 – 80 deg. Figures 1 shows the XRD pattern for the adsorbents. The sharp and strong peak confirmed that the clay samples were well crystallized 44. All XRD patterns for activation clays reflect the high existence of SiO2 peaks as shown in the following detail.
 |
Figure 1: XRD pattern for Clay3, Clay3+H2SO4 and Clay3+H3PO4. |
The XRD pattern for Clay3 show the presence of hexagonal crystal phase of quartz SiO2 at diffraction peaks of (20.96, 26.95, and 50.64º) which corresponding to (100, 101 and 003) planes respectively, (reference code: 00-005-0490). And orthohombic crystal phase of montmorillonite (Na, Ca)0.3 (Al, Mg)2Si4O16(OH)2·xH2O at diffraction peaks of (18.96, 26.77 and 29.90º) which corresponding to (102,121 and 116) planes respectively, (reference code: 00-012-0232) as majority phases. The XRD data exhibit other compounds at lower levels such as monoclinic crystal phase of muscovite KAl2(AlSi3O10).(OH)2 at diffraction peaks of (22.30 and 28.32º) which corresponding to (112, 114,115), (reference code: 01-077-2255) and anorthic crystal system of kaolinite Al2Si2O5(OH)4 at (12.84 and 24.37º) which corresponding to (001,101) planes respectively (reference code: 01-072-2300).
After treatment with acids, the composition differed, Clay3+H2SO4 the quartz phase became the main one at diffraction peaks of (20.85, 26.65, 50.15 and 59.88º) which corresponding to (100,101,112 and 211) planes respectively, in addition to some compounds appeared clearly such as kaolinite at diffraction peaks of (25.55, 26.55, 27.86 and 68.29º) which corresponding to (002, 111, 12͞1 and 302) muscovite at (22.05, 22.95, 24.02 and 68.30º) which corresponding to (112,͞113, 023 and 1 3 12), and montmorillonite at diffraction peak 26.63º which corresponding to (121) planes. The XRD data of Clay3+H3PO4 kaolinite significantly appeared at diffraction peaks of (12.55, 18.96, 24.17, 25.25, 28.00, 39.49, 50.22, 68.40º) which corresponding to (001, ͞101, 101, 002, ͞121, 0͞13, ͞2͞23 and 302) planes respectively, and the muscovite at (26.75, 29.90, 36.65º and 68.44) which corresponding to (024, 025, ͞133 and 1 3 12) planes respectively, also show the presence of quartz at diffraction peaks of (20.95, 26.75, 36.65, 50.25 and 60.02º) which corresponding to (100, 101, 110, 112 and 211) planes respectively and the montmorillonite at diffraction peaks (18.81 and 26.77º) which corresponding to (102 and 121) planes respectively.
In addition, the XRD data exhibit some impurities such as tetragonal crystal phase of anatase (TiO2) at diffraction peaks of (25.25 and 36.75º) which corresponding to (101 and 103) planes respectively. The FWHM (Full Width at Half Maximum) values and d-spacing for Clay3, Clay3+H2SO4 and Clay3+H3PO4 were tabulated in Table 3.
Table 3: FWHM values, d-spacing for Clay3, Clay3+H2SO4 and Clay3+H3PO4
|
Compounds |
Clay3 |
Clay3+H2SO4 |
Clay3+H3PO4 |
||||||
|
Quartz |
2θº |
d-spacing [Å] |
FWHM |
2θº |
d-spacing [Å] |
FWHM |
2θº |
d-spacing [Å] |
FWHM |
|
20.96 |
4.19422 |
0.213437 |
20.85 |
7.19967 |
0.1476 |
20.95 |
4.24090 |
0.1476 |
|
|
26.95 |
3.30759 |
0.219065 |
26.65 |
3.34344 |
0.1476 |
26.75 |
3.33467 |
0.1476 |
|
|
– |
– |
– |
– |
– |
– |
36.65 |
2.45154 |
0.1968 |
|
|
50.64 |
1.80957 |
0.159908 |
50.15 |
1.81872 |
0.1476 |
50.25 |
1.81576 |
0.1968 |
|
|
– |
– |
– |
59.88 |
1.5428 |
0.1476 |
60.02º |
1.54116 |
0.2952 |
|
|
montmorillonite |
18.96 |
4.64655 |
0.210290 |
– |
– |
– |
18.81 |
4.70187 |
0.1476 |
|
26.77 |
3.30759 |
0.219065 |
26.63 |
3.34344 |
0.1476 |
26.77 |
3.33467 |
0.1476 |
|
|
29.90 |
3.00223 |
0.180971 |
– |
– |
– |
– |
– |
– |
|
|
Muscovite |
22.30 |
3.98046 |
0.145776 |
22.05 |
4.03039 |
0.1476 |
26.75 |
3.33467 |
0.1476 |
|
28.32 |
3.15670 |
0.323319 |
22.95 |
3.87515 |
0.1476 |
29.90 |
2.99221 |
0.1968 |
|
|
– |
– |
– |
24.02 |
3.70463 |
0.1476 |
36.65 |
2.45154 |
0.1968 |
|
|
– |
– |
– |
68.30 |
1.37263 |
0.3444 |
68.44 |
1.37181 |
0.1476 |
|
|
Kaolinite |
12.84 |
6.92245 |
0.247611 |
– |
– |
– |
12.55 |
7.03802 |
0.1476 |
|
– |
– |
– |
– |
– |
– |
18.96 |
4.70187 |
0.1476 |
|
|
24.37 |
3.65651 |
0.372417 |
– |
– |
– |
24.17 |
3.69203 |
0.1476 |
|
|
– |
– |
– |
25.55 |
3.49797 |
0.1476 |
25.25 |
3.52465 |
0.1476 |
|
|
– |
– |
– |
26.55 |
3.34344 |
0.1476 |
28.00 |
3.17829 |
0.2952 |
|
|
– |
– |
– |
27.86 |
3.18997 |
0.2460 |
39.49 |
2.27713 |
0.1476 |
|
|
– |
– |
– |
– |
– |
– |
50.22 |
1.81576 |
0.1968 |
|
|
– |
– |
– |
68.29 |
1.37263 |
0.3444 |
68.40 |
1.37181 |
0.1476 |
|
|
Anatase |
25.25 |
3.49426 |
0.323382 |
25.25 |
3.49797 |
0.1476 |
25.25 |
3.52465 |
0.1476 |
|
– |
– |
– |
36.75 |
2.45640 |
0.1476 |
36.75 |
2.45154 |
0.1968 |
|
FTIR characterization
The vibrational behavior of the respective samples was examined in the range 400-4000 cm−1, using FTIR spectrometer. The clay samples were analyzed in powder form.
 |
Figure 2: FTIR spectrum of clay 3. |
Figure 2 shows the FT-IR spectrum of clay 3. The stretching bands of Al-OH at 3794.7 cm−1 and bending bands at 955.2 cm−1. Stretching bands at 3700.0 cm−1 related to the stretching vibrations of the internal O-H groups of water molecule 34. The large band at 1237-1150 cm−1 corresponds to Si-O stretching vibration, it is close to the bands that appeared in literature 30. Also, show discrete peaks between 700 and 950 cm−1 that indicates the cation composition in the octahedral sheet. The structural OH− bending mode in montmorillonite absorbs, the OH− bending mode of the Al2OH group absorbs near 955.2 cm−1; the OH− of Fe(III)AlOH absorbs at 820.1 cm−1 45. The adsorption bands at 524.6 and 632.0 cm–1 corresponding to the deformation of Si–O–Mg and Si–O–Al, respectively 34. The adsorption bands at 2939.5 cm−1 are due to a contribution from C-H stretching that can prove the presence of C-H sp3 groups 28. Band located at 1459.7 cm−1 correspond to the stretching of the vibrations of C-O 40.
TGA characterization
TGA of the various types of clays before and after treatment was carried out for each powder samples. It was exposed constant heating rate of 20°C/min was applied from 20 to 1000 °C in nitrogen atmosphere.
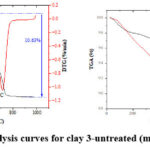 |
Figure 3: Thermal analysis curves for clay 3-untreated (mass change = -10.63 %). |
 |
Figure 4: Thermal analysis curves for clay 3+H2SO4 (mass change = – 8.46 %). |
 |
Figure 5: Thermal analysis curves for clay 3+H3PO4 (mass change = – 6.80%). |
This TGA analysis was carried out in order to determine how stable and potent the clay and to trace the structure changes that accompanying the thermal treatment. TGA of clay 3 before and after treatment are shown in Figure 3-5. The first degradation for clay 3-untreated was observed at 88.9°C which was caused by a loss of hydration in the formulations water [46], the second degradation was observed at 505.7 °C, while the third degradation occurred at 712.5°C as shown in Figure 3. The peaks that takes place at 510 and 720 °C are caused by the loss of the structural OH 29. For the clay 3 after treated with H2SO4, the first degradation occurred at 100.5°C, while the second one occurred at 492.1°C, as shown in Figure 4. For the clay 3 after treated with H3PO4, the first degradation occurred at 88.0°C, the second degradation was observed at 451.9°C, as shown in Figure 5. Clay contains water, the first degradation for the clay 3-untreated, clay 3+H2SO4 and clay 3+H3PO4 occurred at approximately the same temperature. Percentage loss in clay 3-untreated, clay 3+H2SO4 and clay 3+H3PO4 degradation was 10.63, 8.46 and 6.80 %, respectively. El-maghrabi & Mikhail, reported that the adsorption capacity of clay is directly proportional to the quantity of water that has been absorbed by the clay surface, represented by the first degradation at 100-200 °C 29. This cause may be explanation the preference of clay treated with sulfuric acid over treated with phosphoric acid according to the amount of water lost during thermal analysis.
Calibration curve
 |
Figure 6: UV–Vis spectrum for standard Aniline solutions. |
 |
Figure 7: The standard curve for determination of Aniline concentrations at 287 nm. |
Figure 7 illustrates the linear calibration curve for Aniline with a correlation coefficient (R2) value of 0.995, within the experimental concentration range, 10–100 ppm.
Effect of adsorbent nature and type of treatment:
 |
Figure 8: Effect of adsorbent nature and type of treatment on percentage removal of Aniline by clay (time= 5h; clay dose = 0.1g/20 mL; temp.= 25 °C). |
The best clay that gave a good result for the removal of the Aniline was clay 3 which has been treated with (2.5M H2SO4). Untreated and acid activated clay 3 were examined, it was found that percentage of Aniline removal with the acid activated was greater than untreated clay and the treatment with sulfuric acid was much better than the treatment with phosphoric acid as shown in Figure 8, %removal for untreated clay reached only 4.28% while it was at about 67.63% for clay3+H2SO4 at room temperature. This is consistent with 47 which reported that when comparing between the native and acid activated kaolinites as adsorbents to removal of Aniline from aqueous solutions found that the adsorption efficiency with the activated kaolinite was greater than native kaolinite, due to acid activation causing tiny pores to develop in solid particles, resulting in a greater surface area than NK. Acid activation improved the adsorbent capacity to a significant level, according to several studies which reported that clays’ adsorption capacities were frequently improved by acid treatment especially montmorillonite and its modified forms have significantly higher metal adsorption capacity than kaolinite and modified-kaolinite 16. The treating bentonite with hydrochloric acid increases the surface area of raw clays by up to five times which lead to formation of active acid centres on the smectite flakes from structural modifications 42. Also the acid treatment of kaolinite leads to an increase of adsorption capacity 32,48
Effect of adsorbent dosage
 |
Figure 9: Effect of adsorbent dosage on percentage removal of Aniline by clay 3+H2SO4 |
Table 4: Effect of adsorbent dosage on adsorbent capacity by clay 3+H2SO4 and clay 3+H3PO4
|
adsorbent dose (g) |
adsorbent capacity qe(mg/g) |
|
|
clay 3+H2SO4 |
clay 3+H3PO4 |
|
|
0.05 |
7.05 |
2.05 |
|
0.10 |
8.43 |
2.40 |
|
0.15 |
8.59 |
2.44 |
|
0.20 |
9.34 |
3.26 |
|
0.25 |
9.42 |
3.70 |
Figure 9 illustrates that as the adsorbent dose is increased, the % removal increases which can be explained by increasing of active adsorption sites 40. In addition, Table 4 shows a direct relationship between the adsorbent dosage and the adsorbent capacity, where the adsorption capacity increases with increase amount of adsorbents due to increase in available sites. The literature 13 found that the effect of the dose of adsorbent on the adsorption of Aniline by modified bentonite with sulfuric acid was studied by varying the amount of adsorbent from 0.4 to 1.5 g/L gave the opposite result. when the adsorbent dosage increases from 0.4 to 1 g/L, the amount of Aniline adsorbed decreases due to decrease in the activity of the adsorbent surface. (The best of percent removal efficiency = 96.84% at weight was 0.4 (g/L)). Azar et, al. stated that the removal of aniline by adsorption on HDTMA-Bent was examined by varying the dose of adsorbents from 10 to 50 g/L. It was observed that by increasing the dose of adsorbents from 10 to 30 g/L, the removal of aniline also increased, but the removal was negligible after this dose, so this value was chosen as the optimum dose. However, beyond this dose, the removal efficiency remains constant because, despite the increased reaction sites, the surface and Aniline concentrations reach a saturation point with each other, and the driving force is insufficient to overcome the resistances to adsorbate mass transfer between the aqueous and solid phases 49. In the study 50, the optimum dose for removal of Aniline from aqueous solution by Fe2O3@SiO2 nanocomposite as the adsorbent dose increased from 0.015 to 0.07 g/L was 0.05 g/L. Al-Johani & Salam stated that the removal efficacy of Aniline from the aqueous solution increased with dose increased, the increase in the percentage of Aniline removed because more active sites are available for adsorption as a result of the increased dosage of adsorbent 51.
Effect of time
 |
Figure 10: Effect of time on percentage removal of Aniline by (clay3+H2SO4) and (clay3+ H3PO4) (time= 1-5h; clay dose = 0.1g/20 mL; temp.= 25 °C; pH 6.62). |
The adsorption of Aniline on treated clay was studied as a function of contact time to determine the equilibrium time for maximum adsorption of Aniline and to study the kinetics of the adsorption process, the results are presented in Figure 10. The adsorption of Aniline onto clay increased with increasing time, equilibrium was reached in 3 hours. It was found that during the initial point of the process, a lot of vacant surface sites were available for adsorption, and the adsorption rate was also rapid, so most of the Aniline were adsorbed within the first 3 hours, while with increase of time, an equilibrium was achieved as the adsorbate occupied the majority of the available sites. Their results were comparable to that found by Azar et, al. who stated that the adsorption capacity of modified bentonites towards Aniline was investigated as a function of time, the removal of Aniline increased with the increase of agitation time until equilibrium was established within 6 hours 49. In the study conducted by Ahmadi & Igwegbe, Aniline takes less time than mentioned in Figure 10 to reach equilibrium by modified bentonite at (50 mg/L) as constant initial concentration, it was only 30 min 13. The variance in the equilibrium time of Aniline is due to the different nature of the adsorbent material.
Adsorption kinetics of Aniline
 |
Figure 11: Pseudo-first/second-order adsorption kinetics of Aniline on (clay 3+H2SO4). |
Table 5: Kinetic parameters for adsorption of Aniline on (clay 3+H2SO4).
|
Order of reaction |
Parameters |
|||||
|
Pseudo-first-order |
Intercept |
Slope |
qe, xp (mg/g) |
qe, cal (mg/g) |
K1 (min-1) |
R2 |
|
1.8767 |
-0.0155 |
8.4323 |
6.532175223 |
-0.00005170 |
0.8553 |
|
|
Pseudo-second-order |
Intercept |
Slope |
qe, cal (mg/g) |
K2 (g mg-1 min-1) |
R2 |
|
|
1.5397 |
0.1155 |
8.658008658 |
0.008664 |
0.9928 |
||
Table 5 indicates that the regression coefficients in the pseudo-second-order kinetic model of Aniline adsorption were higher or almost equal to the unit when compared to the pseudo-first-order model. It also illustrates that the amounts of calculated capacity (qe,cal) in the pseudo-second-order model were more comparable to the adsorption capacity from experiments than the pseudo-first-order model (qe,exp) 11,51.
Effect of temperature
 |
Figure 12:Effect of temperature on percentage removal of Aniline by clay 3+H2SO4 and clay 3+H3PO4 (time = 5h; clay dose = 0.1g/20 mL; temp.= 25-60 °C; pH 6.62). |
As shown in Figure 12 The %removal of Aniline by clay 3+H2SO4 was found to be increased with increasing temperature from 25 up to 60 ̊C. It is may be due to increasing into active sites by increasing temperature and the adsorbate gained enough energy to undergo interaction with the active sites. In addition to increase into the pores sizes by increasing the temperature. which is similar to the result obtained by Koyuncu & Kul, stated that the removal efficiency of Aniline from aqueous by using the kaolinite as adsorbent under three different temperatures 25, 35 and 45 ̊C increased with increasing temperature 47. Rahdar et, al. observed that the Aniline removal percentage onto Fe2O3@SiO2 nanocomposite increases with increasing temperature at different temperatures of 20, 35, 45, and 50 ̊C 50.
Aniline adsorption thermodynamics:
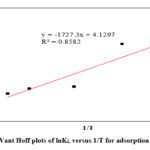 |
Figure 13: Vant Hoff plots of lnKL versus 1/T for adsorption of Aniline. |
Table 6: Thermodynamic parameters adsorption of Aniline on clay 3+H2SO4.
|
Temperature (°K) |
lnkL |
ΔG̊ (KJ/mol) |
ΔH̊ KJ/mol |
ΔS̊ J/mol |
R2 |
|
298 |
-1.6246 |
4.0250745 |
14.36077 |
34.33433 |
8.314 |
|
308 |
-1.61754 |
4.142056 |
|||
|
318 |
-1.16539 |
3.0811105 |
|||
|
328 |
-1.14308 |
3.1171686 |
|||
|
333 |
-1.09057 |
3.0193161 |
As presented in Table 6 the values of ΔH̊, ΔS̊ and ΔG̊ for all five temperatures 25, 35, 45, 55 and 60°C were positive. The positive amounts of ΔH̊ show that the adsorption process of Aniline on modified clay is the endothermic nature of Aniline adsorption, and unmistakably attributable to chemisorption [38]. Koyuncu & Kul, indicated that the positive values of ΔH indicate the endothermic behavior of the adsorption of Aniline by kaolinite modification with HCl acid 47. The calculated positive values of ΔS̊ indicate that during the adsorption process, the degree of randomness and disorderliness is increasing at the clay/aniline interface. 52.
Effect of pH
 |
Figure 14: Effect of pH on percentage removal of Aniline by clay 3+H2SO4 and clay 3+ H3PO4 (time = 5h; clay dose = 0.1g/20 mL; temp.= 25°C; pH 3-11). |
The influence of pH on Aniline adsorption was examined by conducting adsorption tests with clay 3+H2SO4 and clay 3+ H3PO4 as adsorbents throughout a pH range of 3 to 11. Figure 14 shows the variation of the % removal of Aniline depending on the pH of a solution containing 50 ppm of Aniline and 0.1 g/20 mL of the adsorbent. It is observed that % removal reaches their maximum at pH 3 and decreases with the increase in pH, which can be explained by considering Aniline is a weak base that can be protonated and produce positive ions at pH levels below its pKa (4.60) 10. Furthermore, the clay mainly has negative surface charges. Therefore, the positively charged Aniline could be better adsorbed onto adsorbents of negatively charged surfaces, but at pH higher than its pKa value, Aniline molecules are present in neutral or even in some negatively form. Thus according to 13, a repulsion force of negative charges of adsorbent and pollutants was occurred in alkali pH conditions. So removal efficiency of Aniline was decreased at pH more than pKa (4.60). These results were the opposite of 49 research regarding the adsorption of Aniline from aqueous solution, HDTMA-Bent was used. The results showed that increasing the initial pH value of the solution increased the removal efficiency of Aniline due to the adsorbent has mainly positive surface charges, uptake capacities (qe) were 8.39 mg/g at pH 12.
Conclusions
The present study shows clay can be used as an inexpensive sorbent for the sorption of Aniline as organic pollution from aqueous solution.
Adsorption of Aniline by modified clay was fast, with equilibrium reached in 3h, and they followed pseudo-second-order kinetics.
The maximum percentage removal of Aniline was found by clay 3+H2SO4 was (93.41%) under (time=5h; clay dose = 0.1g/20 mL; temp.= 25°C; pH=3).
The thermodynamic parameters refer to the adsorption of Aniline on modified clay was endothermic and chemisorption.
The existence of a negative charge on the silica surface sites of the clay was responsible for the adsorption of Aniline.
Aniline removal is favored by acidic pH.
From these observations, it can be concluded that clay can be applied as a non-hazardous material for remove of Aniline from contaminated water.
Acknowledgment
l would like to express my extreme gratitude to Dr. Hossein Bayahia who supervisor of this research. I convey my heartful thanks to Mr. Muhammad Al-Qarni for help me complete some analyses. Thanks to Dr. Mona Abo Elgasim for her help and advice. I would like to thank Albaha University, Faculty of Science and Chemistry department staff for their managements, teachings and assistances during my study at the University
References
- Rasul, G. Environ Dev. 2016,18,14-25. doi:10.1016/j.envdev.2015.12.001
CrossRef - Chaplin, M. F. Biochem Mol Biol Educ. 2001,29(2),54-59. doi:1470-X 175/01/$20.00
CrossRef - Yadav, M.; Gupta, R.; Sharma, R. K. Adv Water Purif Tech. 2019;15:355-383. doi:10.1016/B978-0-12-814790-0.00014-4
CrossRef - Otieno, O. M.; Atem, M. P. M. Int J Soc Sci Technol. 2016,1(2),59-92.
- Bibi, S.; Khan, R. U.; Nazir, R.; Khan, P.; Rehman, H. Hameed; Shakir, S. K.; Naz, S.; Waheed, M. A.; Jan, R. World Appl Sci J. 2016,34(1),15-19. doi:10.5829/idosi.wasj.2016.34.1.10252
- Pawari, M. J.; Gawande, S. Int J Eng Res Gen Sci. 2015,3(4),773-776. www.ijergs.org
- Edokpayi, J. N.; Odiyo, J. O.; Durowoju, O. S. Water Qual. Published online 2017:401-416. doi:10.5772/66561
CrossRef - Kamble, S. M. Int J Sci Res Publ. 2014,4(1),1-6. www.ijsrp.org
- Juneja, T.; Chaudhary, A. J public Heal Epidemiol. 2013,5(4),186-191. doi:10.5897/JPHE12.096
- Chen, C.; Geng, X.; Huang, W. Chem Eng J. 2017,327,941-952. doi:10.1016/j.cej.2017.06.183
CrossRef - Kakavandi, B.; Jonidi, A.; Rezaei, R.; Nasseri, S.; Ameri, A.; Esrafily, A. Iranian J Environ Health Sci Eng. 2013,10(1),19. doi:10.1186/1735-2746-10-19
CrossRef - Ghnimi, S. M.; Frini-srasra N. Appl Clay Sci. 2018,158,150-157. doi:10.1016/j.clay.2018.03.019
CrossRef - Ahmadi, S.; Igwegbe, C. A. Appl Water Sci. 2018,8(6),1-8. doi:10.1007/s13201-018-0826-3
CrossRef - Li, Y.; Jiang, W.; Wang, B. 5th International Conference on Advanced Materials and Computer Science. 2016,316-320. doi:10.2991/icamcs-16.2016.67
CrossRef - Abdelbasir S. M.; Shalan, A. E. Korean J Chem Eng. 2019,36(8),1209-1225. doi:10.1007/s11814-019-0306-y
CrossRef - Bhattacharyya, K. G.; Gupta, S. S. Adv Colloid Interface Sci. 2008,140(2),114-131. doi:10.1016/j.cis.2007.12.008
CrossRef - Bhanvase, B. A.; Shende, T. P.; Sonawane, S. H. Environ Technol Rev. 2017,6(1),1-14. doi:10.1080/21622515.2016.1264489
CrossRef - Einschlag, F. S. G.; Carlos, L. Waste Water – Treatment Technologies and Recent Analytical Developments. (Garca Einschlag FS, ed.). InTech; 2013. doi:10.5772/3443
CrossRef - Prabhu, P. P.; Prabhu, B. MATEC Web Conf. 2018,144,1-13. doi:10.1051/matecconf/201714402021
CrossRef - Singh, P.; Sharma, K.; Hasija, V.; Sharma, V.; Sharma, S.; Raizada, P.; Singh, M.; Saini, A. K.; Hosseini-Bandegharaei, A.;Thakur, V. K. Mater Today Chem. 2019,14,100186. doi:10.1016/j.mtchem.2019.08.005 CrossRef
- Mohanty, K.; Das, D.; Biswas, M. N. Adsorption. 2006,12(2),119-132. doi:10.1007/s10450-006-0374-2
CrossRef - Isaac, C. P. J.; Sivakumar, A. Desalin Water Treat. 2013,51(40-42),7700-7709. doi:10.1080/19443994.2013.778218
CrossRef - El Bastamy, E. E.; Ibrahim, L. A.; Ghandour, A.; Zelenakova, M.; Vranayova, Z.; Abu-Hashim, M. Sustainability. 2021,13(10),5738. doi:10.3390/su13105738
CrossRef - Jamil, T. S.; Ibrahim, H. S.; Abd El-maksoud, I. H.; El-Wakeel, S. T. Desalin J. 2010,258(1-3),34-40. doi:10.1016/j.desal.2010.03.052
CrossRef - Mnasri-ghnimi, S.; Frini-srasra, N. Appl Clay Sci. 2019,179,105151. doi:10.1016/j.clay.2019.105151
CrossRef - Yan, L.; Shan, X.; Wen, B.; Owens, G. J Hazard Mater. 2008,156(1-3),499-508. doi:10.1016/j.jhazmat.2007.12.045
CrossRef - Chaves, L. H. G.; Tit, G. A. Rev Ciência Agronômica. 2011,42(2),278-284. doi:10.1590/S1806-66902011000200004
CrossRef - Mohajeri, P.; Smith, C.; Selamat, M. R.; Abdul Aziz, H. Water. 2018;10(2). doi:10.3390/w10121875
CrossRef - El-maghrabi, H. H.; Mikhail, S. J Environ Earth Sci. 2014,4(19),38-47. www.iiste.org
- Macias-Quiroga, I. F.; Giraldo-Gómez, G. I.; Sanabria-González, N. R. Sci World J. 2018,2018,11. doi:10.1155/2018/5969178
CrossRef - Nayak, P. S.; Singh, B. K. Bull Mater Sci. 2007,30(3),235-238. doi:10.1007/s12034-007-0042-5
CrossRef - Bhattacharyya, K. G.; Gupta, S. S. 2006,45(21),7232-7240. doi:10.1021/ie060586j
CrossRef - Mafuyai, G. M. African J nvironment Nat Sci Res. 2021,4(3),16-44. doi:10.52589/AJENSR-0ZHQQUMW
CrossRef - Abbou, B.; Lebkiri, I.; Ouaddari, H.; Kadiri, L.; Ouass, A.; Habsaoui, A.; Lebkiri, A.; Rifi, E. Turkish J Chem. 2021,45(2),362-376. doi:10.3906/KIM-2004-82
CrossRef - Pakade, V. E.; Nchoe, O. B.; Hlungwane, L.; Tavengwa, N. T. Water Sci Technol. 2017,75(1),196-206. doi:10.2166/wst.2016.506
CrossRef - Alves, D. C. S.; Coseglio, B. B.; Pinto, L. A. A.; Jr, T. R. S. C. J Mol Liq. 2020,309,113256. doi:10.1016/j.molliq.2020.113256
CrossRef - Pap, S.; Kirk, C.; Bremner, B.; Sekulic, M. T.; Shearer, L.; Gibb, S. W.; Taggart, M. A. Water Res. 2020,173,115573. doi:10.1016/j.watres.2020.115573
CrossRef - Tran, H. N.; You, S.; Chao, H. Biochem Pharmacol. Published online 2016. doi:10.1016/j.jece.2016.05.009
CrossRef - Orumwense, F. F. O. J Chem Technol Biotechnol. 1996,65(4),363-369. doi:10.1002/(sici)1097-4660(199604)65:4<363::aid-jctb435>3.0.co;2-3
CrossRef - Frissel, M. J. The Adsorption of Some Organic Compounds, Especially Herbicides, on Clay Minerals. 1961, Vol 67.
- Christidis, G. E.; Scott, P. W.; Dunham, A. C. Appl Clay Sci. 1997,12(4),329-347. doi:10.1016/s0169-1317(97)00017-3
CrossRef - Amari, A.; Gannouni, H.; Khan, M. I.; Almesfer, M. K.; Elkhaleefa, A. M.; Gannouni, A. Appl Sci. 2018,8(11),2302. doi:10.3390/app8112302
CrossRef - Zhang, Y.; Yan, L.; Xu, W.; Guo, X; Cui, L.; Gao, L.; Wei, Q.; Du, B. J Mol Liq. 2014,191,177-182. doi:10.1016/j.molliq.2013.12.015
CrossRef - Djomgoue, P.; Njopwouo, D. J Surf Eng Mater Adv Technol. 2013,03(04),275-282. doi:10.4236/jsemat.2013.34037
CrossRef - Olopade, B. K.; Nwinyi, O. C.; Adekoya, J. A.; Lawal, I. A.; Abiodun, O. A.; Oranusi, S. U.; Njobeh, P. B. Sci World J. 2020,2020,1-5. doi:10.1155/2020/6943514
CrossRef - Koyuncu, H.; Kul, A. R. Colloids Surfaces A. 2019,569,59-66. doi:10.1016/j.colsurfa.2019.02.057
CrossRef - Gao, W.; Zhao, S.; Wu, H.; Deligeer, W.; Asuha, S. Appl Clay Sci. 2016,126,98-106. doi:10.1016/j.clay.2016.03.006
CrossRef - Azar, M. T.; Leili, M.; Taherkhani, F.; Bhatnagar, A. Desalin Water Treat. 2016,57(51),24430-24443. doi:10.1080/19443994.2016.1138890
CrossRef - Rahdar, A.; Rahdar, S.; Labuto, G. Environ Sci Pollut Res. 2020,27(9),9181-9191. doi:10.1007/s11356-019-07491-y
CrossRef - Al-Johani, H.; Salam, M.A. J Colloid Interface Sci. 2011,360(2),760-767. doi:10.1016/j.jcis.2011.04.097
CrossRef - Nayl, A. E. A.; Elkhashab, R. A.; El Malah, T.; Yakout, S. M.; El-Khateeb, M. A.; Ali, M. M. S.; Ali, H. M. Environ Sci Pollut Res. 2017,24(28),1-10. doi:10.1007/s11356-017-9878-4
CrossRef
Second Review by: Dr. Ioana Stanciu
Final Approval by: Dr. Mapule P Seabelo


ISSN Online: 2231-5039

![]()


