Innovative Study of Photogalvanics in Solar Energy Transformation and Performance Analysis: Alizarin Cyanine Green, EDTA, and Sodium Stearate System
K R Genwa and Hari Prasad *
Photochemistry Laboratory, Department of Chemistry, Faculty of Science, New Campus, Jai Narain Vyas University, Jodhpur, Rajasthan 342001, India.
Corresponding Author E-mail: hariprasadsolarlab@gmail.com
DOI : http://dx.doi.org/10.13005/ojc/390216
Article Received on : 18 Jan 2023
Article Accepted on :
Article Published : 11 Apr 2023
Reviewed by: Dr. Erum Fida Hussain
Second Review by: Dr. Gunawan
Final Approval by: Dr. Pounraj Thanasekaran
A systematic analysis of experimentally, solar parameters of photogalvanics has been studied for performance analysis using the D-R-S (Dye - Reductant – Surfactant) system as alizarin cyanine green – EDTA- sodium stearate system. A H shaped photogalvanic system was used under investigation for innovative results. Different scientific instruments were used in methodology set up i.e., microammeter, digital pH meter, and light source (200 W Philips bulb), multi-meter, calomel electrode(saturated), Pt electrode, and circuit key. The photogalvanic parameters were studied using H cell glass tubes as PP (Photo-Potential), PC (Photo-Current), CF (Conversion Efficiency), FF (Fill-Factor) & PA (Performance Analysis). The experimental results are as follows: 733.0 mV, 477.0 mA, 1.7984 %, 0.2640 and 180.0 minutes. The observed electrical outputs are better than previously published electrical outputs with respect to alizarin cyanine green, EDTA, and sodium stearate system.
KEYWORDS:Alizarin cyanine green Photogalvanic cell; Fill factor; Photocurrent; Photopotential; Solar energy
Download this article as:| Copy the following to cite this article: Genwa K. R, Prasad H. Innovative Study of Photogalvanics in Solar Energy Transformation and Performance Analysis: Alizarin Cyanine Green, EDTA, and Sodium Stearate System. Orient J Chem 2023;39(2). |
| Copy the following to cite this URL: Genwa K. R, Prasad H. Innovative Study of Photogalvanics in Solar Energy Transformation and Performance Analysis: Alizarin Cyanine Green, EDTA, and Sodium Stearate System. Orient J Chem 2023;39(2). Available from: https://bit.ly/43ByVsa |
Introduction
The global scientific community continually works on energy for scientific development. Solar energy is a unique key in the field of energy and plays an important role as an alternative energy source. Depletion of fossil fuels are responsible for next searching way of alternative energy. Solar energy is based on photogalvanic and photovoltaic cells for energy transformation and storage with respect to electrical outputs. The dye-based storage capacity of photogalvanic are good over photovoltaic cells and due to this reason, D-R-S (Dye – Reductant – Surfactant) system is comparatively good in field of photogalvanics.
In 1925, Eric Keightley and Edward Gardner were studied light action1. In 1940, Rabinovitch was studied on light iron based system2. In 1977, Iron-thazina photogalvanics3, In 1978, Hall et al., were observed the electronic phenomena4, In 1989, Ameta et al.5, In 1999, miscelles6, In 2010, Safranine7, In 2011, performance of photogalvanics8 studied. In 2013, Mohan Lal and Gangotri KM9, In 2013, Gangotri KM and Lal Mohan10, mixed surfactant11,12, In 2017, Saini Shiv and Meena Shankar & Meena Ramesh13, In 2018, single surfactant14, In 2021, sudan-I dye15, In 2021, Perovskite Solar Cells16, In 2021, Zhao, et al.17 also studied. In 2021, Chen, et al.18, In 2021, Koli et al19 reported outstanding work. Later on, Optimum results24, improved efficiency25and very similar work reported on TB (Toluidine Blue)26. Genwa and Shraddha27 and in order to performance28-30, and A numerous Photochemists31-34 worked and also symmetrical results on photogalvanic35-36 solar cells. The different group of researchers worked on photogalvanic cells but on one worked on Alizarin cyanine green, EDTA, and sodium stearate system for better electrical output and due to this reason, the present research work was undertaken for scientific investigation.
Methodology
Material and Methods
Solutions used for photogalvanics
Dye- Alizarin cyanine green, reductant – EDTA, Surfactant- sodium stearate, NaOH (1N), Oxalic acid, and double distilled water.
Scientific instruments used for photogalvanics
Aspecially designed glass tubes,calomel electrode (saturated), Carbon pot, Multi – meter, 250 k Roistered, Digital pH meter, Platinum electrode, Microammeter, Resistance key, and 200 W tungsten bulb.
Experiment Method
A Specially designed photogalvanic cell was used for solar transformation of photochemical conversion and storage (figure1). The photogalvanic cell has two lobes named as dark chamber and illumination chamber. Saturated calomel electrode connected with dark chamber and platinum electrode connected with illumination chamber. The photochemical electrical circuit was completed by using of required scientific instrumentations i.e., specially designed glass tubes,calomel electrode (saturated), carbon pot, Multi – meter, 250 k Roistered, Digital pH meter, Platinum electrode, Microammeter, Resistance key, and 200 W light sources. We have kept the volume of solution up to 30 ml during the electrochemical and photochemical process of the photogalvanic cell. Water filter was used for ultra-filtration of radiations.
Nature of the solution was alkaline for pH measurement during the experiment. The electrolytical configuration was as fellow: Dye- Alizarin cyanine green, reductant – EDTA, Surfactant- sodium stearate, NaOH (1N), Oxalic acid, doubly distilled water. The strength of electrolytic solution were as follows: dye M/5000, Reductant M/2000, Surfactant M/200 and 1N NaOH. The figure-1 is given for the photochemical set up for performance analysis.
 |
Figure 1: Experimental set up of photogalvanics |
Result and Discussion
Variation effect of surfactant strength (sodium stearate concentration) on the photogalvanics
In the initial stage of the photogalvanic experiment, electrical outcomes were increased on increasing the strength of surfactant and after a particular range of strength (ongoing experiment) it reached an optimum position. After optimum position of electrical outcomes, it decreased continually. The variation was obtained due to the electron transfer process in hydrophilic hydrophobic interaction of a large number of surfactant molecules in electrochemical processes. At optimum position, three will be required: a number of surfactants molecules are responsible for results. The photochemical outcomes of energy conversion and storage are given in table 1 to 5.
Variation effect of photosensitizer strength (alizarin cyanine green concentration) on the photogalvanics
On initial stage of photogalvanic experiment, electrical outcomes were increased on increasing of strength of photosensitizer and after particular range of strength (ongoing experiment) it reached at optimum position. After optimum position of electrical outcomes its decreased continuously. above variation was obtained due to electron transfer process in hydrophilic hydrophobic interaction of large number of photosensitizer molecule (dye molecule) in electrochemical process. At optimum position, three will be required number of photosensitizer molecule (dye molecule) molecules are responsible for results. The photochemical outcomes of energy conversion and storage are given in table 1 to 5.
Variation effect of reductant strength (EDTA concentration) on the photogalvanics
In the initial stage of the photogalvanic experiment, electrical outcomes were increased on increasing the strength of the reductant and after a particular range of strength (ongoing experiment) it reached an optimum position. After optimum position of electrical outcomes, it decreased continuously. The above variation was obtained due to the electron transfer process in hydrophilic hydrophobic interaction of large numbers of reductant molecules (EDTA molecule) in electrochemical processes. At optimum position, three will be required: a number of reductant molecule (EDTA molecule) molecules are responsible for results. The photochemical outcomes of energy transformation and performance analysis are given in table 1 to 5.
Table 1: Effects of variation of Alizarin cyanine green concentration on electrical output of photogalvanics.
|
S.No. |
Concentration of dye taken for experiment: Alizarin cyanine green X 10-4 M) |
Observed results of photopotential (mV) |
Observed results of photocurrent (µA) |
|
1 |
1.20 |
837 |
377 |
|
2 |
1.40 |
883 |
407 |
|
3 |
1.60 |
935 |
442 |
|
4 |
1.80 |
888 |
410 |
|
5 |
2.00 |
833 |
380 |
Table 2: Effects of variation of EDTA concentration on electrical output of photogalvanics
|
S.No. |
(EDTA×10-4) |
Observed results of photopotential (mV) |
Observed results of photocurrent (µA) |
|
1 |
2.15 |
816 |
381 |
|
2 |
2.20 |
886 |
410 |
|
3 |
2.25 |
934 |
439 |
|
4 |
2.30 |
889 |
406 |
|
5 |
2.35 |
819 |
379 |
Table 3: Effects of variation of sodium stearate concentration on electrical output of photogalvanics
|
S.No. |
(Sodium stearate X 10-4) |
Photopotential (mV) |
Photopotential (mV) |
|
1 |
1.72 |
817 |
382 |
|
2 |
1.77 |
882 |
413 |
|
3 |
1.98 |
935 |
440 |
|
4 |
1.76 |
873 |
410 |
|
5 |
1.68 |
821 |
379 |
Table 4: Electrical output of photogalvanics for performance analysis:
|
S. No. |
Time (Minute) |
Power (mW) |
|
1 |
35.0 |
137.76 |
|
2 |
40.0 |
133.11 |
|
3 |
45.0 |
129.33 |
|
4 |
50.0 |
124.47 |
|
5 |
55.0 |
119.98 |
Table 5: Comparison of present study with Previous reports.
|
S. No. |
Parameters |
Alizarin cyanine green, EDTA, sodium stearate system |
Methylene blue, Xylose NaLS, Tween-80 system |
Methylene blue, Xylose NaLS, CTAB system |
DSS, Tartrazine EDTA system |
|
|
|
Present Study |
Previous works |
||
|
1 |
Conversion efficiency |
1.7984% |
0.5313% |
0.4326% |
0.6163% |
|
2 |
Storage capacity |
180.0 minutes |
100.0 minutes |
90.0 minutes |
100.0 minutes |
|
3 |
Fill factor |
0.2640 |
0.3024 |
0.2770 |
0.2800 |
|
4 |
Photopotential |
733.0 mV |
645.0 mV |
655.0 mV |
493.0 mV |
|
5 |
Photocurrent |
477.0 mA |
210.0 mA |
190.0 mA |
130.0 mA |
Current–voltage (i-V) characteristics of the photogalvanics
The fill factor of photogalvanics was calculated by using photochemical values i.e., Potential at power point (Vpp) =462 mV, Current at power point (ipp) =200 µA, Potential at open circuit (Voc) =1033 mV, Current at short circuit (isc) =477µA, and obtained value of fill factor (h)= 0.2640, The power point of cell (pp) = 164.1, (see the figure 2).

 |
Figure 2: Current-voltage (i-V) curve of the photogalvanics |
Photogalvanic performance analysis and conversion efficiency
The conversion efficiency of photogalvanic was calculated by using photochemical values i.e., Photopotential at power point (Vpp,) = 462 mV, Photocurrent at power point (ipp) =200 µA, Electrode area for photogalvanics (A) and obtained values was1.7984% (See the figure 3). The photogalvanic performance was 129.00 minutes for D-R-S System.

 |
Figure 3: Photogalvanics performance analysis |
Photochemical reaction Mechanism of current generation in the photogalvanics
Illuminated chamber (at platinum electrode)
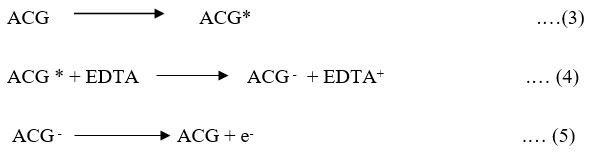
Photochemical reaction at illuminate chamber and photochemical reaction at platinum electrode as below
Dark Chamber: At counter electrode
Proposed reaction mechanism is given for alizarin cyanine green, EDTA, and sodium stearate system.
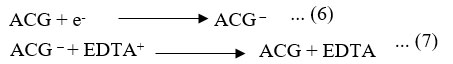
Where: ACG = Alizarin cyanin green dye molecule, ACG * = Excited alizarin cyanin green molecule, ACG – = Semi form of alizarin cyanin green molecule, EDTA = reductant molecule, EDTA+ = Oxidized form of the reductant,
Scientific comparison with past studies in photogalvanics for conversion and storage
All observed results are good in comparison to previous photogalvanics i.e., conversion efficiency and storage capacity, 1.7984% and 180.0 minutes respectively. These results are relatively good in comparison to previously reported cells containing as DSS, Tartrazine and EDTA as given (0.6163% and 100.0 minutes), NaLS+CTAB, Methylene blue and Xylose (0.4326% and 90.0 minutes), NaLS+Tween-80), Methylene blue and Reductant (0.5313% and 100.0 minutes), Micellar Effect on Photogalvanics: Solar Energy Conversion and Storage–EDTA-Safranine O-TWEEN-80 System(0.1469% and 20.0 minutes) developed by Rathore Jayshree and Lal Mohan (2018), Gangotri KM and Mohan lal (2013), Lal Mohan and Gangotri KM (2012) and Gangotri and Gangotri (2010), respectively.
The observed electrical values are (1.7984% and 180.0 minutes) relatively lower in conversion efficiency but higher in storage capacity in comparison to recently reported photogalvanic cells with Indigo Carmine dye (27.79% and 115.0 minutes), bromo cresol green (9.02% and 70.0 minutes), developed recent. Therefore, the photogalvanic cell containing Alizarin cyanine green, EDTA, and sodium stearate system is better than existing cells.
Conclusion
Case study in photogalvanics and Limitation and Future scope:
A huge proportion of world electricity generation is based on coal industries. The theoretical conversion efficiency of PG cells is about 24-35%, but observed conversion efficiency is quite low (0.7995%) due to dye based photochemical environment. This limitation encountered in the area of development of photogalvanic cells is discussed from time to time. However, over the next few decades, the world will have to significantly reduce its coal and oil use to accelerate climate action. Currently, about more than half of the world energy requirement is fulfilled by hydrocarbon materials.
Novelty of Alizarin cyanine green, EDTA, and sodium stearate system
The Alizarin cyanine green, EDTA, and sodium stearate system is more efficient than mixed surfactants with methylene blue. The sodium stearate has not only enhanced the conversion efficiency but storage capacity of photo galvanic cells in a catalytic way. Alizarin cyanine green, EDTA, and sodium stearate systems have conversion efficiency, t1/2 and fill factor are recorded as 1.7984%, 129 min. and 0.2640 respectively. Alizarin cyanine green, EDTA, and sodium stearate system have potential at power point, Potential at open circuit, power point of cell (pp) and current at short circuit were also studied and obtained values are as follows: 1033 mV, 164.1 mV, 200 and 477µA.
Acknowledgment
Authors are thankful to Head, Department of Chemistry, Jai Narain Vyas University, Jodhpur, Rajasthan,342001, INDIA for necessary research facilities. Hari Prasad (Co- author) is thankful to his research supervisor for scientific guidance.
Conflicts of Interest
Authors have no conflict of interest.
References
- Eric, KR.; Edward, GW.; J. Chem. Soc., 1925, 127,258-269.
CrossRef - Rabinovitch, E.; J Chem. Phy., 1940,8(7),551-559.
CrossRef - Peter, D.; David, R.; Hobart, N.; Hall, A.; Solar Energy., 1977,19(5),567-570.
CrossRef - Hall, D.E.; Wildes, P.D.; and Lichtin, N.N.; J. Electrochem. Soc., 1978,125(9),1365.
CrossRef - Ameta, SC.; Lodha, S.; J Photochem. Photobio. Chem., 1989, 48(1), 81-86.
CrossRef - Gangotri, KM.; Meena RC.; J. Photochemi. Photobio. Chem., 1999,123(1-3),93-97.
CrossRef - Gangotri, P.; Gangotri KM.; Arabian J. Sci. Eng., 2010,35(1A),19-28.
- Bhimwal, MK.; Gangotri, KM.; Energy., 2011,36,1324-1331.
CrossRef - Mohan, L.; Gangotri, KM.; Res. J. Rec. Sci., 2013,2(12),19-27.
- Gangotri, KM.; Lal, M.; Research Journal of Chemical Sciences., 2013, 3(3):20-25.
- Lal, M.; Gangotri, KM.; Research Journal of Recent Sciences., 2013, 2,76-81
- Mohan, L.; Gangotri, KM.; Chemistry and Environment, Campus Books Int., New Delhi, India., 2015, pp 32-44. ISBN: 978-81-8030-432-3
- Saini, S.; Meena, S.; Meena, R.; Adv. Chem. Eng. Sci., 2017, 07,125-136.
CrossRef - Rathore, J.; Lal, M.; Res. J. Chem. Environ., 2018,22(6),53-57.
- Pooran, K.; Arabian Journal of Chemistry., 2021,14,2986-2991.
- Wu, T.; Qin, Z.; Wang, Y.; Nano-Micro Lett., 2021,13,152.
CrossRef - Zhao, C.; Tang, CG.; Seah, ZL.; Nat Commun., 2021,12,2250.
CrossRef - Chen, Y.; Du, C.; Sun, L.; Sci Rep., 2021,11,14550.
CrossRef - Koli, P.; Pareek, RK.; Dayma ,Y.; Jonwal, M.; Energy Reports. 2021, 1(7),3628-38.
CrossRef - Koli, P.; Dayma, Y.; Pareek, R.; Jonwal, M.; J. Electroana.Chem.,2022,1, 904:115942.
CrossRef - Rathore, J.; Arya R.; Sharma, P.; Lal, M.; Res. J. Chem. Environ., 2022, 26(6),24-29
CrossRef - Rathore, J.; Arya, R.; Sharma, P.; Lal, M.; Ind. J. Sci. tech., 2022, 15(23):1159-1165
CrossRef - Mohan, L.; Gangotri, KM.; Int. J. energy res., 2022, 46,14,19538-19547.
CrossRef - Genwa, KR.; Singh, K.; Smart Grid Renewable Energy., 2013, 4, 306-311
CrossRef - Genwa, KR.; Sagar, CP.; JJPS, 2013, 8(29),1515-1525,
- Genwa, KR.; Arun, K.; Abhilash, S.; Applied Energy., 2009, 86 1431–1436.
CrossRef - Genwa, KR.; Shraddha., Materials Science-Poland., 2015, 33(3),612-619.
CrossRef - Bose, S.; Genwa, KR.; Mater. Sci. Pol., 2018, 36(3), 1-10.
CrossRef - Chouhan, A.; Genwa, KR.; Energy., 2011, 2(1),18-24.
CrossRef - Koli P.; Arabian Journal of Chemistry., 2017, 10(8), 1077-83.
CrossRef - Gangotri, KM.; Bhimwal, M.; Mahesh, K.; Int. J. Energy Res., 2010, 35,545–552.
CrossRef - Koli, P.; Sharma, U.; and Gangotri, KM.; J. Renewable Energy., 2012, 37(1), 250-258.
CrossRef - Genwa, KR.; Arun, K.; J. Int. J. of Ren. Energy Tech., 2012, 3(2), 174–188.
CrossRef - Mall, C.; Solanki, PP.; Energy Reports., 2018, 4, 23-30.
CrossRef - Genwa, KR.; Mahavar, C.; Soni, V.; J. Material Science., 2019, 6, 45-58.
- Yadav, SK.; Kumari, R.; Gunsaria, RK.; J. Adv. Sci. Res., 2022,13(04), 12-8.
CrossRef

This work is licensed under a Creative Commons Attribution 4.0 International License.
About The Author
![]()
A New Edition of Web of Science
Journal Impact Factor
2022: 0.5
Five Year: 0.8
Journal is Indexed in

Cabells Whitelist
![]()


