Impact Assessment of Diwali Fireworks Emissions on the Air at Special Locations in Delhi During Three Consecutive Years
Subhadra Rajpoot*
Department of Applied science and Humanities, Amity University, Gr. Noida (U.P.), India.
Corresponding Author E-mail: srajpoot@gn.amity.edu
DOI : http://dx.doi.org/10.13005/ojc/390221
Article Received on : 27 Feb 2023
Article Accepted on : 11 Apr 2023
Article Published : 01 May 2023
Reviewed by: Dr. Vijay Bhamare
Second Review by: Dr. Nandita Malhotra
Final Approval by: Dr. Luigi Campanella
India is renowned as a place of celebrations. Festivals commemorate not only the change of the seasons but also the harvest, peace, and the birthdays of saints, gurus, prophets, as well as gods and goddesses. When it comes to their religious beliefs, Indians are noted for having a varied range of customs, including fasting, abstinence, and other behaviours. One of the biggest Hindu holidays, Diwali, takes place every year between October and January. The Hindu holidays of Navratri, Dussehra, Durga Puja, and Diwali all fall during these months. A significant amount of dry garbage is produced during and after these festival days. Due to the lack of disposal space during holidays like Diwali and other overlooked issues like extensive firecracker burning, especially in the late hours, which is a substantial producer of aerosols, black carbon (BC), organics, and trace gases, the amount of dry trash increases. It was discovered that frequent sparkler use was connected to incidents of short-term air quality impairment. An afternoon following Diwali in every year, the Indo-Gangetic Plain experiences an increase in air pollution levels that make it difficult to breathe. On Friday, Delhi had its worst post-Diwali air quality in five years due to a deadly concoction of poisonous gases from firecrackers and stubble. To calculate the impact of Diwali on Delhi's air quality, we used hourly data on PM 2.5 particle content from last three years 2020 to 2022. By estimating the Diwali influence on air quality using the event study method and a difference-in-difference regression framework, we improve on previous research. According to the findings, Diwali is associated with a marginal but statistically significant rise in air pollution. In different parts of Delhi, the impact varies. This is the first causal estimate of the air pollution caused by igniting Diwali firecrackers that we are aware of.
KEYWORDS:Air Pollution Delhi; Control Measures, Health; PM 2.5; PM 10; Statistical Analysis
Download this article as:| Copy the following to cite this article: Rajpoot S, Impact Assessment of Diwali Fireworks Emissions on the Air at Special Locations in Delhi During Three Consecutive Years. Orient J Chem 2023;39(2). |
| Copy the following to cite this URL: Rajpoot S, Impact Assessment of Diwali Fireworks Emissions on the Air at Special Locations in Delhi During Three Consecutive Years. Orient J Chem 2023;39(2). Available from: https://bit.ly/3Nx4Ggp |
Introduction
Delhi surpassed Tokyo as the world’s most polluted city in 2014 1, 2. It has been on the list of the most polluting cities in the world ever since 3. Since particles are suspended in the air for a longer period during the winter (October–January), when temperatures are lower, winds are stronger, and relative humidity is higher, air pollution is severe. To prepare the ground for the upcoming sowing season, farmers in the neighbouring states of Punjab and Haryana burn the stubble from the previous harvest in early November. This smoke is transported to Delhi, where it adds to the haze.
According to data from the Central Pollution Control Board, the day after Diwali saw the worst post-Diwali air quality in Delhi in last five years as a deadly concoction of poisonous fumes from firecrackers and stubble burning drove the 24-hour average AQI to 462. (CPCB). Delhi On the day of Diwali this year, the AQI rose to 382, 414 in 2020, and 337 in 2021. When people disobeyed the prohibition on using firecrackers to celebrate Diwali, a thick layer of deadly haze began to cover Delhi-NCR on Friday. Emissions from field fires in the area also reached a 36 percent peak. This results from a variety of weather reasons, the burning of stubble in neighbouring states, and increased local emissions due to the use of firecrackers.
The amount that igniting firecrackers contributes to air pollution is a crucial subject since actions like banning the sale of firecrackers have a major financial impact on those who work in the industry. There was also “severe” air pollution in the nearby cities of Faridabad (469), Greater Noida (464), Ghaziabad (470), Gurgaon (472) and Noida (475). The Delhi government had launched an aggressive campaign against the sale and usage of firecrackers before the holiday season and declared a blanket ban on them till January 1, 2022.
“Fireworks do contribute to the city’s air pollution, but the weather is the main cause. Winds and temperatures were favourable this year. Over the coming days, the northwest-flowing winds will continue, and the pollution levels will decline. However, it will continue to fall into the poor or extremely poor group.”
To address the growing air pollution situation in the nation’s capital, the Delhi Government led administration made the decision to undertake Stage IV of the Graded Response Action Plan. Following this, both the entry of trucks and construction-related activities were prohibited in Delhi-NCR. the minister of environment for Delhi, also announced that primary schools would be closed until November 9 and that 50% of public employees might work from home. Arvind Kejriwal, the chief minister of Delhi, alluded to adopting the odd-even rules for driving during the news conference. However, the report indicates that 56% of Delhi residents oppose the odd-even air pollution reduction plan.
The experts’ remarks came as Delhi once more resembled a gas chamber following Diwali. Instead of coming up with answers, the political leadership has played the typical blame game. It is not a recent discovery that air pollution kills Indians, both children and adults. The State of Global Air 2020 report, which was published on October 21, 2020, found that more than 116,000 infants in India passed away within a month of birth in 2019 as a result of air pollution, both indoor and outdoor. Another study that was released in Environmental Research in February 2021 discovered that 2.5 million premature deaths in India in 2018 were attributable to air pollution and higher particulate matter 2.5 concentrations in ambient air that were brought on by the burning of fossil fuels.
The focus of current study on the effects of Diwali on India’s air quality on the environment and human health has been on determining the concentration of pollutants in the area around Diwali. For instance, 8 discovered that in Lucknow, Diwali day average concentrations were 2.49 and 5.67 times higher than pre-Diwali and regular day concentrations, respectively. Additionally, they discovered that compared to pre-Diwali and regular days, SO2 concentrations were 1.95 and 6.59 times greater. 7 looked at metal concentrations and discovered that substantial amounts of metals discharged in the air during Diwali caused to considerable air pollution. More recently, 15 examined PM 10 loads and chemical compounds in the days before, during, and following Diwali and discovered that fireworks considerably increased emissions.
In this study, we assess the impact of Diwali on Delhi’s PM 2.5 particle concentration using hourly data from 2020 to 2022. By estimating the impact of Diwali on air quality using the event study method and a difference-in-difference regression framework, we improve on previous research. We discover that Diwali causes an air pollution rise that is marginal but statistically significant. In different parts of Delhi, the impact varies. This is the first causal estimate of the air pollution caused by igniting Diwali firecrackers that we are aware of.
Methods
Ethics Statement
The study can include the following steps:
Selection of locations: Different locations in Delhi can be selected for the study based on their proximity to areas with high firework usage, traffic density, and industrial activities. The locations should be representative of different parts of the city.
Measuring air quality: Air quality measurements can be taken at the selected locations before, during, and after the Diwali festival. Parameters such as particulate matter, nitrogen dioxide, sulphur dioxide, ozone, and carbon monoxide can be measured using real-time monitoring equipment.
Analysis of data: The data obtained from air quality measurements can be analysed to determine the impact of fireworks emissions on air quality. Statistical methods such as ANOVA, regression analysis, and correlation analysis can be used to determine if there is a significant increase in pollutant concentrations during Diwali.
Health impact assessment: Health impact assessment can be conducted to determine the potential health risks associated with exposure to fireworks emissions. The health impact assessment can include a literature review of previous studies on the health effects of fireworks emissions and an estimation of the potential health impacts on the population living in the selected locations.
Communication of findings: The findings of the study can be communicated to the public, policymakers, and other stakeholders through scientific publications, workshops, and conferences.
The findings can also be used to develop policies and strategies aimed at reducing the impact of fireworks emissions on air quality and public health. All the meteorological data collected at the five monitoring sites used in this study are publicly available on the internet, and no specific permissions are required to access these sites.
PM (Particulate Matter) levels during Diwali
There are numerous air contaminants, including ozone, nitrogen dioxide, nitric oxide, and carbon monoxide (O3). Small particulate matter, or PM 2.5, which consists of a mixture of liquid and solid droplets with an airborne diameter of less than 2.5 micrometres, is the worst of these. All forms of combustion, including those in automobiles, power plants, and some industrial activities, produce PM 2.5 particles. This is a tiny, inhalable particle that typically has a diameter of 2.5 micrometres or less. Most of the PM 2.5 is produced through the combustion of wood, oil, gasoline, or diesel fuel. Compared to PM 10, the tiny particulate matter can be more damaging since it can be drawn deep into the lungs. It can erode and irritate the epithelial walls of the lung, which affects lung function. It can also permeate the lung profoundly.
The National Library of Medicine in the US claims that although PM 2.5 have small diameters, they can spread over enormous surface areas. They “are capable of carrying a variety of harmful materials, passing past the filtration of nose hair, reaching the end of the respiratory tract with airflow and accumulating there through diffusion, injuring other regions of the body through air exchange in the lungs. Over 90% of the world’s pollution comes from hazardous, contaminated outdoor air, according to the World Health Organization (WHO), which has classified air pollution as a public health emergency.
For particulate matter (PM) data that was tracked during Diwali for three years in a row, four studies were done. The research was carried out for the years 2020, 2021, and 2022 for 24 hours, from noon on Diwali to noon on Diwali (next day from Diwali).
The first study compares the PM levels during Diwali night over the previous three years.
To track the PM levels on the same day as this year’s Diwali, the second study is focused on the PM levels on October 24.
The third study is based on Delhi’s zone-by-zone PM concentration on October 24, 2022.
The fourth study attempts to give a summary of the top cities with the worst Diwali PM pollution impacts.
The study will offer data analysis and comparison on a number of factors that have impacted PM levels over time as well as changes in PM concentration. PM is expressed as g/m3
Table 1
|
Qualitativ e Name |
Index or Sub Index |
Pollutant hourly density in µg/m3 |
|||
|
|
NO2 |
PM10 |
O3 |
PM2.5(optional |
|
|
Very low |
0-25 |
0-50 |
0-25 |
0-60 |
0-15 |
|
Low |
25-50 |
50-100 |
25-50 |
60-120 |
15-30 |
|
Medium |
50-75 |
100-200 |
50-90 |
120-180 |
30-55 |
|
High |
75-100 |
200-400 |
90-180 |
180-240 |
55-110 |
|
Very High |
>100 |
>400 |
>180 |
>240 |
>110 |
Particulate matter is released through the burning of fossil fuels, the setting off fireworks, automobile emissions, and many other activities. Other air pollution indicators, including VOCs, are increasing, which worsens the air quality together with different meteorological factors like weather, wind speed, rainfall, etc. As a result, when inhaled, it has negative health effects and reduces visibility, which increases the risk of traffic accidents.
Data Sources
We obtain the unprocessed PM 2.5 readings from two Delhi pollution data sources. The first is information obtained from the US Embassy located in New Delhi Chanakyapuri. The second data is collected from the Central Pollution Control Board (CPCB), which stores information for various Indian regions. As far as data obtained from CPCB they used to maintains multiple monitors in Delhi, we chose the four that gave us the most reliable dataset. Thus, we have information on three places: Residential areas in Delhi include
Anand Vihar
R K Puram
Rohini
For all the locations listed on the CPCB website, we additionally extract hourly data on wind, temperature, and relative humidity in addition to PM 2.5. We have selected the nominated name of the city, the desired time period, and the parameters for which data is needed from the drop boxes. For some of the sites, the information on the other factors is not accessible. We employ hourly data collected from the places between January 2020 and January 2023. It should be noted that some of the data’s values are missing. We don’t include these missing observations in our analysis.
Observation of the AQI Report 2022
An important Hindu religious holiday called Diwali is observed over a four- to five-day span. Lakshmi Puja is the name given to the festival’s primary day. Firecrackers are lit to commemorate this, and this usually starts at 6:00 p.m. Due to its reliance on the Hindu lunar calendar, Diwali does not always occur on the same day. It is therefore a movable date that spans several years. This year Diwali occurs on 24th October The below graph shows the PM level on Diwali night for three consecutive years.
Delhi PM levels during Diwali night for 2020, 2021, and 2022
 |
Figure 1: Delhi PM levels during Diwali night for 2020, 2021, and 2022 |
 |
Figure 2: Air Quality on and Before Diwali night. |
According to the graph, the worst PM levels occurred in 2021 (1 AM, 1016.163 g/m3), followed by Diwali in 2020, while the lowest emissions were recorded in 2022. On Diwali, the study point began at noon and continued till 12 PM the following day. PM emissions have significantly decreased this year. The levels were predicted to reach dangerous levels, but this year’s weather was better. The wind patterns and the warm weather are to blame for the higher PM levels. Since January 1, 2021, PM2.5 air pollution in New Delhi is thought to have killed 25,000 people. The WHO’s recommended limit for PM2.5 concentration is currently being exceeded by 2.7 times in New Delhi. So far this year, it has cost the city’s economy over US$3.7 billion. (Greenpeace source). Details of various parameters .
Status of Air Pollution In Delhi
The AQI (Air Quality Index) is a measure of the quality of the air in a specific location, and it takes into account several pollutants, such as particulate matter (PM), ozone (O3), nitrogen dioxide (NO2), sulfur dioxide (SO2), and carbon monoxide (CO). AQI can range from 0 to 500, with higher values indicating poorer air quality.
To develop a regression model for AQI, one needs to collect data on the different pollutants and their concentrations in the air. The data can be obtained from monitoring stations located across the area of interest. Once the data is collected, it can be analyzed to determine the relationship between the concentration of each pollutant and the AQI.
Regression analysis can be used to develop a mathematical model that predicts the AQI based on the concentration of the pollutants. The regression model can be developed using different techniques, such as linear regression, multiple linear regression, or non-linear regression. The choice of technique depends on the complexity of the data and the relationship between the variables. Once the regression model is developed, it can be used to predict the AQI for a given concentration of pollutants. This can be useful in several ways, such as air quality forecasting, pollution control, and health risk assessment. However, it is important to note that the accuracy of the model depends on the quality of the data and the assumptions made during the model development.
To develop the regression model and gather insights, the relevant data has been gathered from Central Pollution Control Board, Ministry of environment, Forests and Climate Change, Indian Government. The historical dataset has been extracted in the range of 10 days before Diwali and 5 days after Diwali across three prominent locations (Anand Vihar, R K Puram, Rohini) in the Delhi. The dataset focuses on key pollutants affecting the AQI:
PM2.5 (Particulate Matter 2.5): Fine particles that are 2.5 micrometers or smaller in size, which can be inhaled into the lungs and cause respiratory problems.
PM10 (Particulate Matter 10): Larger particles that are 10 micrometers or smaller in size, which can cause eye and respiratory irritation.
Ozone (O3): Ozone is a gas that is created when nitrogen oxides (NOx) and volatile organic compounds (VOCs) react with sunlight. It can cause respiratory problems and exacerbate existing conditions such as asthma.
Nitrogen Dioxide (NO2): NO2 is a gas that can come from car exhaust, power plants, and other industrial processes. It can cause respiratory problems, including coughing and wheezing.
Sulfur Dioxide (SO2): SO2 is a gas that is released when fossil fuels such as coal are burned. It can cause respiratory problems and can exacerbate existing conditions such as asthma.
NH3 or Ammonia: It is one of the key air pollutants that contribute to poor air quality index (AQI). It is mainly released from agricultural activities such as animal husbandry, fertilizers, and manure management. NH3 can cause respiratory problems and irritation in the eyes, nose, and throat. It can also lead to acidification of soil.
After successful collection of the data, data is cleaned and enriched for further analysis. Here are some steps that have been followed to clean data:
Fix missing values: Missing data can cause inaccuracies in the analysis. Used imputation method to fill in missing values.
Standardize data: Ensured the data consistency by standardizing the data format, units, and variables. This helps to avoid confusion during analysis.
Remove irrelevant data: Removed any irrelevant data that is not useful for analysis.
Outliers: Checked for any data points that are significantly different from the other values in the dataset. These outliers may be errors or may represent significant data points that need to be accounted for in the analysis.
Data integrity: Ensured that all data points are accurate and consistent with the study objectives.
Validate data: Checked that the data is consistent with the source and ensure that it has been accurately transcribed.
Post data has been cleaned; Power BI visualization tool has been used to gather insights of pollutants across three locations over the defined period. PowerBI is a business intelligence tool by Microsoft that allows users to visualize and analyze data from multiple sources. It offers a range of data visualization options, including charts, graphs, and maps. Using PowerBI, businesses can gain insights into their data by creating interactive dashboards and reports.
Below the insights derived from graphs developed in Power BI:
 |
Graph 1: Location: Anand Vihar. |
 |
Graph 2: R K Puram |
 |
Graph 3: Rohini |
Regression Model
A regression model has been developed using statistical tool (Python) to analyze the relationship between two or more variables. They aim to predict a dependent variable based on one or more independent variables. It is commonly used to analyze the relationship between variables and predict future outcomes. The regression model involves fitting a line or curve to the data, which can be either linear or non-linear. The line or curve that best fits the data is determined by minimizing the sum of the squared residuals between the observed and predicted values. Regression models are used in a wide variety of fields, including economics, finance, biology, psychology, and social sciences. They are also used in machine learning and artificial intelligence to predict outcomes and make decisions based on data. Developed regression model is used to analyze the relationship between AQI and other factors that affect air quality, such as PM 2.5, PM 10, NO2, NH3, SO2 and OZONE. The model would estimate the effect of these variables on AQI and provide a numerical value that indicates the expected AQI level for different combinations.
Here are the step-by-step instructions for performing linear regression in Python:
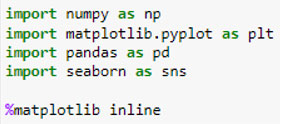
Step 1: Import the necessary libraries – To perform linear regression in Python, below libraries were imported.
Step 2: Load the data – pandas library to read data from the Excel file.

Step 3: Prepare the data – Once the data has been loaded, it is prepared for analysis. This involves cleaning the data and removing any outliers or missing values. The data is split into training and testing sets.

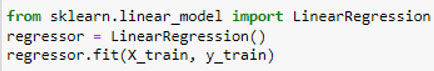
Step 4: Create the model – Created a Linear Regression model using LinearRegression class from the sklearn library.
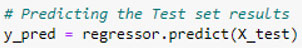
Step 5: Predict the values – Once model is created, it can be used to predict the values of the dependent variable.
Step 6: Evaluate & Fit the model – Fit the model and evaluate the performance based on the data.
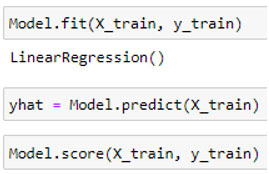
Step 7: Display the summary of the model.
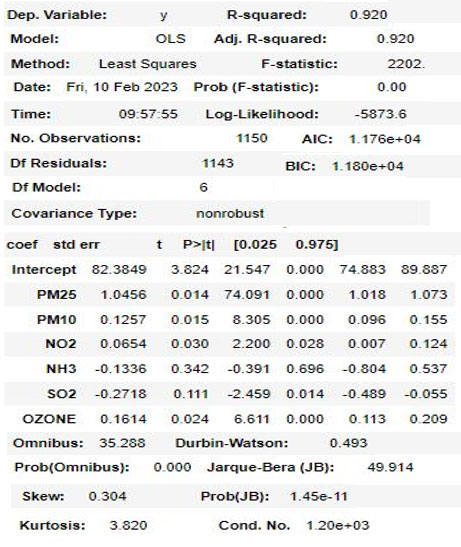
Step 8: Create the model based on the dataset
AQI = 1.0456 PM2.5 + 0.1257 PM10 + 0.0654 NO2 -0.1336 NH3 -0.2718 SO2 + 0.1614 OZONE +82.3849
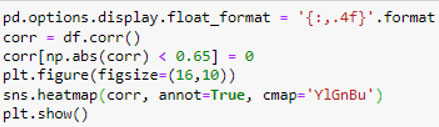
Correlation
In linear regression, the correlation between the independent and dependent variable is usually expressed as the correlation coefficient (r). A high correlation coefficient (i.e., closer to 1 or -1) indicates a strong relationship between the two variables, which makes linear regression a good model for predicting the dependent variable based on the independent variable. The goal of linear regression is to find the best-fit line that can predict the dependent variable based on the independent variable.
 |
Graph 4: Correlation |
Based on the correlation graph, it can be observed that the PM2.5 & PM10 pollutant values are closely related with the AQI values as compared to other pollutants.
We need to know which element has a strong link with PM2.5 in order to construct the regression calculation model concerning PM2.5 concentrations. As a result, correlation analyses between PM2.5 values and several other observational components must be performed. PM2.5 concentrations model given in this paper is successful, as evidenced by the model test results. It demonstrates that it is possible to determine PM2.5 concentrations using monitoring data for PM10, SO2, NO2, O3, CO, and temperature.
Remedial measures should be taken by Delhi Government and local people to improve the quality of air in Delhi . Air pollution is a serious problem in Delhi, and it has numerous harmful effects on the health and wellbeing of the local people. The Delhi government and local people need to take several remedial measures to improve the quality of air in Delhi. Here are some of the steps that can be taken:
Reduce vehicular emissions: The government can take several steps to reduce vehicular emissions. These include promoting public transportation, encouraging the use of bicycles, and implementing strict emission standards for vehicles.
Control industrial emissions: The government should enforce strict regulations on industries that contribute to air pollution. This can include monitoring emissions, enforcing penalties for non-compliance, and promoting the use of clean technologies.
Control burning of waste: Burning of waste contributes to air pollution. The government should strictly enforce laws against burning of waste and promote alternative waste disposal methods. Promote green spaces: Green spaces like parks and gardens can help in reducing air pollution. The government should promote the creation of more green spaces and encourage people to plant trees.
Encourage the use of clean energy: The government should promote the use of clean energy like solar power and wind power. It should also encourage people to switch to cleaner energy sources like electric vehicles.
Promote awareness: The government should promote awareness about the harmful effects of air pollution and the steps that can be taken to reduce it. This can include campaigns, workshops, and seminars.
Use air purifiers: The use of air purifiers can help in reducing indoor air pollution. People should be encouraged to use air purifiers in their homes and workplaces.
Wear masks: People should wear masks to protect themselves from outdoor air pollution. The government should promote the use of masks and provide them to people who cannot afford them.
Monitor air quality: The government should monitor air quality on a regular basis and make the data available to the public. This can help people take necessary precautions during periods of high air pollution.
In conclusion, the Delhi government and local people need to take several remedial measures to improve the quality of air in Delhi. These measures should focus on reducing vehicular emissions, controlling industrial emissions, promoting green spaces, encouraging the use of clean energy, promoting awareness, using air purifiers, wearing masks, and monitoring air quality.
Conclusion
In this study, we use the most recent two years’ worth of monitoring data from 3 air quality monitoring sites inDelhi, and we perform multiple double variant correlation analyses between PM2.5 concentrations and other monitoring elements. The results demonstrate that during this time, the concentrations of PM2.5 and PM10, SO2, NO2, O3, CO, and temperature typically have a clear linear relationship. A correlation exists between the production, formation, and changing processes of various pollutants, and these processes are all linked. As a result, we create a multiple linear regression computation model between temperature, SO2, NO2, O3, CO, PM2.5 and PM10 concentrations.
First, there is a significant positive correlation between PM2.5 and PM10, SO2, NO2, and CO, a significant negative correlation between PM2.5 and O3, and all of these variables can be utilised to develop a model for calculating PM2.5 concentration. According to the absolute values of correlation coefficients, PM10, CO, SO2, NO2, temperature, and O3 have the largest to smallest correlations with PM2.5
We tested the model’s dependability using pre-set 30-day monitoring data. The results demonstrate that the PM2.5 concentrations between the model’s calculation and the actual monitoring are largely consistent. The model’s imitative effect is also quite strong, demonstrating its potential for forecasting PM2.5 concentrations.
In order to estimate the results using the PM2.5 model described in this research, we lastly randomly selected three cities from various regions of Delhi. We then randomly collected 30 days’ worth of monitoring data on PM2.5 density and other relevant factors from each city.
References
- Dai Yongli, TaoJun, Lin Zejian, et al. China’s megacities haze weather characteristics and the influence factor analysis during 2006-2009. Journal of environmental science, 2013 (8): 2925-2932.
- Meng Xiaoyan, Rui-bin Wang, Zhang Xin, et al. The main pollutant concentration changes of key environmental protection cities during 2006-2010. Journal of environmental science research, 2012, 25 (6): 622-627.
- Hara K, Homma J, Tamura K, et al. decreasing trends of suspended particulate matter and PM2. 5 concentrations in Tokyo, 1990-2010. Journal of the Air & Waste Management Association, 2013, 63(6): 737- 748.
CrossRef - Bigi A, Ghermandi G. Long-term trend and variability of atmospheric PM10 concentration in the Po Valley. Atmospheric Chemistry and Physics, 2014, 14(10):4895-4907.
CrossRef - Anne Boynard, Cathy Clerbaux, Lieven Clarisse, et al. First simultaneous space measurements of atmospheric pollutants in the boundary layer from IASI: A case study in the North China Plain. Geophysical Research Letters, 2014, 41(2): 645-651.
CrossRef - Zhao X J, Zhao P S, Xu J, et al. Analysis of a winter regional haze event and its formation mechanism in the North China Plain. Atmospheric Chemistry and Physics, 2013, 13:5685- 5696.
CrossRef - Tao Jinhua, Zhang Mei-gen, Chen Liang-fu, etc. A new method of particle concentration near the ground based on satellite remote sensing AOT estimation. Chinese science (D), 2013 lancet (1): 143-154.
- Levy R C, Remer LA, Mattoo S, et al. Second-generation operational algorithm: Retrieval of aerosol properties over land from in-version of Moderate Resolution Imaging Spectro radiometer spectral reflectance. Journal of Geophysical Research, 2007, 112, D13211:1-21.
CrossRef - Zhang Ju, Miao Hong, Ouyang Zhi-yun, etc. The analysis of Beijing suburbs environment air quality change and its impact factor nearly 20 years. Journal of environmental science, 2006 (11): 1886-1892.
- Dr. Subhadra Rajpoot, Devang Pratap Singh, “Emerging Public Health Concern and Air Pollution: A Case Study of Delhi’s Air Pollution Governance”, International Journal for Modern Trends in Science and Technology, Vol. 06, Issue 05, May 2020, pp.: 196-201; https://doi.org/10.46501/IJMTST060530
CrossRef - Balachandran S, Meena BR, Khillare PS. Particle size distribution and its elemental composition in the ambient air of Delhi. Environ Int 2000;26:49-54.
CrossRef - Chhabra SK, Chhabra P, Rajpal S, Gupta RK. Ambient air pollution and chronic respiratory morbidity in Delhi. Arch Environ Health 2001;56:58-64.
CrossRef - Subhadra Rajpoot, “A Review on ways to Manage Biomedical Waste at Different Locations in Faizabad”, International Journal for Modern Trends in Science and Technology, Vol. 06, Issue 01, January 2020, pp.-33-36.
- Jayaraman G, Nidhi. Air pollution and associated respiratory morbidity in Delhi, Health Care Manag Sci 2008;11:132-8.
CrossRef - Dr. Subhadra Rajpoot and Kabom Lego, “Effect Of Particulate Matter (Pm) On Climate, Plants, Human Health And Ecosystem”, International Journal Of Scientific Research, Volume-7 | Issue-5 | May-2018 | Print Issn No 2277 – 8179

This work is licensed under a Creative Commons Attribution 4.0 International License.
About The Author
![]()
A New Edition of Web of Science
Journal Impact Factor
2022: 0.5
Five Year: 0.8
Journal is Indexed in

Cabells Whitelist
![]()


