Estimation of Minor and Trace Elements Concentration and Investigation of Chemical Composition of Kidney Stones in Kurdistan Region
Rebaz M. Mustafa1,5 , Bashdar I. Meenaa1*, Emad K. Mohammed1, Shalaw Z. Sdeeq3,6, Khabat N. Hussein2, Hiwa M. ahmed4 and Haval M. Abdullad3
1Department of Chemistry, Faculty of Science and Health, Koya University, Koya KOY45, Kurdistan Region - F.R. Iraq.
2Department of Animal production - College of Agricultural Engineering Sciences - University of Duhok.
3Department of Physics, Faculty of Science and Health, Koya University, Koya KOY45, Kurdistan Region - F.R. Iraq.
4Sulaimani Polytechnic University, Slemani 46001, Kurdistan Region/Iraq
5Volumetric Apparatus and Instrumental Analysis, Modern Surveying Calibration and Testing Labs, Erbil, Kurdistan, Iraq.
6Physics Education Department, Faculty of Education, Tishk International University, Erbil, Iraq.
Corresponding Author E-mail: bashdar.ismael@koyauniversity.org
DOI : http://dx.doi.org/10.13005/ojc/390224
Article Received on : 08 Feb 2023
Article Accepted on : 21 Mar 2023
Article Published : 04 Apr 2023
Reviewed by: Dr. Atul Gupta
Second Review by: Dr. Nahide Gulsah Deniz
Final Approval by: Dr. Ravi Manne
Investigations of the chemical composition of kidney stones are essential for understanding of the nature formation of stones and for the development of preventative treatment methods. Instrumental activation analysis radiations are significant tools for determining the composition of kidney stones. Kidney stones of varying compositions were investigated through the use of X-ray powder diffraction (XRD) and X-ray fluorescence (XRF) techniques. Materials can be observed in two very different ways due to the X-ray photon's unique interaction with matter. Using a combination of X-ray fluorescence and activation analysis, this method provides a thorough assessment phases of kindney stones which is containinig Weddelite, Whewellite, Uricite, Apatite and Struvite by using XRD method. The XRF, FTIR, and XRD methods were used to two groups of kidney stones. Based on the XRF analysis, the elements Ca, S, P, Si, and Cl were determined to have the highest concentrations. The heavy metals Cu, Fe, Zn, Ta, Sn, and Pb, were detected as trace elements. The purpose of this study was to use XRF, XRD, and FTIR instrumental activation analysis techniques to determine the chemical composition of kidney stones and phase of kidnes its quite important to development of preventative treatment methods.
KEYWORDS:Chemical composition; Concentration elements; Kidney stone; Trace elements; XRF
Download this article as:| Copy the following to cite this article: Mustafa R. M, Meenaa B. I, Hussein K. N, Mohammed E. K, Sdeeq S. Z, Ahmed H. M, Abdullad H. M. Estimation of Minor and Trace Elements Concentration and Investigation of Chemical Composition of Kidney Stones in Kurdistan Region. Orient J Chem 2023;39(2). |
| Copy the following to cite this URL: Mustafa R. M, Meenaa B. I, Hussein K. N, Mohammed E. K, Sdeeq S. Z, Ahmed H. M, Abdullad H. M. Estimation of Minor and Trace Elements Concentration and Investigation of Chemical Composition of Kidney Stones in Kurdistan Region. Orient J Chem 2023;39(2). Available from: https://bit.ly/3lYipS5 |
Introduction
A kidney stone, also known as nephrolithiasis or urolithiasis, is a crystal concretion that forms typically within the kidneys. It is a growing urological problem of human health that affects around 12% of the global population 1. It is believed that 1–15% of people may suffer from the production of kidney stones at some point in their lives, and it has been stated that the prevalence and incidence of kidney stones is rising significantly 2–4. It is considered that this developing tendency is related with shifts in lifestyle changes such as insufficient amounts of physical activity and changes in eating choices, as well as climate change 2,3. The lifetime prevalence of stone – forming exceeds 12% to 14% in men and 6% in women; the prevalence of United states is estimated to be between 10% and 15% of the population in the USA; there is a strong possibility of recurrence, with up to 50% of individuals experiencing a re – occurrence within 5 years; and there is a significant difference in the risk of developing USA between men and women 5. In the United States of America, kidney stones are more common in males than in women; however, it appears that the gender difference in the occurrence of kidney stones has been reducing over the past decade 6. Several etiological variables are related with KSD, including concomitant conditions like hypertension and diabetes mellitus (DM) and lifestyle habits including obesity and smoking 7. It has been proposed that kidney stones may represent a systemic condition associated with metabolic syndrome 8. Nephrolithiasis is related with an increased risk of chronic and end-stage kidney disease, most likely as a result of kidney damage caused by obstructed nephropathy. The production of urinary stones is the third most prevalent type of urinary tract disease, coming in third behind urinary tract infections and prostate issues 8,9.
The symptoms associated with kidney stones might vary depending on where the stones are located, including the urinary bladder, the ureter, or the kidneys themselves. In the absence of appropriate treatment, kidney stones may lead the ureter to get blocked, blood to appear in the urine, frequent urinary tract infections, vomiting, and painful urination, all of which can lead to permanent impairment to the kidneys’ functioning capabilities 10. Renal stone recurrence prevention is still a major public health issue. To reduce the probability of future stone formation, it is necessary to have a deeper comprehension of the processes that are involved in stone formation 11. It is crucial to look at the composition of kidney stones when trying to understand the etiology of stone – forming because this can provide clues about the environment in which the stone was made. The determination of the crystalline compositions of stones is not only necessary for determining the cause of recurrent stone disease but also for the establishment of the cause of the disease in the first place 12. Previous research has shown that geological factors, diet quality, and hydrological variables such as the hardness of the water all play a direct role in the production of kidney stones 13,14. The abnormalities in the urine composition of different substances can influence the composition of kidney stones and determine their content. Stones are distinct from one another in terms of their dimensions, shapes, and chemical compositions (mineralogy).
Urinary stones are regarded to be biominerals and can be categorized into a few different classes based on the mineralogical content of the stone. The most frequent kinds of kidney stones are made up of calcium oxalate, calcium phosphate, uric acid, and struvite 15. So, around 80% of stones are made of calcium oxalate (CaOx) and calcium phosphate (CaP); 10% of stones are made of struvite (magnesium ammonium phosphate produced during infection with bacteria that produce urease); 9% of stones are made of uric acid (UA); and the final 1% of stones are made of cystine or ammonium acid urate or are identified as drug-related stones 16. Calcium, which is a fundamental component of kidney stones, is capable of undergoing a potential combination reaction with oxalate and phosphate, and it is also able to precipitate white alkali and alkaline components when combined with calcium. Geography, climate, ethnicity, and social and environmental factors affect kidney stone incidence 14-16,17. Moreover, crystal nucleation, development, aggregation, and crystal retention within the renal tubules all contribute to the creation of kidney stones, which is a complex process involving a cascade of events 17. In this study used various techniques such as, X-ray fluorescence (XRF) is a powerful analytical instrument to estimate exact amount of heavy metals in kidney stones. X-ray diffraction (XRD) used for material investigation and interpretation and fourier transform infrared spectroscopy (FTIR) it is quite useful to identified chemical compositions. The main aim to used different techniques to estimated precisely concentration of heavy metals and chemical composition of kidney stone components.
Materials and Methods
Kidney stone samples has been collected from various locations in the Kurdistan region, namely, samples (1-5) collected from Rania, and samples (6-10) from Koya. The stones were washed cautiously with distilled deionised water. The concentration of elements were determined using energy-dispersive X-ray fluorescence (EDXRF). All measurements were carried out under vacuum; using a Rigaku NEX CG with RX9, Mo, Cu and Al targets.
X-ray diffraction, Rigaku with a Cu target was applied to the samples to identify the type of material as well as its phase and crystalline properties. The stones were powdered with pestle and mortar to produce a fine homogenous powder and 100 mg of this powder mixed with potassium bromide and the pellet was subjected to FTIR analysis. The FTIR spectroscopy was formed using Shimadzu 8700 FTIR Spectrophotometer in the frequency range 600-4000 cm-1.
Sample1(S1), Sample2 (S2), Sample3 (S3), Sample4 (S4), Sample5 (S5), Sample6 (S6), Sample7 (S7), Sample8 (S8), Sample 9 (S9), Sample10 (S10).
Results and Discussion
X-Ray fluoresce (XRF)
X-ray Fluorescence (XRF) is a useful tool for the qualitative and quantitative measuring of trace elements in the samples, its an interesting technic used in research, medical application and industry. X-ray Fluorescence Spectroscopy (XRF) processes the intensity of released X-ray from the sample in terms of wavelength or energy. The energies of intensity are distinguishing atoms of the sample.
In (Fig 1) shows the concentration of elements for instance, Ca, S, Si, P and Cl in the samples. The highest concentration of calcium in all samples, which indicates the existence of a high ratio of Calcium element in all samples and much higher than other elements in the samples, Also, the concentration of phosphor element (2660 ppm) has been observed in sample 3 is higher than other samples. The sulfur element can be observed in the second large ratio in the kidney stone samples, but S10 showed the highest concentration of 2000 ppm.
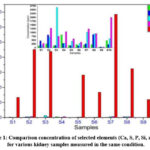 |
Figure 1: Comparison concentration of selected elements (Ca, S, P, Si, and Cl) for various kidney samples measured in the same condition. |
A sufficient amount of silicon has been observed (848-871 ppm) in both S2 and S8, which is higher than in the other samples. The highest concentration of chloride has been detected in S4 (855 ppm), almost three times higher than other samples. The peaks of different elements, for example, Al, K, Mg, Cr, Sr, and Cu in the samples can be detected in Fig 2. The Aluminum element was observed in a higher concentration in the S2 (792 ppm) compared with other samples. A larger amount of magnesium was perceived in the S3 and S7 samples (606 to 634 ppm) in comparison to other kidney stone samples. The concentration of potassium is range from (88 to 240 ppm) in the samples and copper (47.9 to 2.5 ppm).
 |
Figure 2: Comparison concentration of selected elements (Al, Mg, K, Cr, Sr and Cu) for various kidney samples measured in the same condition. |
The trace elements for instance, Cu, Zn, Fe, Ta, Sn and Pb in the samples can be observed in Fig 3. The highest trace element of copper was observed in S1 (47.9 ppm) which much higher compared to other samples. A large amount of iron has been detected (30.6 to 32 ppm) in both S2 and S10, which is higher than in other samples. The concentration of tin has been observed (17 to 20 ppm) in both S3 and S7.
Table 1. Listed all heavy metals and concentrations, which estimated in kidney stone.
|
S/E |
Cu |
Zn |
Fe |
Ta |
Sn |
Pb |
Cl |
Si |
P |
S |
Ca |
Al |
K |
Mg |
Cr |
Sr |
Cu |
|
S1 |
47.9 |
7.44 |
11.9 |
1.45 |
2.38 |
|
122 |
460 |
174 |
293 |
26700 |
303 |
110 |
245 |
86.2 |
4.63 |
47.9 |
|
S2 |
8.06 |
12.4 |
30.6 |
|
|
4.33 |
260 |
848 |
710 |
1290 |
90300 |
791 |
229 |
413 |
24.7 |
26 |
8.06 |
|
S3 |
3.26 |
18.5 |
22.8 |
2.88 |
17.2 |
|
141 |
157 |
2660 |
757 |
87800 |
373 |
197 |
606 |
2.97 |
17.9 |
3.26 |
|
S4 |
4.2 |
3.1 |
6.83 |
|
11.4 |
|
855 |
292 |
292 |
1060 |
117 |
151 |
159 |
|
|
|
4.2 |
|
S5 |
1.84 |
12.2 |
16.8 |
|
8.33 |
2.28 |
156 |
144 |
433 |
591 |
56400 |
225 |
139 |
198 |
1.44 |
7.86 |
1.84 |
|
S6 |
1.31 |
3.54 |
14.6 |
1.8 |
3.06 |
|
212 |
131 |
281 |
378 |
33500 |
102 |
84 |
|
1.41 |
4.61 |
1.31 |
|
S7 |
3.42 |
12.8 |
21.1 |
2.99 |
20.3 |
|
189 |
262 |
1030 |
1250 |
137000 |
423 |
252 |
634 |
|
59.3 |
3.42 |
|
S8 |
2.54 |
10.4 |
23.3 |
|
8.2 |
1.62 |
212 |
871 |
925 |
934 |
64800 |
581 |
207 |
514 |
6.69 |
15 |
2.54 |
|
S9 |
1.18 |
5.1 |
15.8 |
1.61 |
|
|
42.3 |
59.5 |
40.5 |
50.9 |
23800 |
105 |
88.3 |
|
1.2 |
2.72 |
1.18 |
|
S10 |
8.75 |
22.5 |
32 |
3.07 |
8.75 |
3.66 |
475 |
222 |
598 |
2000 |
103000 |
378 |
240 |
231 |
3.09 |
25.9 |
8.75 |
Calcium (Ca), Magnesium (Mg), Potassium (K), Aluminium (Al), Sulphur (S), Cupper (Cu), Zinc (Zn), Iron (Fe), Tin (Sn), Lead (Pb), Silicon (Si), Strontium (Sr), Chromium (Cr), phosphor (P), Chloride (Cl).
The smallest concentration of trace elements of Ta and lead were perceived in most of the samples. The chemical composition of the kidney stone samples based on XRF results was majority composed of calcium phosphate, uric acid, and struvite.
 |
Figure 3: Comparison concentration of selected elements (Cu, Fe, Zn, Ta, Sn, and Pb) for various kidney stone samples measured in the same condition. |
X-ray diffraction (XRD)
X-ray diffraction XRD is a powerful method used for material investigation and interpretation for example; inorganic minerals, pigments and ceramics. A non-destructive and versatile analytical technique can rapidly get elaborate phase information and the structure of materials. XRD patterns of materials in Figure 4A. Show almost the same characteristic diffraction peaks in the samples S1, S2, and S3, which indicate the same chemical composition. Samples in Figure 4B, S6, S7, and S8 display the same characteristic diffraction peaks, which means that, composed a similar chemical composition to kidney stones. The samples S4 and S9 appearance the same XRD patterns which show that they contain the same chemical composition, which is confirmed by the XRF technique.
 |
Figure 4: A. The X-ray diffraction patterns of kidney stone samples(1-4). |
 |
Figure 4: B. The X-ray diffraction patterns of kidney stone samples (6-9). |
Fourier Transform Infrared Spectroscopy (FTIR) analysis:
Examination of the elements in kidney stones using fourier transform infrared spectroscopy was completed for samples. FTIR spectrum in Figure 5A, shows the same characteristic spectrum peaks in the samples S2, S3 and S4, Absorptions at 1300 cm-1 and 1600 cm-1 could be a result of the vibration of C-O and C=O respectively, which indicates the same chemical composition. Samples in Figure 5B, S6, S7, and S8 display the same characteristic spectrum peaks, which indicate that the kidney stone is composed of similar chemical composition. The samples S4 and S9 appearance the same FTIR spectrum, the peak at 607 cm-1 may be attributable to the out-of-plane (OH) bending also the bands at 777 cm-1 are a result of C-H bending mode. It means that they formed similar chemical compositions.
 |
Figure 5: A. The FTIR spectrum analysis of the kidney stone samples(1-4). |
 |
Figure 5: B. The FTIR spectrum analysis of the kidney stone samples(5-10). |
Conclusions
The X-Ray fluorescence, FTIR and XRD were used for analysing and determining the chemical composition and two sets of samples were collected in different areas. The major elements concentration recognized by X-ray Fluorescence (XRF) method are Ca, S, P, Si, and Cl and the trace elements such as Cu, Fe, Zn, Ta, Sn, and Pb were detected by X-ray Fluorescence. This result helps in finding the precise chemical composition of kidney stones. Comparable results of various methods such as XRF, XRD, and FTIR to analysis’s sample, approach to discover all possible trace and minor elements indicated in the chemical compositions of the samples. Based on the majority of the results were composed of calcium phosphate, uric acid, and struvite. The investigation could be valuable information for recognizing various kidney stones by chemical composition. Surely, sources of kidney stones depend on the dietary habits and environmental location of the patients. Consequently, the existence of various chemical compositions in each sample corresponds to the same cause. This study could be helpful to researchers and physicians to investigate and develop a new medicine for kidney stone treatments and prevent to form it.
Acknowledgements
Acknowledgement special thanks go to Koya university staff for his continuous support and encouragement from the beginning of working on my article till the end.
Conflict of interest
The authors declare that we have no conflict of interest.
References
- Alelign, T.; Petros, B. Urology. 2018. 208-211.
CrossRef - Sofia, Hn.; Walter, T. M.; HSofia, N.; MWalter, T. Medical Science,2016, 5, 87-89.
- Romero, V.; Akpinar, H.; Assimos, D. G. Rev Urol 2010, 12 (2), 86–96.
- Wang, Z.; Zhang, Y.; Zhang, J.; Deng, Q.; Liang, H. Int J Mol Med 2021, 48, 149-154.
CrossRef - Abufaraj, M.; Xu, T.; Cao, C.; Waldhoer, T.; Seitz, C.; D’andrea, D.; Siyam, A.; Tarawneh, R.; Fajkovic, H.; Schernhammer, E.; Yang, L.; Shariat, S. F. Stone Disease Data. 2007.
- Gillams, K.; Juliebø-Jones, P.; Juliebø, S. Ø.; Somani, B. K. Current Urology Reports. 2021, 1, 33-35.
- Rahman, I. A.; Nusaly, I. F.; Syahrir, S.; Nusaly, H.; Mansyur, M. A. Research Ltd. 2021, 1–16.
- Siener, R. Nutrients. 2021, 13, 6-12
CrossRef - Khaleghi, F.; Rasekhi, R.; Mosaferi, M. Period. di Mineral. 2021, 90 (1), 105–119.
- Mikawlrawng, K.; Kumar, S, Int. J. Herb. Med 2014, 2 (1), 1–12.
- Khan, S. R.; Pearle, M. S.; Robertson, W. G.; Gambaro, G.; Canales, B. K.; Doizi, S.; Traxer, O.; Tiselius, H.-G. Kidney Stones. Nat Rev Dis Primers 2016, 2 (1), 16008-16011.
CrossRef - Khan, A. H.; Imran, S.; Talati, J.; Jafri, L. Investig Clin Urol 2018, 1, 59-63.
CrossRef - Giannossi, M. L.; Summa, V.; Mongelli, G. J Trace Elem Med Biol., 2013, 27 (2), 91–97.
CrossRef - Zarasvandi, A.; Heidari, M.; Sadeghi, M.; Mousapoor, Iran. J Geochem Explor 2013, 131, 52–58.
CrossRef - Blaschko, S. D.; Miller, J.; Chi, T.; Flechner, L.; Fakra, S.; Kahn, A.; Kapahi, P.; Stoller, M. L. Journal of Urology 2013, 189 (2), 726–734.
CrossRef - Han, G.; Tang, Y.; Liu, M.; van Zwieten, L.; Yang, X.; Yu, C.; Wang, H.; Song, Z. Agric Ecosyst Environ 2020, 301-307.
CrossRef - Sharma, S.; Raval, A. J.; Koneri, R.; Sharma, G. K. JDDT., 2022, 12 (2-S), 219–224.
CrossRef

This work is licensed under a Creative Commons Attribution 4.0 International License.
About The Author
![]()
A New Edition of Web of Science
Journal Impact Factor
2022: 0.5
Five Year: 0.8
Journal is Indexed in

Cabells Whitelist
![]()


