Phytochemical Analysis of Amorphophallus paeoniifolius (Dennst.) Nicolson and its Standardisation by HPLC and HPTLC
C. Bhuvaneswari1,2* and R. Sivasubramanian2
1Department of Nutrition and Dietetics, Dr. Kalaignar Government Arts College, Affiliated to Bharathidasan University, Kulithalai, Tamil Nadu – 639 120, India.
2Department of Biochemistry, Srimad Andavan Arts and Science College (Autonomous), Affiliated to Bharathidasan University, Tiruchirappalli, Tamil Nadu - 620 005, India.
Corresponding Author E-mail: biosiva2000@gmail.com
DOI : http://dx.doi.org/10.13005/ojc/390107
Article Received on : 13 Dec 2022
Article Accepted on : 24 Jan 2023
Article Published : 02 Feb 2023
Reviewed by: Dr. Tati Suhartati
Second Review by: Dr. Gurpinder Singh
Final Approval by: Dr.Prasong Srihanam
Elephant foot yams (Amorphophallus paeoniifolius (Denst.) Nicolson) are an important part of the diet in many parts of Asia. This study aims to analyse the physiochemical, phytochemicals, and in vitro antioxidant properties of different alcoholic and aqueous extracts. HPTLC and HPCL profile of ethanolic extract tubers of A. paeoniifolius was also investigated. Important secondary metabolites were detected through physicochemical analysis and phytochemical screening. In a laboratory, the antioxidant activity of A. paeoniifolius extracts was evaluated using standard free radical scavenging assays. HPLC testing showed that Gallic Acid, Quercetin, and Rutin could be used to standardise A. paeoniifolius. The study's results showed that it would give information that could be used to identify and verify this medicinal plant correctly and may help prevent its adulteration. The extracts of A. paeoniifolius have the potential to be a powerful antioxidant that can get rid of free radicals. The parameters for characterising A. paeoniifolius described in this paper could be used as a quality control standard for this plant.
KEYWORDS:Amorphophallus paeoniifolius (Dennst.) Nicolson; Elephant foot yams; HPTLC; HPLC; Secondary Metabolites
Download this article as:| Copy the following to cite this article: Bhuvaneswari C, Sivasubramanian R. Phytochemical Analysis of Amorphophallus paeoniifolius (Dennst.) Nicolson and its Standardisation by HPLC and HPTLC. Orient J Chem 2023;39(1). |
| Copy the following to cite this URL: Bhuvaneswari C, Sivasubramanian R. Phytochemical Analysis of Amorphophallus paeoniifolius (Dennst.) Nicolson and its Standardisation by HPLC and HPTLC. Orient J Chem 2023;39(1). Available from: https://bit.ly/3HRnGD5 |
Introduction
More than 75% of the world’s population uses traditional medicine for basic health problems1. More than 45,000 plant species are native to India, which is renowned for its ayurvedic medicine. Seven thousand five hundred of these are utilised in healing2. Ayurveda, a holistic science that emphasises fitness maintenance and disease treatment, is primarily concerned with the healing potential of plants. Ayurveda focuses on restoring balance by eliminating the root cause of disease with a mix of natural substances and preventing imbalance from happening again by encouraging a healthy lifestyle3. Ayurvedic texts like the Sarngadhara Samhita talk about how important it is to mix herbs in a certain way to reduce toxicity and make medicines work better4. According to the kwatha, vidhi of Samhita, kashayam or kwath is the filtered decoction made by boiling a mixture of herbs with 16 times their weight in water until an eighth of the volume is lost. It is both a drug precursor and a drug in its right5.
The increased demand for ayurvedic medicines results from their natural composition and lack of adverse side effects6. Due to the unavailability and high cost of original conventional pharmaceuticals, many people use cheap fillers and substitutes because traditional medicines are now for sale. To standardise and assess the quality of polyherbal formulations, it is necessary to test them following the most recent research guidelines7.
Integral to conventional medicine is the quality assurance that the correct dosage of a prescribed medication is administered8. Organoleptic and physical evaluations of drugs and comparing them to standard values can help prove that they are high-quality and not fake9. The ability of chromatographic fingerprinting to characterise the chemical composition of herbal medicine preparations makes it a suitable tool for evaluating consistency from batch to batch10. To evaluate and standardise the quality of plant extracts, physicochemical parameters, and phytochemical analysis, the HPTLC and HPLC fingerprint profile are used as indicators11.
Amorphophallus paeoniifolius (Dennst.) Nicolson, a member of the Araceae family, is a tuberous plant utilised in Ayurvedic and tribal medicine in India12. Due to their high nutritious content and wonderful flavour, tubers are often used as vegetables in savoury dishes. The plant’s tuberous roots have long been used to cure piles, gastrointestinal ailments, tumours, spleen enlargement, asthma, rheumatism, and other conditions because of their blood purifier effects. They have been used for centuries to treat a wide range of conditions, including pain and inflammation caused by arthritis or elephantiasis, tumours and inflammation, haemorrhoids and haemorrhages, vomiting, cough, bronchitis, asthma, anorexia, dyspepsia, flatulence, colic, constipation, helminthiasis, hepatopathy, splenopathy, amenorrhea, dysmenorrhea. There is evidence that the plant’s tuberous roots can be used as a tonic, stomachic, and appetiser13,14. Information is scarce regarding the scientific analysis of A. paeoniifolius. An attempt was made to characterise A. paeoniifolius to validate its quality and purity.
Experimental
Collection of Plant Materials
An Amorphophallus paeoniifolius (Dennst.) Nicolson tuber was gathered in the Tiruchirappalli District of Tamil Nadu, India. Dr. Arulanandam, director of the Rapinat Herbarium and centre for molecular systematics at St. Joseph’s college in Trichy, Tamil Nadu, India, confirmed the plant’s taxonomic identity. The voucher specimen was sent to the Rapinat Herbarium at St. Joseph’s College in Thiruchirappalli, Tamil Nadu, India.
Determination of foreign matter
After accurately weighing 250g of A. paeoniifolius tuber, we spread it out into a thin layer and used a magnifying glass to visually sort the foreign matter into groups. To remove any remaining dust, which was deemed to be a mineral admixture, the remaining sample was sieved through a size 250 mesh. The percentages of each category’s content were determined in terms of air-dried sample weight15.
Organoleptic Evaluation
Samples were judged on their organoleptic qualities using the Siddiqui et al. methodology. .’s The formulation’s organoleptic qualities (its appearance, smell, flavour, feel, etc.) are evaluated15.
Physiochemical Evaluation
The potency and safety of A. paeoniifolius tuber powder are assessed through physiochemical analyses. According to the Indian Pharmacopoeia, total ash, acid-insoluble ash, the percentage of moisture content (Loss of dry) and water-soluble ash were all determined using this metric. Experiments on a powdered tuber’s extractive potential used various solvents to prepare the extract. Powder and extracts with different solvents were also subjected to fluorescence analysis (Chloroform, Hexane, Ethanol, Ethyl acetate and Water)15.
Extract Preparation
After the plant’s tuber had been exposed to air and dried, it was mechanically ground into a powder. The powder was then subjected to successive extractions in a soxhlet apparatus using hexane, ethyl acetate, ethanol, and water. We used a hot air oven set to 40 degrees Celsius to dry the material before proceeding with the next solvent extraction. The liquid was then concentrated to a dry mass using a rotary evaporator after filtering through a Whatman No.1 paper filter. Three separate times at intervals, the extraction process was carried out. The percentage yield and content of Phyto-constituents thought to play an important role in biological activities were statistically indistinguishable. Each extract’s yield was calculated, and the resulting residues were placed in black glass tubes for later examination16. Different solvent extractions were given their abbreviations: ApHe (hexane extract), ApCh (chloroform extract), ApEa (ethyl acetate extract), ApEt (ethanol extract), and ApAq (water extract) (for water extract).
Preliminary Phytochemical screening
Secondary metabolites such as glycosides, saponins, alkaloids, phenolics, phytosterols, flavonoids, terpenoids, sugars, steroids, and quinines were analysed in the A. paeoniifolius tuber powder and extracted using different solvents (ApHe, ApCh, ApEa, ApEt, and ApAq). Lignin, starch, protein, and tannins are some examples of qualitative chemical tests17,18.
Determination of phytoconstituents
Estimation of Total Alkaloids19
0.1N HCl was used to treat a plant sample, and chloroform was used to separate the acidified water layer from the alcohol extract. The chloroform layer was thrown away, and the water layer was made alkaline with ammonium hydroxide and separated with chloroform in a separating funnel. To confirm the presence of alkaloids, we used dragendroff’s reagent after evaporating the Chloroform layer and discarding the aqueous layer.
The percentage of total alkaloids is found using the following formula:
Estimation of Total Flavonoids20
Extracting the plant’s aqueous extract required the use of ethyl acetate. After being dried over anhydrous sodium sulfate, the sections were filtered and concentrated under a vacuum to yield an extract with a concentration of 1g/ml. Experiments use a solution of 0.01g/ml obtained by further diluting them with ethyl acetate. Roughly 10ml of the solution was poured into a 25ml volumetric flask, and 1ml of 2% aluminium chloride was added. The answer was diluted with methanol-acetic acid to the correct volume and set aside for 30 minutes before the absorbance at 390 nm was taken. An absence of information was also preserved.
Estimation of Total Tannins 21
Follin-Denis analysis was used to compute the total tannin content of the plant material. Tannins can be estimated colourimetrically by measuring the intensity of the blue colour produced when a tannin-like compound is used to reduce phosphotungstomolybdic acid in an alkaline medium. Distilled water was added to 1ml of plant extract and a standard tannic acid solution (10-50µg/ml) to make a final volume of 7.5ml. Then, 1 ml of Na2CO3 solution and 0.5ml of Folin-Denis reagent were added. The final volume was adjusted to 10ml with distilled water, and the absorbance was measured at 700nm. The amount of tannic acid was stated in equivalent milligrams per gram of extract.
Estimation of Phenol22
A sample size between 0.5 and 1g was weighed and ground thoroughly with 80% ethanol, which was ten times the volume of the sample. Twenty minutes were spent centrifuging the homogenate at 10,000 rpm for 20 minutes. After collecting the supernatant, the residue was re-extracted using five times as much ethanol (at 80% concentration). The supernatant was centrifuged and collected. The liquid was then evaporated to dryness. 5ml of distilled water was used to dissolve the resulting residue. Pipettes were used to put different aliquots of 0.2 to 2.0 ml into test tubes. To get to the right amount, 3ml more water was needed. After 3 minutes, 0.5 ml of Folin’s reagent and 2 ml of a 20% sodium bicarbonate solution were added to each tube. After mixing the test tubes well, they were heated in a boiling water bath for one minute and then cooled. The colour that came out was measured at 650nm. Using a standard graphing method, the total amount of phenol was found.
Estimation of Ascorbic Acid23
The plant sample was weighed to a milligram and then ground with a mortar and pestle in 10ml of 4% oxalic acid before being centrifuged for 10 minutes. For this calculation, the supernatant was used. The pipette transferred 5 millilitres of the standard working solution to the conical flask holding 100ml. Then, titrate against a dye standard after adding 10ml of 4% oxalic acid (V1ml). The final stage is the introduction of a pink hue that lasts a couple of minutes. Consumption of the dye is proportional to intake of ascorbic acid. After removing 5ml of the supernatant with a pipette, 4ml of 4% oxalic acid was added and titrated against the dye (V2ml). In this case, the amount of ascorbic acid in the plant was reported in milligrams per one hundred grams of plant material.
In vitro Antioxidant Assay
Antioxidant screening and evaluation can be done in vitro and using various methods. However, due to oxidative processes, the total antioxidant activity of an antioxidant can’t be evaluated with just one or two methods. Therefore, this study measured total antioxidant activity in three different ways. The most common techniques are the ABTS free radical scavenging assay, the ferric-reducing power assay, and the DPPH free radical scavenging assay.
DPPH Radical Scavenging Assay24
DPPH was used to measure the aqueous extract of A. paeoniifolius for its capability to scavenge free radicals. A DPPH solution (0.04% W/V) comprised 95% methanol. Concentrations of 20 µg/ml to 100 µg/ml were achieved by serially diluting 0.2-1.0 ml of the stock solution in five test tubes. A spectrophotometer measured the absorbance at 517nm 10 minutes after mixing the test drug with a freshly made 0.5ml solution of DPPH. Ascorbic acid from vitamin C was used as a measure.
Calculation
The following equation was used to determine how much of the DPPH free radical was being taken.
With the IC50 value, the scavenging activity of the leaf extracts was compared to the gold standard. The extract concentration needed to stop 50% of DPPH radicals from forming was used to figure out the half-inhibitory concentration (IC50).
ABTS Radical Scavenging Assay25
The ABTS solution was made from scratch by mixing 5 ml of 14mM of ABTS with 5ml of a 4.9ml of potassium persulphate. The solution that resulted was stored for 16 hours at 25±1°C in the dark. This solution was diluted with methanol for the antioxidant assay to achieve an absorbance of 0.70±0.02 at 734nm. Standard and extract reaction mixtures were prepared using 950µl of ABTS solution and 50µl of the samples to make a total volume of 1 mL. Using a UV-visible spectrophotometer (Shimadzu UV-1800, Kyoto, Japan), the absorbance of this solution at 734nm was measured after 6m and compared to that of a control ABTS solution had been vortexed for 10s. A calibration curve was generated by comparing the inhibition percentage with increasing vitamin C concentrations (5-100 g ml-1). The following formula was used to determine the percentage of inhibition:
Percentage inhibition of vitamin C and extracts
Assuming that Ao is the reference absorbance and A1 is the sample absorbance. The data was reported as the amount of antioxidant capacity per gram of extract in milligrams of vitamin C (mg VCEAC).
Ferric Reducing Antioxidant Power (FRAP) Assay26
The FRAP test examined how plant extracts could eliminate ferric ions (Benzie and Strain, 1996). In a test called the ferric-reducing power assay, antioxidants in the sample would give up an electron to change Fe3+ to Fe2+ (FRAP). 90L of distilled water, 30L of the test sample, or 30L of methanol were added to 900L of FRAP reagent that had just been made and kept at 37°C (for the reagent blank). The samples and the blank reagent were put in a water bath for 30 minutes at 37°C. 1/34 of the test sample was left in the reaction mixture at the end. In 25ml, 20mM TPTZ in 40mM HCl, 20mM FeCl3. 6H2O and 25ml of 0.3M acetate buffer were mixed to make a FRAP reagent (pH-3.6). After incubation, the absorbance was measured with a spectrophotometer at 593 nm against a reagent blank. Known concentrations of Fe(II) in methanolic solutions from 100 to 200µM were used to make the calibration curve (FeSO4.7H2O). The equivalent parameter concentration was set as the antioxidant concentration that can reduce ferric-TPTZ by the same amount as one mM FeSO4.7H2O. The increase in absorbance seen in the FRAP assay due to the presence of antioxidants was calculated to equal the theoretical absorbance value of a 1mM concentration of Fe (II) solution. This value was used to figure out the equivalent concentration.
Chromatographic Conditions for High-Performance Thin Layer Chromatography
With the help of an HPTLC instrument, we could conduct an analysis (CAMAG, Switzer Land). The stationary phase was precoated with 0.2 mm thick silica gel 60 F254 TLC plates (E. Merck KGaA, Darmstadt, Germany). The CAMAG Nanomat 4 semiautomatic TLC sampler was used to apply 5 L of standard and sample solutions to the chromatographic plates. At room temperature, a solvent system consisting of chloroform, ethyl acetate, methanol, and formic acid (88:2:2:8 v/v/v/v) was used to conduct a linear ascending development in a saturated twin-chamber mode. Once the plate had dried at room temperature, it was scanned using densitometry. To scan the HPTLC plate, a wavelength of 254 nm was used. Densitometric scanning of the plate was performed using CAMAG TLC scanner 3. The CAMAG REPROSTAR3 software generated this Densitogram. Peak area was used alongside Linear regression for assessment27.
Chromatographic Conditions for High-Performance Liquid Chromatography
The high-performance liquid chromatography (HPLC) technique was carried out on a Shimadzu (Kyoto, Japan) Liquid chromatography system outfitted with a model LC-20 AD pump and UV-Vis SPD M-20A Diode detector. We successfully separated the components using a Shimadzu® Shimp-pack VP-ODS equipped with a C18 column with a 5 m particle size (4.6 x 250 mm). The mobile phase consisted of an isocratic mixture of methanol and water flowing at a rate of 1 ml per minute. Each day, the mobile phase was made, filtered through 0.22µm, and degassed before use. The column was pre-saturated with the first mobile phase for 30 minutes before the first injection. A steady 25°C was kept in the column. There was a total of 14 minutes of the operation time, 20 L of the sample was injected, and 254 nm was the wavelength detected by the UV-VIS detector. CLASS VP software was used to determine the compound’s exact concentration28.
Preparation of Standard Stock Solution of Gallic Acid
After dissolving 1mg/ml of standard gallic acid and 10mg/ml of sample in the mobile phase, a 20L injection was made while monitoring the elution at 254nm.
Preparation of Standard Stock Solution of Rutin
After dissolving 1mg/ml standard rutin and 10mg/ml sample in the mobile phase, an injection volume of 20L is made while monitoring the elution at 272nm.
Preparation of Standard Stock Solution of Quercetin
After dissolving 1mg/mL standard quercetin and 10mg/ml sample in the mobile phase, an injection volume of 20l is made while monitoring the elution at 272nm.
Preparation of Sample for HPTLC Analysis
After precise weighing, the A. paeoniifolius tuber chloroform: methanol extract (11.2 mg) was poured into a 10 ml volumetric flask. The volume was then adjusted by adding methanol, bringing the total concentration to 1120µg/ml. Diluting a 1 ml aliquot of the solution with methanol in a 10 ml volumetric flask yielded a final concentration of 112 µg /mL.
Preparation of Sample for HPLC Analysis
The dichloromethane extract of A. paeoniifolius stem bark was made by dissolving 10.4 mg of extract in 50 ml methanol to achieve a 208 g/ml concentration. Before injection, a final concentration of up to 50 g/ml was reached by dissolving 1 ml of the stock solution in 20 ml of the mobile phase.
Validation of Method
Following the guidelines established by the International Conference on Harmonisation (ICH, 1995),11, the technique was validated for Linearity, precision, accuracy, specificity, Limit of detection (LOD), and Limit of quantitation (LOQ).
Statistical Analysis
The values in this table are given as a mean and standard deviation. One-way analysis of variance (ANOVA) and Tukey’s test (P0.05) were used to determine the statistical significance.
Results and Discussion
Analyses of physiochemical, phytochemical, and in vitro antioxidant activity, as well as HPTLC and HPLC analysis, were performed on a sample of A. paeoniifolius leaves as part of the standardisation process.
Organoleptic Evaluation
Organoleptic research has shown that certain features, like a specific chemical taste that can make the tongue sensitive and various odours, can be used as diagnostic tools29. Based on analyses of organoleptic parameters, we know that A. paeoniifolius tubers have a brown powder with an aromatic odour and a bitter taste (Table 1).
Table 1: Organoleptic characteristics of A. paeoniifolius
|
S. No. |
Characteristics |
Observation |
|
1. |
Appearance |
Powder |
|
2. |
Colour |
Brown |
|
3. |
Odour |
Aromatic |
|
4. |
Taste |
Bitter |
Physiochemical Evaluation
Before our investigation can begin, all organisms and their byproducts must be eliminated, along with any mineral admixtures that aren’t already affixed to the medicinal plant materials (soil, stones, sand, dust, etc.)30. It may be challenging to evaluate medicinal plant materials because of foreign stuff throughout the study31. However, microscopy is crucial when dealing with powders. Table 2 showed a total foreign matter content of 2.41±0.65% w/w, indicating that it was theoretically possible to lack any detectable levels of foreign matter.
Table 2: Physiochemical Analysis of A. paeoniifolius
|
S. No. |
Particulars |
% (W/W) |
|
1. |
Foreign matter |
2.41±0.65 |
|
2. |
Moisture content |
1.89±.0.14 |
|
3. |
Total Ash |
5.75±0.83 |
|
4. |
Acid Insoluble Ash |
2.28±0.20 |
|
5. |
Water Soluble Ash |
7.24±0.52 |
Detecting impurities and incorrect drug administration require the determination of physiochemical parameters32. From Table 2, we can deduce that the overall percentage of ash was 5.75±0.83% (w/w). According to the findings, there was 7.24±0.52 (w/w) water-soluble ash and 2.28±0.20 (w/w) acid-insoluble ash. A powdered drug’s ash content is a reliable gauge of its quality and purity. The ash comprises inorganic radicals like carbonates, phosphates, silicates, and silica of sodium, potassium, magnesium, and calcium. Because they are soluble in HCl, inorganic factors, including calcium oxalate, silica, and carbonate content, might affect some crude medications’ “total ash” value. These factors are eliminated by treating the pharmaceuticals with acid, and the resultant “acid insoluble ash” value is then calculated33. The values provide a standard for evaluating illicit compounds and have a wide range. If you try to extract total ash with HCl, you will be left with insoluble ash as the residue. Ashes with an acid-insoluble value like this are likely contaminated with siliceous materials like dirt or sand, giving the sample an incorrect overall pH value of 34. Ash with a low acid insoluble content (2.28±0.20) contains less siliceous materials than the average, such as earth or sand. Whichever percentage of total ash content dissolves in water is called “water soluble ash.” It’s a red flag that the drug wasn’t properly prepared or its water-soluble salts weren’t properly extracted. Carbonates may be transformed into oxides33 at temperatures above 650 degrees Celsius, which could affect the accuracy of the total ash measurement. The ash value of a drug can be used to estimate the amount of inorganic material, earth, and other contaminants in it35. A. paeoniifolius leaves have a moisture content (Loss on drying) of 1.89±0.14% w/w (Table 2). Both water and volatile matter are subject to lose on drying. Hydrolysis will hasten the growth and decay of microorganisms in medicinal plant materials that contain too much water36. This is especially crucial for substances that quickly deteriorate when exposed to water or absorb large amounts of it. Less moisture in the air means less chance of mould, yeast, and bacteria developing.
The crude drug’s extractive value determines the drug’s quality and purity 37. The present study established Chloroform, Hexane, Ethanol, Ethyl acetate and Water of tubers of A. paeoniifolius values from extraction. Extremely more polar constituents than non-polar ones were found in A. paeoniifolius leaf extracts (Table 3). The extractive value of a medicinal plant is the number of active constituents that can be extracted from the plant using a solvent38. They can help assess the quality of raw drugs and provide insight into their chemical components’ composition. The yield of an extract of a drug in a given solvent is a rough indicator of the concentration of a given component or family of components in the drug33.
Table 3: Extractive Values of A. paeoniifolius
|
S. NO. |
Solvent Used |
% (w/w) |
|
1. |
Hexane |
1.74±0.31 |
|
2. |
Chloroform |
3.38±.38 |
|
3. |
Ethyl Acetate |
4.39±0.43 |
|
4. |
Ethanol |
7.95±0.85 |
|
5. |
Water |
22.71±1.50 |
The amount of a drug that dissolves in a given solvent can be used as a proxy for its purity. The extraction solvent should be strong enough to dissolve sufficient amounts of the target material. Extractive values39 are calculated using several different solvents due to the wide range in chemical nature and properties of drug contents. Standard values were determined by performing these experiments thrice. Water, ethyl acetate, chloroform, ethanol, and hexane all had higher extractive values, which suggests that chemical compounds in the plant had an effect.
Qualitative Phytochemical screening
Table 4 shows preliminary Phytochemical results that show whether or not the drug has certain phytochemicals40. Also, they had to harmonise the raw drugs because this is now a key part of identifying and proving the authenticity of drugs. Alkaloids, phenol, glycosides, flavonoids, steroids, starch, terpenoids, and protein were detected in A. paeoniifolius leaf powder. Extracts of A. paeoniifolius leaves showed the presence of phenol, alkaloids, and glycosides. All extracts besides hexane extract contain saponins, and all extracts besides methanol extract contain alkaloids. Both ethyl acetate, ethanol, and water extracts contained phenolics. Flavonoids are present in chloroform, ethanol, and water extracts. Extracts made with chloroform and ethanol yielded carbs. Extractions in hexane and water both contained glycosides. Gum and mucilage can be extracted from ethanol and water. In addition to chloroform, the extract also contained tannins and terpenoids. Extracts from any of the options do not contain any protein. The phytochemical study’s findings may one day lead to effective medicines for people suffering from various conditions. More research into the pharmacological effects of A. paeoniifolius leaf extracts is needed.
Table 4: Qualitative Phytochemical screening of A. paeoniifolius
|
S. NO. |
Phytochemicals |
Hexane extract |
Chloro form extract |
Ethyl |
Ethanol |
Water |
|
1. |
Alkaloids |
– |
+ |
+ |
+ |
+ |
|
2. |
Carbohydrates |
– |
+ |
– |
+ |
– |
|
3. |
Glycosides |
+ |
– |
– |
– |
+ |
|
4. |
Saponins |
+ |
+ |
+ |
+ |
+ |
|
5. |
Proteins |
– |
– |
– |
– |
– |
|
6. |
Phenolics |
– |
– |
+ |
+ |
+ |
|
7. |
Flavonoids |
– |
+ |
– |
+ |
+ |
|
8. |
Gum and Mucilages |
– |
– |
– |
+ |
+ |
|
9. |
Tannins |
– |
+ |
– |
– |
– |
|
10. |
Terpenoids |
– |
+ |
– |
– |
– |
+: Present; -: Absent
Quantitative Analysis of Secondary Metabolites
Plants’ secondary metabolites are crucial in determining the authenticity of illicit substances. Alkaloids, flavonoids, phenolic compounds, saponins, and Terpenoids are all therapeutically and industrially useful compounds that can be identified through phytochemical quantification. The results of the quantitative analysis of key organic components are recorded in Table 5. The alkaloids are larger plant secondary metabolites with various structural forms, biosynthetic routes, and pharmacological effects41. The results show that the alkaloid content of each solvent extract decreases from ethanol (7.60±0.52mg/g) to water (4.79±0.43mg/g) to ethyl acetate (4.69±0.69mg/g) to chloroform (1.45±0.20mg/g) to hexane (0.74±0.05mg/g). These data suggested that the ethanol extract contains a high concentration of alkaloids, suggesting that it may possess anticancer and free radical scavenging properties42. The flavonoid family is a class of polyphenolic molecules with well-established roles as antioxidants, anti-inflammatories, and inhibitors of hydrolytic and oxidative enzymes. Protecting against diseases related to oxidative damage to membranes, proteins, and DNA43 is made easier by flavonoids’ ability to superoxide anion radicals, scavenge hydroxyl radicals, and lipid peroxyl radicals, essential health-promoting roles in organisms are highlighted. Total flavonoid concentration is detected in ethanol extract. (18.03±0.81mg/g dry weight) followed by water extract (11.23±0.59mg/g), chloroform extract (3.27±0.20mg/g dry weight), ethyl acetate extract (2.63±0.24mg/g dry weight) and hexane extract (1.72±0.16mg/g dry weight).
Table 5: Quantitative Analysis of Secondary Metabolites of A. paeoniifolius
|
S. No |
Solvents |
Alkaloids |
Flavonoids |
Phenols |
Saponin |
Terpenoids |
|
1 |
Hexane |
0.74±0.05 |
1.72±0.16 |
2.44±0.36 |
0.19±0.04 |
0.29±0.05 |
|
2 |
Chloroform |
1.45±0.20 |
3.27±0.20 |
4.70±0.48 |
0.32±0.05 |
0.45±0.04 |
|
3 |
Ethyl acetate |
4.69±0.69 |
2.63±0.24 |
6.15±0.49 |
0.68±0.09 |
1.48±0.21 |
|
4 |
Ethanol |
7.60±0.52 |
18.03±0.81 |
25.85±2.34 |
3.85±0.41 |
2.68±.0.43 |
|
5 |
Water |
4.79±0.43 |
11.23±0.59 |
18.78±1.24 |
2.08±0.23 |
1.69±0.23 |
When protecting human cells from damage caused by free radicals, flavonoids are invaluable44. The major connection between a high dietary intake of flavonoids and reduced cardiovascular and carcinogenic risk45 is supported by numerous epidemiological studies. An increasing number of recent studies46 has questioned the widely held belief in flavonoids’ antioxidant and anticancer roles. Among the flavonoids tested, apigenin, luteolin, trans-chalcone, and 4-methoxychalcone exhibited the highest cytotoxicity without extensive DNA damage. However, genistein showed low cytotoxicity but induced high DNA damage47. Epidemiological research has shown that apigenin, epigallocatechin gallate, delphinidin, and genistein positively affect cancer development at different times48. According to previous reports, Flavonoids have been studied as chemopreventive agents in human cancer therapy49 due to their antioxidant, anti-inflammatory, and anticarcinogenic properties.
Phenols are a class of bioactive plant compounds that have been shown to have various biochemical activities, including antimutagenic, antioxidant, and anticarcinogenic properties and the capacity to alter gene expression50. To summarise, the total phenolic content of the ethanol extract is 25.85±2.34mg/g, while that of the water extract is only 18.78±1.24mg/g. Then, the dry weight concentrations of the extracts are as follows: 4.70±0.48mg/g for the chloroform extract, 2.44±0.36mg/g for the hexane extract, and 6.15±0.49mg/g for the ethyl acetate extract. Phenolics also can neutralise free radicals to act as antioxidants51. Researchers have found that phenolic compounds can significantly reduce the chance of getting cancer, heart disease, and diseases that come with getting older52.
To some extent, the antioxidant properties can be attributed to the abundance of phenolic compounds. Clinical research suggests that these beneficial components, saponins, affect the immune system in ways that protect the body from cancer and lower cholesterol levels53. Saponins are found to be most abundant in ethanol extract (3.85±0.41mg/g), followed by water extract (2.08±0.23mg/g), ethyl acetate extract (0.68±0.09mg/g), chloroform extract (0.32±0.05mg/g), and hexane extract (0.19±0.04 mg/g). Saponins reduce lipids in the blood, the risk of cancer and the body’s response to insulin. A diet high in saponin can stop tooth decay and platelet clumping, treat hypercalciuria in people and cure acute lead poisoning54.
Terpenoids, a class of important secondary plant metabolites with many structures, are the most common chemicals in natural products. Terpenoids are crucial to a plant’s development, environmental responses, and biological processes55. Terpenoids were widely used in the pharmaceutical, nutritional, and cosmetic industries as foundational components. Terpenoids can be found in the highest concentration in the ethanol extract (2.68±0.43mg/g dry weight), followed by the water extract (1.69±0.23mg/g), the ethyl acetate extract (1.480.21mg/g dry weight), the chloroform extract (0.45±0.04mg/g dry weight), and the hexane extract (0.29±0.05mg/g dry weight). Terpenoids improve transdermal absorption, treat and prevent cardiovascular disorders, and have hypoglycemic activity55. They also have anticancer, anti-inflammatory, antibacterial, antiviral, and antimalarial properties. According to previous studies, terpenoids have shown to be effective in various contexts, including insecticide resistance, immunoregulation, antioxidation, antiaging, and neuroprotection. Terpenoids’ complex structure, broad scope, and varied action mechanisms make them a fascinating class of compounds.
Analysis of In vitro antioxidant activity
DPPH free radical scavenging
A plant’s ability to scavenge DPPH radicals is commonly used as a measure of its antioxidant power56. Antioxidant studies in vitro on A. paeoniifolius showed that concentrations of 32.5, 62.5, 125, 250, and 500 g/ml of the extract were effective at scavenging DPPH radicals. The ascorbic acid reference standard was used to determine this. In the DPPH assay57, the antioxidants could change the stable radical DPPH into the brightly coloured diphenyl-picrylhydrazine. Because reaction58 makes the non-radical form DPPH-H, the method is based on reducing an alcoholic DPPH solution in the presence of an antioxidant that gives up hydrogen. Extracts of A. paeoniifolius have a scavenging ability that is both concentration and time-dependent (as shown in Fig. 1). This ability allows for an increase in inhibition of DPPH radical concentration. Alcohol extract of A. paeoniifolius (402.01 4.32%) had a greater scavenging effect than water (310.42±5.72%), ethylacetate (253.83±7.2%), chloroform (225.05±5.67%), hexane (153.19±2.33%), and ascorbic acid(295.35±0.36%). Based on the findings, ethanol extract from the plant leaves may have the highest free radical scavenging activity against DPPH. The data shows that the A. paeoniifolius ethanol extracts with the highest total phenolic contents also exhibited the highest radical scavenging activities. This may be due to the intrinsic nature of phenolic compounds, which aids in their ability to transfer electrons or donate hydrogen. The polarity of a compound and the rate at which it reveals its antioxidant potential are strongly correlated, and this correlation appears to be independent of the solvent used,59 as previously reported.
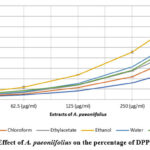 |
Figure 1: Effect of A. paeoniifolius on the percentage of DPPH activity |
ABTS free radical scavenging
Based on how well ABTS (2,2′-azinobis-3-ethyl benzothiazoline-6-sulfonic acid) radicals get rid of light, the extract did a good job of doing this60. Based on Fig. 2, the ethanol extract had the most activity (216.8±83.12%), followed by the water extract (163.97±2.74%), the ethyl acetate extract (156.66±3.48%), the chloroform extract (140.77±0.81%), and the hexane extract (95.75±1.82%). Ascorbic acid is used as a control and has an activity of 221.85±0.36%. So, the ability of ethanol extract of A. paeoniifolius leaves to get rid of ABTS radicals shows that it can get rid of free radicals by oxidising lipids through a chain-breaking reaction.
 |
Figure 2: Effect of A. paeoniifolius extracts on the percentage of ABTS activity. |
FRAP Activity
When the concentration of different extracts went up, the absorbance increased, which showed that the ability to reduce went up. In vitro, antioxidant studies of five extracts of A. paeoniifolius showed how much FRAP activity there was at different concentrations of A. paeoniifolius (32.5, 62.5, 125, 250, and 500 g/ml). Based on Fig. 3, the FRAP of the ethanol extract at the highest concentration (500g/ml) was found to be 282.12±5.94%, followed by the water extract (222.11±2.67%), ethylacetate (207.79±3.89%), chloroform (159.13±1.15%), and hexane extract (140.65±1.25%). Ascorbic acid, used as a control, was found to have 290.51±1.68% activity. The ferric-reducing assay showed that water extract had more power to get rid of iron than any other extract61. This shows that Fe3+ is always being turned into Fe2+, which shows the plant’s ability to reduce62. It looks like the aqueous leaf extract of A. paeoniifolius has more FRAP activity, which could be because it has a lot of phenolics and flavonoids.
FRAP activity was more related to the total amount of phenols and flavonoids56. Our results show that flavonoids and phenolics are very important as antioxidants in the ethanol leaf extract of A. paeoniifolius and make a big difference in the total antioxidant capacity. But all of the solvent extracts of the leaf of A. paeoniifolius were much better at lowering the power than ascorbic acid, which is made in a lab. This could be because bioactive parts (especially phenols and flavonoids) are more concentrated in water than in any other extract63. Similar to this study, A. paeoniifolius extracts made with ethanol showed better results than extracts made with other alcoholic solvents.
 |
Figure 3: Effect of A. paeoniifolius extracts on the percentage of FRAP activity |
HPTLC fingerprint analysis
The necessary resolution of Gallic Acid, Quercetin, and Rutin with reproducible peaks was achieved by employing Toluene: Ethyl acetate: Formic acid (5:4:1) as the mobile phase for the separation of ethanolic tuber extract of A. paeoniifolius (ApEt) by HPTLC, with 5.0 l and 5l volumes of ApEt. The regression results show a strong linear relationship in the range of concentrations from 2 to 20 l/spot. A strong correlation coefficient value and an SD of less than 5%64 for the intercept value show that calibration graphs are straight and that the system follows Beer’s law. There is no substantial difference between the slopes of standard curves. To determine the peak purity of ApEt, we compared the reflectance spectra of ethanol extract with the standard, as depicted in Figs. 4 through 6. The acquired TLC plate was seen in CAMAG Visualizer, and Fig. 7 depicts the numerous vivid colour spots found at 254 nm. At 5l applied volume, the Rf values of the test sample obtained from the chromatogram correlated well with those of the reference standards quercetin and rutin in the peak display. Even though high-performance thin layer chromatography (HPTLC) has some drawbacks, such as a shorter developing distance and lower plate efficiency than HPLC, it is still a useful tool for judging the quality of medicinal plants because it is easy to use, cheap, and has few requirements. It has been used well to make the chromatographic fingerprint for medicinal plants65. Furthermore, the flaws above can be eliminated by generating fractions of differing polarity on two or more thin layer plates. The proposed HPTLC approach for the simultaneous measurement of quercetin and rutin in ApEt is relatively straightforward, sensitive, cost-effective, and ideal for rapid routine quality control analysis66.
 |
Figure 4: HPTLC Fingerprinting Profile of ApEt Photo Documentation Under UV at 254nm |
 |
Figure 5: Chromatogram Image for ApEt |
 |
Figure 6: Chromatogram Image for Standards |
 |
Figure 7: 3D Display of Standard and Test |
HPLC analysis
Figures 8 and 9 depict the HPLC chromatograms, which depict a good separation of the peaks for all the analytes tested. The presence of the selected compound’s quercetin and rutin in ApEt was determined by its retention time (Rt), comparable to the standard, as measured by HPLC. As seen in the HPLC chromatogram, the interference of peaks demonstrates the increased sensitivity of the improved method67.
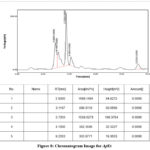 |
Figure 8: Chromatogram Image for ApEt |
 |
Figure 9: Chromatogram Image for Standards |
Conclusion
Numerous phytoconstituents with various pharmacological effects are abundant in plants. These types of plants are essential for medical purposes. Before employing the plant in research or to create medicines, pharmacognostic research must be conducted. It also helps distinguish it from other similar species and fakes. Amorphophallus paeoniifolius (Denst.) Nicolson has been used for centuries in traditional medicine. This study’s findings reveal the assessment of physicochemical characteristics such as loss on drying at 105°C, water-soluble extract, alcohol-soluble extract, and total ash. Excellent was the ethanolic extract’s strong hot and cold extractive values. The physiochemical analyses demonstrated that the leaves varied from other members of the same family. The initial phytochemical examination revealed that the ethanolic extract contained a greater concentration of Alkaloids, Carbohydrates, Glycosides, Saponins, Proteins, Phenolics, Flavonoids, Gum, and Mucilages than the other solvent extract. The quantitative study demonstrated that the ethanolic extract was rich in phenols, flavonoids, and tannins. This made it more probable that the ethanolic extract would be chosen as the primary extract. The fraction contains Rutin, Gallic acid, and Quercitin, as determined by HPTLC and HPLC analysis. Periodic testing is essential for ensuring the safety and efficacy of herbal medications. This research on the plant’s quality shows promise for facilitating its recognition and standardisation for use in the nutraceutical or herbal formulation industries, where strict quality control of raw materials is essential.
Acknowledgement
The authors thank PG and Research Department of Biochemistry, Srimad Andavan Arts and Science College (Autonomous), Tiruchirappalli – 620 005, Tamilnadu, for providing facilities for carried out this work.
Conflict of Interest
We declare that we have no conflict of interest.
References
- Nwosu I.A.; Ekpechu, V.C.; Njemanze, B.; Popoola, K. Ololo,. Stud. Ethno-Medicine., 2019, 13, 27.
- Prasathkumar M.; Anisha S. C.; Dhrisya, R.; Becky, S. Sadhasivam, Phytomedicine Plus., 2021, 1, 100029.
CrossRef - Vaamonde, D.; Hernandez, P.; Bonnifield, E.; Rosenthal, L. Pregnancy, Wellness, Elsevier, 2022, 415.
CrossRef - Sen, S.; Chakraborty, R. J. Tradit. Complement. Med., 2017, 7, 234.
- Abraham, A.; Samuel, S.; Mathew, L. J. Ayurveda Integr. Med., 2020, 11, 153.
CrossRef - Saggar, S.; Mir, P.A.; Kumar, N.; Chawla, A.; Uppal, J.; Kaur, A. others, Pharmacognosy Res., 2022, 14.
CrossRef - Gupta, M.K.; Khade, M.A.; Srivastava, B.; Hyam, S.R.; Gurav, P.B. Pharmacognosy Res., 2022, 14.
CrossRef - Ozioma, E.-O.J.; Chinwe, O.A.N. Herb. Med., 2019, 10 , 191.
- Liu, C.; Zuo, Z.; Xu, F. ; Wang, Y.; Crit. Rev. Anal. Chem., 2021, 1.
- Zhu, H.; Qiu, Y.; Gong, D.; Wang, J.; Sun, G. J. Pharm. Biomed. Anal., 2021, 196 , 113910.
CrossRef - Mian, S.S.; Upadhayay, S.; Naqvi, S.N.; others. Pharm. Methods., 2019, 10.
CrossRef - Wahidah, B.F.; Afiati, N. ; Jumari, J. Biodiversitas J. Biol. Divers., 2021, 22.
CrossRef - Kumar, S.S.; Rabindranath, P.; Ranjan, P.M.; Mohan, B.L. “Glob. J. Med. Plant Res., 2012, 1, 670.
- Misra, R.S; and Sriram, S. Crop improvement, production technology, trade and commerce, 2002, 373.
- WH Organization, others, World Health Organization, 2011.
- Abubakar, A.R.; Haque, M. J. Pharm. & Bioallied Sci., 2020, 12, 1.
CrossRef - Shaikh, J.R.; Patil M.K., Int. J. Chem. Stud., 8, 2020, 603.
CrossRef - Anzina, K.M.; Gudzenko, A. V ., K.O. Kalko, 2021.
- Shankaran, K.S.; Ganai, S.A.; KP A.; Mahadevan V. J. Biomol. Struct. Dyn., 2017, 35, 765.
CrossRef - Kadifkova Panovska, T.; Kulevanova, S.; Stefova, M. Acta Pharm., 2005, 55, 207.
- Polshettiwar, S.A.; Ganjiwale, R.O.; Wadher, S.J.; Yeole, P.G. Indian J. Pharm. Sci., 2007, 69, 574.
CrossRef - Kumar, P.P.; Kumaravel, S.; Lalitha, Cjaj.; others, African J. Biochem. Res., 2010, 4, 191.
- Sadasivam, S.; Manickam, A. Biochemical method, new age international (P) limited publishers, New Delhi. 1996, 11–12.
- Gyamfi, M.A.; Aniya, Y. Biochem. Pharmacol., 2002, 63, 1725.
CrossRef - Re, R.; Pellegrini, N.; Proteggente, A.; Pannala, A.; Yang, M.; Rice-Evans C. Free Radic. Biol. Med., 1999, 26, 1231.
CrossRef - Pulido, R.; Bravo, L.; Saura-Calixto, F. J. Agric. Food Chem., 2000, 48, 3396.
CrossRef - Sonia, K.; Lakshmi, K.S.; others, J. Pharm. Sci. Res., 2017, 9, 652.
- Susanti, M.; Ibrahim, S.; Harahap, Y.; others, Pharmacogn. J., 2018, 10.
CrossRef - Yessimbekov, Z.; Dey, T. Medbiotech J., 2021, 5, 31.
- Kumar, N.; Mani, M. J. Posit. Sch. Psychol., 2022, 2236.
- Barke, S.A.; Wayal, S.R.; Abhyankar, M.M.; Patil, R.Y. J. Pharmacogn. Phytochem., 2018, 7, 2499.
- Paczkowska, M.; Mizera, M.; Sałat, K.; Furgała, A.; Popik, P.; Knapik-Kowalczuk, J.; Krause, A.; Szymanowska-Powałowska, D.; Fojud, M. Z.; Kozak, others, Sci. Rep., 2018, 8, 1.
CrossRef - Sampathkumar, Y.; Mahadevan, S.G.; Jayaraman, R. Research J, Pharm. Tech., 2020, 13, 2091.
CrossRef - Arthur, W.; Ofori, J.; Addo, P.; Amey, N.; Kortei, N.K.; Akonor, P.T. Int. J. Food Sci., 2020, 2020.
CrossRef - Upadhyay, P.; Joshi, B.C.; Sundriyal, A.; Mukhija, others, J. Nat. Sci. Med., 2019, 2, 135.
- Ali, Z.; Alhaddad, E.; Roustom, R. Bull. Pharm. Sci. Assiut., 2022, 45, 233.
CrossRef - Tabasum, S.; Khare, S.; Jain, K. Indian J. Pharm. Sci., 2018, 80, 541.
CrossRef - Sridhar, A.; Ponnuchamy, M.; Kumar, P.S.; Kapoor, A.; Vo, D.-V.N.; Prabhakar, S. Environ. Chem. Lett., 2021, 19, 3409.
CrossRef - Bouasla, I.; Hamel, T.; Barour, C.; Bouasla, A.; Hachouf, M.; Bouguerra, O.M.; Messarah, M. Eur. J. Integr. Med., 2021, 42, 101267.
CrossRef - Jain, C.; Khatana, S.; Vijayvergia, R. Int. J. Pharm. Sci. Res., 2019, 10, 494-498.
- Velu, G.; Palanichamy, V.; Rajan, A.P. Nat. Food An Overv., Springer,. 2018, 135.
CrossRef - Diniso, T.; Adeyemi, J.; Oriola, A.; Elufioye, T.; Gondwe, M.; Oyedeji, A. Plants., 2022, 11, 2066.
CrossRef - Michalak, M. Int. J. Mol. Sci. 2022, 23, 585.
CrossRef - Mondal, S.; Rahaman, S. T. Pharm. Pharmacol. Int. J., 2020, 8, 91.
CrossRef - Mendonça, R.D.; Carvalho, N.C.; Martin-Moreno, J.M.; Pimenta, A.M.; Lopes, A.C.S.; Gea, A.; Martinez-Gonzalez, M.A.; Bes-Rastrollo, M. Nutr. Metab. Cardiovasc. Dis., 2019, 29, 69.
CrossRef - Elnour, A.A.M.; Mirghani, M.E.S.; Musa, K.H.; Kabbashi, N.A.; Alam, M.Z.; Heal. Sci. J., 2018, 12, 596.
- Constantinescu, T.; Lungu, C.N.; Int. J. Mol. Sci., 2021, 22, 11306.
CrossRef - Afshari, K.; Haddadi, N.S.; Haj-Mirzaian, A.; Farzaei, M.H.; Rohani, M.M.; Akramian, F.; Naseri, R.; Sureda, A.; Ghanaatian, N.; Abdolghaffari, A.H. J. Cell. Physiol., 2019, 234, 21519.
CrossRef - Batiha, G.E.S.; Beshbishy, A.M.; Ikram, M.; Mulla, ZS; El-Hack, M.E.A.; Taha, A.E.; Algammal, A.M.; Elewa, Y.H.A. Foods., 2020, 9, 374.
CrossRef - Kumar, N.; Goel, N. Biotechnol. Reports., 2019, 24, e00370.
CrossRef - Phuyal, N.; Jha, P.K.; Raturi, P.P.; Rajbhandary, S. Sci. World J., 2020, 2020.
CrossRef - Börzsei, D.; Sebestyén, J.; Szabó, R.; Lesi, Z.N.; Pálszabó, A.; Pálszabó, P.; Szász, A.; Priksz, D.; Juhász, B.; Veszelka, M.; others, Oxid. Med. Cell. Longev., 2022, 2022.
CrossRef - Priya, K.; Sharma, H.P.; Int. J. All Res. Educ. Sci. Methods., 2021, 9, 1156-1160.
- Kareem, O.; Ali, T.; Dar, L.A.; Mir, S.A.;. Rashid, R; Nazli, N.; Gulzar, T.; Bader, G.N. Edible Plants Heal. Dis., 2022, 279.
CrossRef - Yang, W. ; Chen, X.; Li, Y.; Guo, S.; Wang, Z.; Yu, X. Nat. Prod. Commun., 2020, 15, 1934578X20903555.
- Ng, ZX; Samsuri, S.N.; Yong, P.H. J. Food Process. Preserv.. 2020, 44, e14680.
CrossRef - Singh, J.; Sirdesai, A.; Bandyopadhyay, P. 2022.
- Yadav, S.C.; Govindasamy, J.; Ramnani, R. Int. J. Ayurveda Pharma Res., 1 2020.
- Johnson, J.B.; Mani, J.S.; Broszczak, D.; Prasad, S.S.; Ekanayake, C.P.; Strappe, P.; Valeris, P.; Naiker, M. Phyther. Res., 2021, 35, 3484.
CrossRef - Ramadhania, N.R.; Harun, F.; Purnomo, A.S.; Fatmawati, S. Mal. J. Fund. Appl. Sci., 2019, 15, 194.
CrossRef - Janarny, G.; Ranaweera, K.; Gunathilake, K. Biocatal. Agric. Biotechnol., 2021, 35, 102081.
CrossRef - Shelembe, B.; Mahlangeni, N.; Moodley, R. J. Anal. Sci. Technol., 2022, 13, 1.
CrossRef - Bodoira, R.; Maestri, D. J. Agric. Food Chem., 2020, 68, 927.
CrossRef - Patil, K.S.; Chougale, R.D.; Hajare, A.A. Res. J. Pharm. Technol., 2022, 15, 4248.
CrossRef - Roy, S.; Acharya, R.; Shukla, V.J.; Ranade, A. Pharmacognosy Res., 2020, 12.
- Biswas, S.; Harwansh, R.K.; Kar, A.; Mukherjee, P.K.; JPC-Journal Planar Chromatogr. TLC., 2019, 32, 121.
CrossRef - AlFaris, N.A.; Wabaidur, S.M.; Alothman, Z.A.; Altamimi, J.Z.; T.S. Aldayel, J. Sep. Sci., 2020, 43, 2079.
CrossRef

This work is licensed under a Creative Commons Attribution 4.0 International License.
About The Author
![]()
A New Edition of Web of Science
Journal Impact Factor
2022: 0.5
Five Year: 0.8
Journal is Indexed in

Cabells Whitelist
![]()


