Artificial Neural Network Prediction of Optimal Phenylic Acid Adsorption using Lantana camara Activated Carbon
V. Senthilkumar1 and K. K. Ilavenil2*
1Department of Mechanical Engineering, SRM TRP Engineering College, Irungalur (PO), Tiruchirappalli – 621 105, Tamilnadu, India.
2Department of Chemistry, Nehru Memorial College (Autonomous), Puthanampatti, / Affiliated to Bharathidasan University, Tiruchirappalli-621 007, Tamilnadu, India.
Corresponding Author E-mail: ilavenil@nmc.ac.in
DOI : http://dx.doi.org/10.13005/ojc/390121
Article Received on : 19 Dec 2022
Article Accepted on : 25 Jan 2023
Article Published : 02 Feb 2023
Reviewed by: Dr. Fatima AL-Qadri
Second Review by: Dr. Chinthayyanaidu Rudram
Final Approval by: Dr. Naeem Uddin
This paper exemplifies the application of artificial neural network (ANN) for prediction of performances in adsorption of phenylic acid from waste water by conventional and low cost Lantana camara activated carbon as adsorbent material. To estimate the removal efficiencies of phenylic acid, a three-layer feed-forward neural network using a back propagation algorithm was utilised in the MATLAB environment. The initial concentrations (mg/L) of phenylic acid, amount (g/L) of adsorbent and pH are the input parameters utilised to train the neural network. The output of the neural network was taken to be the effectiveness of phenylic acid removal. Statistical measures like root mean square error and linear regression were also used to evaluate the effectiveness of the proposed ANN models. Based on the comparison of the removal efficiencies of contaminants using ANN models and empirical results, ANN modelling for the adsorption of phenolic compounds was found to be reasonably consistent with the empirical results.
KEYWORDS:Adsorbent; Artificial neural network; feed forward neural network; Lantana camara; Phenylic acid
Download this article as:| Copy the following to cite this article: Senthilkumar V, Ilavenil K. K. Artificial Neural Network Prediction of Optimal Phenylic Acid Adsorption using Lantana camara Activated Carbon. Orient J Chem 2023;39(1). |
| Copy the following to cite this URL: Senthilkumar V, Ilavenil K. K. Artificial Neural Network Prediction of Optimal Phenylic Acid Adsorption using Lantana camara Activated Carbon. Orient J Chem 2023;39(1). Available from: https://bit.ly/3YcGyla |
Introduction
The growth in industrial activity is polluting the water supplies. The chemical industry discharges wastewater that contains a variety of contaminants1. One significant pollutant that has been introduced into water supplies is phenylic acid. Phenylic acid is one of the significant pollutants in wastewater and is ranked 11th out of the 126 priority pollutants according to environmental laws. Prior to being released into the water sources, its permissible concentration should be lower than 0.1 mg/L. Water that contains phenylic acid has an unpleasant flavour and smell. Other hazardous chemicals might arise as a result of it. Due to its cancer-causing qualities, it is dangerous even at very low quantities. Both humans and aquatic life are negatively impacted by it2.
Phenylic acids and their derivatives are consistently found in the effluents from firms that manufacture a broad range of chemicals, especially plastics, dyes, and facilities that treat coal thermally. Even in little amounts, many of these phenylic acids are cancer-causing agents3. There is ample evidence of the poisonous and dangerous properties of phenylic acids and their derivatives4-6. Wastewater from the varnish, denatured alcohol, petrochemical, coal conversion, pharma, plastic, iron-steel, paper-and-pulp, and pulp and paper industries typically contains phenolic acidic compounds. Charcoal, Silicone, glass powder, polymeric resins, fly ash, and many others are just some of the adsorbent solids that can be used7.The workers exposure to phenylic acid through inhalation, ingestion, eye or skin contact may lead to various harmful effects. It can also lead to other health effects such as coma, convulsion, cyanosis etc8. To safeguard the environment and public health, phenylic acid from wastewater must be removed. So, before wastewater is released into the water source, it needs to be treated to remove phenylic acid. To eliminate phenylic acid from wastewater and lessen its damaging impact on the environment, a variety of techniques have been explored. The numerous treatment techniques include electrochemical processes, biodegradation, biosorption, pervaporation, membrane separation processes8, extraction, ion exchange methods9, 10, distillation, adsorption11-13 and oxidation procedures14 – 17.
Lantana camara
Lantana camara is a plant that can grow up to 6 feet tall and has sharp thorns. The stems are square in cross-section, hairy, armed, or armed with scattered spikes, and bristly. It refers to having a deep and robust root system. Even after constant digging up of the roots, a new flush of shoots will emerge from the existing ones. They feature simple leaves that look like long petals with margins that are serrated in a blunt manner. There is a pungent odour coming from the leaves of the plant. They have a dense covering of blooms that are all different colours and are quite little. The flowers undergo a transformation in hue as they come into bloom. The yellow hue of the bloom serves as a visual indicator to potential pollinators, and the colour of the blossom alters when it has been fertilised. They bear fruits that are initially green, then turn purple, and finally turn a dark blue-black colour. The seeds in these fruits are quite small. The fruits are toxic, but they bring in animals and birds due to their attractiveness.
The introduction of the South and Central American invasive weed Lantana camara had devastating effects on the natural diversity of the terrestrial ecosystem. Several plants have been documented as effective insecticides, antifeedants, insect development regulators, and repellents, demonstrating the importance of biopesticides as alternatives to synthetic pesticides. Sustainable pest management is possible with biopesticides rather than chemical pesticides. In addition to the resistance issues that plague chemical pesticides, there is also the troublesome residual that makes using them a cause for consumer worry. In contrast to chemical pesticides, biopesticides have limited success. One such plant that have potential as a bioinsecticides is Lantana camara18. Around 60 countries have been invaded by this weed, making it one of the 100 worst parasitic weeds in the world. In 1809, the British brought it to India specifically for the Calcutta Botanical Garden as a decorative shrub. It can be found in any type of Indian landscape, from cultivated fields to grazing lands to abandoned lots to the woods. The loss of native species variety, as well as changes to the ecosystem and its function, pose a risk to the natural environment as a result of its introduction.
Lantana camara was chosen as an adsorbent for the investigation when looking for a plant weed. An invasive poisonous weed called Lantana camara spreads quickly, kills native species, threatens the ecology, and reduces biodiversity19, 20. As a result, the ecosystem may be preserved through the use of Lantana camara as an adsorbent, and the challenge of properly managing the disposal of waste from the forest can be addressed. The tropical moist deciduous woods of the Western Ghats, Coorg, and Karnataka in India were the locations where the dried bark of Lantana camara was collected. Our research highlights the use of Lantana camara as an adsorbent to extract phenylic acid from waste water. Lantana camara is one of many plant weeds that are utilised as an adsorbent.
Phenylic acid as adsorbate
Phenylic acid is a chemical that has a fragrant odour. In normal conditions, it takes the shape of a solid crystal and is capable of absorbing moisture. In most cases, pure phenylic acid will have a white appearance, but impure phenylic acid will be coloured and have an unpleasant smell. It dissolves well in polar solvents like ethanol and ether, although it has a lower solubility in water than those other solvents. It smells strongly of a smelly substance. In addition to being a germicide and anaesthetic, phenylic acid is utilised for disinfection. Because of its uses, it is sometimes prescribed as medicine for animals. The examination of chemical substances benefits greatly from it. phenylic acid-formaldelyde resin is made using a significant amount of phenylic acid (Bakelite). In the adhesive, building, and automotive industries, the resin becomes a crucial fundamental component.
Materials and Methods
Phenylic Acid Removal Batch Studies Using Lantana Camara
As a result, in this experiment, chemically treated lantana was used as an adsorbent for the removal of phenylic acid in the batch investigations. The impact of a variety of operating circumstances, including pH and starting concentration, as well as adsorbent quantity and contact time, was investigated.
Preparation of the adsorbent from Lantana camara Activated Carbon (LCAC)
All of the earthy material was completely removed from the raw material by properly cleaning it with distilled water. The stem with the leaves of the plant was washed, let to dry for two days in direct sunlight, cut into small pieces, ground into a fine powder, and then sorted into particles smaller than 0.075mm. In order to enhance the surface qualities, the raw powder underwent chemical treatment. In a 1: 1 ratio, it was treated with 1N HCl and stirred for 6 hrs at a constant temperature of 85 0C. Enough water was added to the mixture in order to wash off the extra chemicals in the powder. It was thoroughly rinsed with water three to four times until the pH reached seven. For the studies, the powder was finally dried in an oven at 120 0C for 8 hrs and stored in an airtight container named as Lantana camara activated carbon (LCAC). The characteristics of the chemically treated adsorbent LCAC, was tested for the physical parameters as given in the table 1. The adsorbent (LCAC) that had been treated with Hydrochloric acid was employed for batch studies after taking into account the preliminary results.
Table 1: Physical Characteristics of the adsorbent
|
S. No. |
Physical parameters |
Value |
|
1 |
Volatile matter in percentage |
43.57 |
|
2 |
Moisture in percentage |
6.38 |
|
3 |
Ash matter in percentage |
4.78 |
|
4 |
Fixed Carbon in percentage |
41.26 |
|
5 |
Particle size |
75µ |
Preparation of Adsorbate
Analytical grade phenylic acid purchased from Precision Scientific , Tiruchirappalli, of Sigma Aldrich make was used. The phenylic acid of different concentration was prepared using de-ionised water.
Use of Batch Studies To Characterize The Adsorbent and Phenylic Acid Removal
It is a well-known fact that the removal of phenylic acid by the use of traditional adsorbents is an expensive process. As a result, it is necessary to manufacture adsorbents out of natural resources that are available at a reasonable cost. The removal of phenylic acid involves a number of different processes that use plant products as adsorbent. An effort has been made to eliminate phenylic acid from wastewater by employing Lantana camara activated carbon as an adsorbent. The characteristics of the adsorbent determine the adsorption capacity achieved.
Through the addition of either 0.1M HCl or 0.1M NaOH, the pH of the solution was changed in the batch studies from 2.5 to 12. The temperatures were maintained between 25 0C and 55 0C while the dosages of both adsorbents were added in the range of 0.25 to 3 g.
Experiments were carried out in a shaker with a temperature control at a rate of 140 revolutions per minute and a temperature of 25 degrees Celsius for 8 hours, respectively, for HCl treated adsorbent. After establishing the equilibrium conditions, the samples were taken, filtered, and a UV spectrophotometer was used to determine the phenylic acid concentrations at 270 nm. The thermodynamic study was carried out in conical flasks with a capacity of 250 mL and 200 mL, each of which contained phenylic acid solution with varying initial concentrations of 25, 50, 100, 150, 200, and 250 mg/L. Varying the temperature from 25 degrees to 55 degrees Celsius produced optimal conditions for the experiment..
Experiment layout and planning
The analysis of variance and regression models are both determined with the assistance of the experimental statistics. The adsorbent dosage (five to ten grams), the pH of the solution (five to eight), the starting concentration (twenty-five to two hundred milligrams per litre), and the contact period are the parameters that are used as input (70 to 140 min). The Box-Behnken design and the response surface methodology have both been utilised in the course of the optimization procedure. There were a total of 17 separate experiments carried out, and both the lowest and highest possible values were determined by analysing the results of the trials. The response of the system has been determined to be the amount of phenylic acid that has been removed as measured in percentage (%), and the ranges of these values are presented in Table 2.
Results and Discussion
Surface Morphology study
Analysis using a scanning electron microscope was performed on the plant material, raw adsorbents, and adsorbents that had been treated with acid to determine their characteristics (Fig.1 a and b). It should come as no surprise that the figure reveals a very porous network, and that treating it with acid results in the appearance of additional pores, which demonstrates the incorporation of phenylic acid into the LCAC. It can be seen that the pores are not distributed in a consistent manner and that they are scattered throughout the entire structure. Following adsorption, the surface of the material will have expanded pores as a result of the loss of organic volatiles (Fig.2).
 |
Figure 1: Scanning Electron Micrograph Images of Lantana camara activated carbon (a). Before acid treatment (b). After acid treatment. |
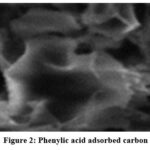 |
Figure 2: Phenylic acid adsorbed carbon |
The impact of pH
Because carbon is amphoteric, pH affects adsorption. Phenylic acid has a 9.8 pKa. When the pH is higher than its pKa, phenylic acid dissociates into phenoxide ion. When the pH level is high, there is a higher concentration of the negatively charged phenoxide ion. As a result, there is an increase in the amount of electrostatic repulsion that occurs between the negatively charged surface of the carbon and the phenoxide anions that are in solution. Phenylic acidic compounds exist as the unionised acidic compounds at lower pH values, and this increases the attraction between charged particles caused by electrostatic force between the phenylic acid and the adsorption sites. Figure 3 indicates that the adsorption capacity of HCl-treated adsorbents grows steadily up to pH 7, but then quickly declines above pH 7 due to the attraction seen between the negatively charged carbon surface and the phenoxide ions21, 22.
 |
Figure 3: Percentage removal of phenylic acid with varying pH. |
Adsorbent dose effects
Experiments were conducted with phenylic acid at an initial concentration of 200 mg/L to determine the effect of adsorbent dose on phenylic acid adsorption. Figures 4.5 and 4.6 illustrate how the dosage of the adsorbent affects the elimination of phenylic acid. It was discovered that as the adsorbent dose is increased, the % removal rises. The percent removal ranged from 58.6 to 89.6% for adsorbent dosage of 0.25 to 0.75 g for adsorbent treated with HCl. Since more sorption surface and adsorption sites are now available, more phenylic acid is being removed from the water. It was also known that a higher ratio of dosage to solute concentration would lead to a lower solute concentration in the solution due to increased sorption onto the adsorbent. It was determined through study that the optimal doses of HCl- and KOH-treated adsorbent were 0.75 g and 1 g, respectively23.
Effect of initial concentration and contact time
The initial concentration provides crucial information about the driving power necessary to overcome all molecules’ mass transfer resistances between the liquid and solid phases. The fluctuation of percent elimination with beginning concentration is shown in Figure 4. The influence of initial concentration was tested by varying the concentration from 25-250 mg/L under the optimal circumstances. Fast adsorption occurs in the first period, followed by progressive adsorption that achieves equilibrium at 7 and 8 hours. This is because there are more unoccupied sites available in the early stages, which causes a higher adsorption rate. Adsorption starts to decline after a while as adsorbate builds up in the empty sites24. The figure also revealed that the interaction between phenylic acid and the active sites on the adsorbent surface increases as the initial phenylic acid concentration rises. As a result, phenylic acid molecules need additional active sites, which lowers the percentage of phenylic acid elimination. Therefore, phenylic acid absorption is decreased by an increase in starting concentration. The authors of the investigation observed similar types of outcomes.
 |
Figure 4: Percentage removal of phenylic acid with varying concentration (mg/L) |
Modeling ANN
Modeling and simulating the adsorption mechanism is difficult due to its very non-linear relationship. ANN can optimise processing settings for this non-linear connection with a good representative model. Artificial Neural Networks (ANNs) use artificial neurons to simulate biological networks. Multilayer feed-forward back-propagation neural networks anticipate optimal responses. This study used a feed-forward neural network with 20 hidden neurons. This network is depicted in Figure 5, and all of the ANN calculations were carried out with the help of the neural network toolbox in MATLAB. The backpropagation method was utilized for the model in which the pH, initial concentration and adsorbent amount were fed into the ANN model as its input layers.
 |
Figure 5: The proposed feed-forward back-propagation neural network structure. |
The effective elimination of phenylic acid served as the model’s output layer. The learning rate (ἠ) and momentum (µ) were set to values of 0.95 and 0.5 respectively13, and the performance metrics that are being assessed are RMSE, correlation coefficient (R2) and determination coefficient (DC) shown in table 2. The R and DC values for the effect of pH, adsorbent and the initial concentration are all closer to 1, and the RMSE is on the lower side. The ANN model’s predicted values for phenylic acid are confirmed to be extremely close to the experimental values.
Table 2: RMSE, R2 and DC
|
|
RMSE |
R2 |
DC |
|
pH |
0.007379 |
0.9999 |
0.9999 |
|
Adsorbent amount |
0.001693 |
0.9992 |
0.9998 |
|
Initial Concentration |
0.008429 |
0.9991 |
0.9982 |
The formula that is used to compute the percentage of variation between the experimental and ANN projected values for the elimination of phenylic acid can be found below

Table 3: Removal of phenylic acid using by artificial neural network (ANN)
|
Expt. No. |
Effect of pH on the removal of Phenylic acid |
Effect of adsorbent on the removal of Phenylic acid |
Effect of initial concentration on the removal of Phenylic acid |
||||||
|
Experimental |
ANN Predicted |
MAPE |
Experimental |
ANN Predicted |
MAPE |
MAPE |
ANN Predicted |
MAPE |
|
|
1 |
92.3 |
92.3 |
0.06% |
53.7 |
53.7 |
0.00% |
29.4 |
29.93 |
1.80% |
|
2 |
93.6 |
93.6 |
0.16% |
66.4 |
66.392 |
0.01% |
45.7 |
44.673 |
2.25% |
|
3 |
94.2 |
94.2 |
0.09% |
69.3 |
69.315 |
0.02% |
56.9 |
58.568 |
2.93% |
|
4 |
94.6 |
94.6 |
0.11% |
77.1 |
77.08 |
0.03% |
67.4 |
66.807 |
0.88% |
|
5 |
94.8 |
94.8 |
0.10% |
78.3 |
78.341 |
0.05% |
73.5 |
73.346 |
0.21% |
|
6 |
95.4 |
95.4 |
0.01% |
89.7 |
89.504 |
0.22% |
78.9 |
77.66 |
1.57% |
|
7 |
95.8 |
95.8 |
0.00% |
91.5 |
91.809 |
0.34% |
80.7 |
81.748 |
1.30% |
|
8 |
86.8 |
86.8 |
0.00% |
91.8 |
91.977 |
0.19% |
84.6 |
84.807 |
0.24% |
|
9 |
78.7 |
78.7 |
0.02% |
92.1 |
91.852 |
0.27% |
88.3 |
87.45 |
0.96% |
|
10 |
67.6 |
67.6 |
0.04% |
|
89.6 |
89.19 |
0.46% |
||
|
11 |
55.7 |
55.7 |
0.03% |
90.9 |
91.341 |
0.49% |
|||
|
12 |
46.4 |
46.4 |
0.02% |
92.2 |
92.727 |
0.57% |
|||
|
13 |
|
93.5 |
93.631 |
0.14% |
|||||
|
14 |
94.8 |
94.995 |
0.21% |
||||||
Table 3 shows that the average error percentage for all runs is 0.50%, which means that the ANN models are able to accurately forecast the adsorption of phenylic acid. This is demonstrated by the fact that the error percentage is equal to 0.00% for many runs and nearer to zero in other runs.
Conclusion
Batch study reports revealed that the equilibrium was achieved after a contact period of 8 hours at a buffer of pH 7 for the initial concentration of phenol of 25 mg/L each. The removal efficiencies for LCAC were found to be 94.8% at pH 7, 89.6% for 114.3 mg/g gram of the adsorbent and higher adsorption at initial concentration of the solution and later on the adsorption of phenylic acid decreases due to the unoccupied sites on the adsorbent. Using the batch studies experimental data the prediction of phenylic acid removal efficiency using ANN technique is employed. In order to simplify the modelling process, feed forward networks that incorporate a backpropagation learning algorithm were designed and developed. According to the findings, the margin of error for the ANN model output was considerably under 5%. Also the R2 and DC values are more than 0.95 which could forecast phenylic acid removal efficiently. In adsorption, ANN can forecast pollutant removal effectiveness.
Acknowledgment
I wish to encompass my sincere thanks and gratitude to the management of Nehru Memorial College, for their help and encouragement.
References
- Öztürk, H.; Barisçi, S.; Turkay, O.; Veli, S. J. Environ. Eng. 2019, 145, 04019014.
CrossRef - Kowalczyk, P.; Deditius, A.; Ela, W. P. Carbon. 2018, 135, 12-20. https://doi.org/10.1016/j.carbon.2018.03.063
CrossRef - Denizli, A.; Cihanger, N.; Taner, A.; Taner, M.; Alsacak, G. Process Biochem.2004, 39,2025-2030. DOI:10.1016/j.procbio.2003.10.003
CrossRef - Slein, M. W.; Sansone, E. B. (1980) Degradation of Chemical Carcinogens. Van Nostrand Reinhold, New York, USA
- Rajkumar, P.; Buvaneswari, N.; Abdul Vaheith, Z .; Fiaz Ahamed, A.; Saraswathy, G.; Dayanandhan, R. Rasayan journal of chemistry, 2021, 14, 785. http://dx.doi.org/10.31788/RJC.2021.1426225
CrossRef - Nidhi, Y.; Dhruv Narayan, M.; Shalu, R.; Jiwan, S.; Environ. Eng. Res. 2020, https://doi.org/10.4491/eer.2019.238
CrossRef - Srivastava, V. C.; Swam, M. M.; Mall, I. D.; Prasad, B.; Mishra, I. M. Colloids Surf. A. 2006, 272, 89-104. DOI10.1016/j.colsurfa.2005.07.016
CrossRef - Abdelkreem, M. APCBEE Procedia, 2013, 5, 349 – 357, doi: 10.1016/j.apcbee.2013.05.060
CrossRef - Tian, H.; Hu, Y.; Xu, X.; Bioresour. Technol. 2019, 289, 121649. DOI: 10.1016/j.biortech.2019.121649
CrossRef - Víctor-Ortega, M. D.; Ochando-Pulido, J. M.; Martínez-Férez, A. Sep. Purif. Technol. 2016, 160, 136-144. DOI:10.3303/CET1647043
CrossRef - Crini, G.; Lichtfouse, E.; Wilson, L. D.; Morin-Crini, N. Environ. Chem. Lett. 2019, 17, 195-213. 10.1007/s10311-018-0786-8
CrossRef - Srinivasan, D., Ilavenil, K. K. Journal of Chemical and Pharmaceutical Sciences, 2017, 10, 363-70.
- Ilavenil, K. K.; Pandian, P.; Kasthuri, A. Materials Today: Proceedings, https://doi.org/10.1016/j.matpr.2022.09.402
CrossRef - Lee, C. G.; Hong, S. H.; Hong, S. G.; Choi, J. W.; Park, S. J. Water Air Soil Pollut. 2019, 70,230. http://dx.doi.org/10.1007/s11270-019-4125-x
CrossRef - Anbarasu, K.; Ilavenil, K. K. International Journal of ChemTech Research, 2017, 10, 341-349.
- Anbarasu, K.; Ilavenil, K. K. Oriental journal of chemistry, 2019, 35, 436-441, http://dx.doi.org/10.13005/ojc/350156
CrossRef - Ilavenil, K. K.; Kasthuri, A.; Anbarasu, K. Rasayan Journal of Chemistry, 2022, 15 1660-1667. DOI: http://doi.org/10.31788/RJC.2022.1536920
CrossRef - Hikmat, Kasmara, Melanie, Dea Audia Nurfajri, Camellia, P.; Wawan, H.; AIP Conference Proceedings, 2018, 1927, 030046. https://doi.org/10.1063/1.5021239
CrossRef - Khan, A.; Chen, Z.; Zhao, S.; Bioresour. Technol. 2019, 285, 121291. https://doi.org/10.1016/j.biortech.2019.03.130
CrossRef - Massa, A.; Hernándeza, S.; Ansaloni, S.; Castellino, M.; Russo, N.; Fino, D. Electrochim. Acta, 2018, 273, 53-62. https://doi.org/10.1016/j.electacta.2018.03.178
CrossRef - Buhani Megafhit, P.; Rahmawaty, Suharso, Mita, R.; Sumadi. Oriental journal of chemistry, 2018, 34, 2043-2050, http://dx.doi.org/10.13005/ojc/3404043
CrossRef - Jamwal, H. S; Kumari, S.; Chauhan, G. S.; Reddy, N. S.; Ahn, J. H. J. Environt. Chem.Eng., 2017, 5, 103-113. https://doi.org/10.1016/j.jece.2016.11.029
CrossRef - Smithaa, T.; Thirumalisamy, S. Manonani, S. E-Journal of Chemistry, 2012, 9, 1091-1101.
CrossRef - Banerjee, A.; Sarkar, P.; Banerjee, S. Ecol. Eng. 2016, 86, 13–23. DOI:10.1016/j.ecoleng.2015.10.015
CrossRef

This work is licensed under a Creative Commons Attribution 4.0 International License.
About The Author
![]()
A New Edition of Web of Science
Journal Impact Factor
2022: 0.5
Five Year: 0.8
Journal is Indexed in

Cabells Whitelist
![]()


