Synthesis, Characterization and Solvent Effect on the Absorption of Carbanionic Sigma Complex
Malarvizhi Rengasamy and Bhavya Muthukumar*
Department of Chemistry, Seethalakshmi Ramaswami College, Affiliated to Bharathidasan University Tiruchirappalli-620002, Tamil Nadu, India.
DOI : http://dx.doi.org/10.13005/ojc/380604
Download this article as:
![]()
The structure analysis proves that a new type of carbanionic sigma complex using CNBFz, substituted barbituric acid, and amine-containing heterocyclic nitrogen atom yielded new carbanionic sigma complex with lengthened chromophoric entities (proved through spectral studies) in the pure form and the yield of the product is appreciably high (70-80%). The expected structure of the carbanionic sigma complex of the current work is evidenced through FT-IR, 1H NMR, and 13C NMR. The extended conjugation has led to considerable solvatochromic effect and fluorescent behavior.
KEYWORDS:4-chloro-7-nitrobenzofurazan (CNBFz); 1,3-dimethyl barbituric acid; imidazole; solvent effect
Introduction
A super-electrophilic reagent of current interest for SNAr reactions in organic chemistry is CNBFz. It produces derivatives (substitution products) with amines, amino acids, crown ethers, thiols, phenoxides, phenols, etc., and the majority of the byproducts are fluorogenic compounds. These fluorescent compounds are used as probes to identify and quantify a variety of substances1. It has been reported that nitro pyrimidines can form anionic sigma complexes with ketones; frequently, these compounds are identified as intermediates. In the product,1, 3-dimethylbarbituric acid moiety is tagged with benzofurazan moiety with the elimination ofchloro group and the resulting entity forms the negative part of the carbanionic sigmacomplex which is a substituted barbiturate and protonated amine moiety constitutes the positive counterpart of the complex. Thus, the carbanionic sigma complex is themolecular salt with a cation and an anion. As the carbanionic sigma complex has salt likestructure, it dissolves in water appreciably, nevertheless, it dissolves in fat alsoappreciably. The presence of benzofurazan ring and amine components facilitates the dissolution of the complex in fat. Hence it is interesting to note that the carbanionicsigma complexes of present work have appreciable solubility both in water and fatand this sort of hydrophilic/lipophilic balance is very essential for superb drug-targetinteraction.2
Experimental methods
Synthesis
In ethanol, 0.01 mol of analar grade CNBFz was dissolved. Additionally, NDMBA (0.01 mol) was dissolved in ethanol separately. These two solutions were combined, and then imidazole (0.01 mol) was added and thoroughly mixed for seven hours. After shaking, the solution was maintained at 298K for an additional 48 hours. After this time, distillation under reduced pressure was used to get rid of the excess ethanol. The resulting amorphous dark purple solid settles to the base of the conical flask. After being rinsed and drained for several hours, the amorphous solid was washed, drained and the amorphous solid was recrystallized from purified ethanol (80% yield; m.p. 527K).
Results and Discussion
Characterization
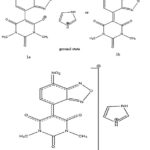
Spectral data of the molecule strongly supports the structure for the sigma complex (Fig .1) obtained from CNBFz, NDMBA and imidazole.
 |
Figure 1: Synthesized carbanionic sigma complex |
The ethanolic solutions of CNBFz, NDMBA, and Imidazole develop a dark purple color. The presence of a strong sharp absorption band (indicating the C- Cl stretching mode) at about 728 cm-1 in the infrared spectrum of CNBFz (Fig.2) The absence of this band in the IR spectrum of an isolated carbanionic sigma complex (Fig.3), these indicate that the chlorine atom was removed from CNBFz during complexation. However, a medium band is shown at 760 cm-1 in the IR spectra of the complex, which might be formed by the C-H bending mode specifies the removal of chlorine atoms from CNBFz during complexation. Strong sharp absorption bands are seen at 1514 and 1323 cm-1 in the IR spectrum of CNBFz (Fig.2), which correspond to the asymmetric and symmetric stretching vibrations of the nitro group’s N-O bond, respectively. In the IR spectrum of synthesized carbanionic sigma complex (Fig.3) also they are observed at 1504 cm-1 νN-O (asym.) and 1310 cm-1 νN-O (sym.). In the IR spectrum of the complex, the broadband reminiscent of an amine salt is seen between 2900 and 3500 cm-1 (Fig.3)3. A strong sharp band characteristic of the torsional oscillation of amine salt is also seen at 505 cm-1 in addition to this broad band4. The band concerning the C=C (str.) mode often occurs at 1650 cm-1. It is supported by the observation that it is involved in delocalization because it occurs in the complex at a lower frequency area of 1615 cm-1.
 |
Figure 2: IR spectrum of CNBFz |
 |
Figure 3: IR spectrum of complex |
Two signals are observed in the PMR spectrum of CNBFz (Fig.4), which represents two ring protons in various chemical conditions. These two nearby ring protons have doublet resonances at δ 8.67 and δ 8.01 ppm. The signal for the methyl protons of the N-CH3 group of the barbiturate molecule may be seen at (δ 3.15 ppm) in the complex PMR spectrum (Fig.4). In contrary to the proton signals of CNBFz, the protons are shielded and exhibit absorption in the upper field (at δ 8.53 and 7.83 ppm) in the PMR spectrum of the complex (Fig. 4) due to the formation of negative charge in the nitroaromatic moiety.
In CNBFz, the 13C NMR spectrum shows six signals (Fig.5). The 13C NMR spectrum shows twelve signals as a result of thirteen different chemical carbon environments (Fig.6). The present study’s unique peak, a new absorption signal at (90.33 ppm), is exclusively seen in the 13C spectrum of carbanionic sigma complex and not in the 13C NMR spectra of NDMBA or CNBFz. This signal is linked to the newly formed carbon environment (C=C environment)5.
 |
Figure 4: 1HNMR spectrum of CNBFz |
 |
Figure 5: 1HNMR spectrum of complex |
 |
Figure 6: 13CHNMR spectrum of CNBFz |
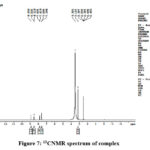 |
Figure 7: 13CNMR spectrum of complex |
Solvent effect on the absorption spectra of carbanionic sigma complex
When a change in the medium’s polarity causes a noticeable shift in a UV-visible absorption band’s position and occasionally intensity, the phenomenon is referred to as solvatochromism. The position, intensity, and shape of the absorption band can all change depending on the type of solvent used to detect the absorption spectra in different solvents with varying polarities. 6,7 Since measuring the absorption spectrum in the gas phase is typically not practicable, numerous writers have discussed how the solvent’s composition can affect how an absorption spectrum is affected by the medium.8,6,7 Negative solvatochromism is a common name for a hypsochromic shift that occurs with increasing solvent polarity. Positive solvatochromism refers to the bathochromic shift that corresponds (to decreased solvent polarity). Only -electrons-containing molecules whose charge distribution (and consequently the dipole moment) in the electronic ground state is significantly different from that in the excited state are known to exhibit a strong solvatochromism.8 Due to the difference between the dipole moments of the ground and excited states, the synthesized carbanionic sigma complex of the current study is anticipated to exhibit considerable solvatochromism (1a, 1b, and 1). As anticipated, there is a striking change in the wavelength of maximum absorption when the solvent is switched from protic to apolar aprotic by the use of dipolar aprotic solvents. (Table.1; Fig.8).
The transition energy is calculated from λmax values by using the equation E=Nhc/λ. The transition energiesand ET(30) values are present in Table 1.
 |
Scheme 1 |
Based on the wavelength of the pyridinium-N-phenoxide betaine dye’s 2 maximum absorption in different polarity liquids, ET(30) values are provided. When using water as the solvent instead of diphenyl ether, 2a wavelength shifts by 357 nm.
 |
Scheme 2 Click here to View scheme |
Betaine dye solutions are available in a variety of colors that cover the entire visible spectrum: red in methanol, violet in ethanol, blue in isoamyl alcohol, green in acetone, and yellow in phenetol. To determine the polarity of a solvent, Dimorth and coworkers have employed these exceptional solvent shifts as empirical measures. 9 They have proposed a solvent polarity parameter, ET(30) [dye no. 30 in reference],9 which is defined as the transition energy of the dissolved betaine dye 2, measured in kcal/mol by Eq. 1
ET(kcal/mol) = h.c.ῡ N = 2.859.10-3.ῡ (cm-1) —–-Eq.1
h is Planck’s constant,
c is the velocity of light,
ῡ is the wavenumber of the photon which produces the electronic excitation and
N is Avogadro’s number.
Since the anion is anticipated to be firmly solvated by hydrogen bonding, the complex is present in hydroxylic solvents as a cation-free anion rather than a sufficiently tight ion aggregate. It is therefore plausible to believe that the shifts in these solvents are caused by hydrogen bonding of the electron-rich oxygen of the nitro group in the nitronate moiety or the olate ion in the olate form. Given that the oxygen of the nitro group is more negatively charged in the ground state (1a and 1b) than it is excited 1, a stronger hydrogen bonding should result in a larger blue shift.
Accordingly, the transition energy has been observed to increase with the increase in the polarity of the solvent. The λmax values of the complexin different DMSO-H2O compositions are given below.
Solvent λmax
DMSO-H2O (75% v/v) 560
DMSO-H2O (50% v/v) 525
DMSO-H2O (25% v/v) 514
As mentioned above, there has been evidence of a hypsochromic shift with increasing water content. Water can create hydrogen bonds with oxygen lone pairs, hence reducing the energy of the ground state. The degree of hydrogen bonding also increases as the amount of water in the DMSO-H2O mixture does. At high water content in the DMSO-H2O mixture, the hypsochromic shift is seen as a result of the stabilization of the ground state by hydrogen bonding. Therefore, hydrogen bonding plays a major role in solvation in hydroxylic fluids. The non-hydroxylic solvents’ placement on the opposing limb suggests that a distinct solvation process is at work. Poor anion solvation includes non-hydroxylic solvents.
The shift in solvents can therefore be explained by supposing that the anion and cation are interacting. The ionizing power of the solvents as measured by Grunwald- Winstein’s Y value has a linear association with ET(30) values. Therefore, greater separation between the cation and anion may be anticipated when the ET(30) value increases. A red shift ought to result from such a charge separation. When the ET(30) value increases, the redshift gets larger.
Table 1: Electronic spectral shifts of complex in a range of solvents and ET30 values of solvents.
|
S. No |
Solvent |
Absorption λmax |
Eobs Kcal/mol |
ET/30 Kcal/mol |
|
1 |
Water |
503.05 |
56.83 |
63.1 |
|
2 |
Ethanol |
529.20 |
54.02 |
51.9 |
|
3 |
Propan-1-ol |
530.45 |
53.89 |
49.2 |
|
4 |
Propan-2-ol |
537.95 |
53.14 |
48.6 |
|
5 |
Hexan-1-ol |
536.65 |
53.27 |
48.8 |
|
6 |
Heptan-1-ol |
536.70 |
53.2 |
48.5 |
|
7 |
Octan-1-ol |
536.70 |
53.26 |
48.1 |
|
8 |
Benzyl alcohol |
544.10 |
52.54 |
50.8 |
|
9 |
Isoamyl alcohol |
534.20 |
53.51 |
49.0 |
|
10 |
Acetic acid |
411.20 |
69.52 |
55.2 |
|
11 |
Acetone |
590.10 |
48.44 |
42.2 |
|
12 |
Acetylacetone |
596.25 |
47.95 |
49.2 |
|
13 |
DMF |
596.30 |
47.94 |
43.8 |
|
14 |
DMSO |
595.05 |
48.04 |
45.0 |
|
15 |
Acetonitrile |
580.15 |
49.28 |
45.6 |
|
16 |
Acrylonitrile |
583.85 |
48.96 |
46.7 |
|
17 |
Methylacetate |
567.75 |
50.35 |
40.0 |
|
18 |
THF |
582.65 |
49.06 |
37.4 |
|
19 |
Ether |
571.45 |
50.03 |
34.5 |
|
20 |
Dioxan |
526.70 |
54.28 |
36.0 |
|
21 |
DCM |
528.00 |
54.14 |
40.7 |
|
22 |
Nitrobenzene |
602.50 |
47.45 |
41.2 |
|
23 |
Ethylene glycol |
529.20 |
54.02 |
56.3 |
|
24 |
Formamide |
560.30 |
51.02 |
56.6 |
|
25 |
Ethylacetoacetate |
338.50 |
84.41 |
49.4 |
|
26 |
Acetophenone |
596.30 |
47.94 |
40.6 |
|
27 |
Morpholine |
443.35 |
64.48 |
41.0 |
|
28 |
Pyridine |
587.60 |
48.65 |
40.5 |
 |
Figure 8: Absorption spectra of complex in solvents of different polarity |
Conclusion
CNBFz, chosen for the present investigation, is an excellent electrophilic agent of current interest in SNAr reactions. The transition energy has been observed to increase with the increase in the polarity of the solvent. The carbanionic sigma complex of CNBFz are deeply colored. They show remarkable solvatochromic effect and fluorescent behavior and hence may be probably used in the biomedical field and optoelectronics.
Acknowledgement
We sincerely thank SAIF-IIT Madras for providing the 1HNMR and 13CNMR.
Conflict of Interest
Regarding the publishing of this work, the authors declare that there are no conflicts of interest.
References
- Jackson, C.J.; Gazzolo, F.H. J. Am. Chem. Soc. 1900, 23, 376.
- Meisenheimer, J. Justus Liebigs, Ann. Chem. 1902 323, 205.
CrossRef - Buncel, E.; Dust, J.’ Terrier, F. Chem. Rev. 1995, 95, 2261.
CrossRef - Strauss, M.J. Chem. Rev. 1970, 70, 667.
CrossRef - Crampton, M.R. Adv. Phys. Org. Chem., Academic Press, London, 1969, 7, 211.
CrossRef - Zheng, Y.J.; Ornstein, R.L. J. Am. Chem. Soc. 1997,119, 648.
CrossRef - Buncel, E.; Tarkka, R.M. Dust. J. M. Can. J. Am. Chem. 1994, 72, 1907.
CrossRef - Simkin, B. Y.; Gluz, E.B., Glukhovtsev, M.N., Minkin, V. Thermochem. 1993, 103, 123.
CrossRef - Strauss, M. J.; Fleischman, S., Buncel, E. Thermochem.1985, 22, 37.
- Briscese, S. M.J.; Riveros, J.M. J. Am. Chem. Soc. 1975, 97, 230.
CrossRef - Ingemann, S.; Nibbering, N. M. M., Sullivan, S. A., DePuy, C.H. J. Am. Soc. Chem. 1982,104, 6520.
CrossRef - Ingemann, S.; Nibbering, N. M. M. J. Org. Chem. 1983, 48, 183.
CrossRef - Browie. J. H.; Stapleton, B. J. Aust. J. Chem. 1977, 30, 795.
CrossRef - Bahrami, G.; Mohammadi, B. J. Chromatogr. B.2007, 850, 400.
CrossRef - Patrick, G.L.”An Introduction to Medicinal Chemistry “1st ed., Oxford University Press, 1995.
- Reichard, C. Empirische parameter der losungs-mittelpolarritat Angew, Chem. 1965, 77, 30.
CrossRef - Yoshida, Z. Solvents Effects upon spectra, Kogyo Kagaku Zasshi. 1970, 73,225; Chem.Abstr. 1972, 76, 291972.
- Rao, Singh C.N.R.; Senthilnathan, V.P. Chem..Soc. Rev. 1976, 5, 276.
CrossRef - Silverstein, R.M.; Webster, F.X. “Spectrometric Identification of Organic Compounds”, John Wiley and Sons, New York, 2004, 103.
- Ramachandran, E.; Baskaran, K.; Natarajan, S. Cryst. Res. Technol. 2007, 42, 73.
CrossRef - Kemp, W. “Organic Spectroscopy”, Palgrave,1991, 192.
CrossRef - Yoshio, Z.; Kogyo Kagaku Zasshi, 1970, 73, 2225 in Chem. Abstr. 1972, 76, 29197z.
- Rao, C.N.R.; Singh, S.; Senthilnathan, V.P. Chem. Soc. Rev. 1976, 5, 297.
CrossRef - Reichardt, C. “Solvent effects in Organic Chemistry”, New York, Verlag Chemie, Weinheim, 1979.
- Dimroth, K.; Reichardt, C.; Siepmann, T.; Bohlmann, F. Justus Liebigs Ann. Chem. 1963, 661, 1.
CrossRef
Second Review by: Dr. Sangu Venkatachalam
Final Approval by: Dr. Ong Keat Khim


![]()


