Pyrolytic Preparation of Active Carbons from Peanut Shell biomass for Adsorptive Elimination of Fluoride from Groundwater of Shekhawati Region
Anurag Choudhary1* , Anurag Kadawasara1, Sardar Singh Poonia1, Praveen kumar1 and Vikash K Janu2
1Department of Chemistry, JNV University, Jodhpur, Rajasthan, India.
2Defence Laboratory, Ratanada Palace, Jodhpur, Rajasthan, India.
Corresponding Author E-mail: anurag051981@gmail.com
DOI : http://dx.doi.org/10.13005/ojc/380602
Article Received on : 20 Sep 2022
Article Accepted on :
Article Published : 26 Dec 2022
Reviewed by: Dr. Dinesh Kumar
Second Review by: Dr. D. K. Rawat
Final Approval by: Dr. Ioana Stanciu
Groundwater toxicants such as fluoride and nitrate are well known for their detrimental effects on human and animal health worldwide. Agricultural waste biomass is available in abundance in rural areas with much capacity to produce porous biochar by simple, environmentally friendly and cost-effective methods. In the study, Peanut shell biomass was used to prepare active carbons by a simple, facile pyrolytic method and demonstrated for adsorption of fluoride ions from groundwater collected from Shekhawati region of Rajasthan, India. The amorphous porous activated carbon, PSAC, was made using a pyrolytic method at a maximum temperature of 550 °C with alkaline stimulation and nitrogen flow (SBET = 479.569 m2/g, Vmicro = 0.124 cm3/g). Varied spectrometric gears includes XRD, FTIR, SEM, EDX, BET and pHzpc were equipped to characterize the prepared material. A batch experiment study was performed in investigate different adsorption parameters, adsorption isotherms and kinetic studies. The adsorption investigation shows that the PSAC effectively removed fluoride from aqueous solution, with sorption potential of 7.75 mg/gm capacity and 80 percent removal effectiveness. Adsorption isotherms study showed that Freundlich isotherm was best fitted with equilibrium study with linear regression of 0.993. To evaluate the pseudo-first and pseudo-second-order, as well as intra-particle diffusion concept, kinetic data were examined. Adsorption was followed by a pseudo-second order process, according to a kinetics investigation. Thus, it was expected that the research will increase and improve the economic utilization of peanut shell biomass for water purification.
KEYWORDS:Adsorption; Fluoride; Groundwater
Download this article as:| Copy the following to cite this article: Choudhary A, Kadawasara A, Poonia S. S, Kumar P, Janu V. K. Pyrolytic Preparation of Active Carbons from Peanut Shell biomass for Adsorptive Elimination of Fluoride from Groundwater of Shekhawati Region. Orient J Chem 2022;38(6). |
| Copy the following to cite this URL: Choudhary A, Kadawasara A, Poonia S. S, Kumar P, Janu V. K. Pyrolytic Preparation of Active Carbons from Peanut Shell biomass for Adsorptive Elimination of Fluoride from Groundwater of Shekhawati Region. Orient J Chem 2022;38(6). Available from: https://bit.ly/3WLN29J |
Introduction
Fluorine, which makes up 0.54 % of the earth’s crust, is commonly called a double-edged sword since minimal quantities impair dental growth while excessive amounts cause incurable dental, skeletal, and soft-tissue fluorosis1. About 372 million people (5.7%) in 24 countries, including Canada, Australia, Chile, Brazil, Ireland, Malaysia, the U.S., and Vietnam2, drink chemically fluoridated water. Despite the benefits, chronic high dosages can cause dental and bone fluorosis. Sometimes high dosages cause cancer3.
The Concentration of fluoride in this respect is very sensitive in the areas where fluoride in drinking water exists beyond its permissible limit regulated by various international agencies. Large extent of fluoride in drinking water can contributes leading source in the human diet. Consumption of potable water containing fluoride more than 1.5 mg/L has been accused of detrimental to health4 (WHO, 1994). In India national standard is 1.0 mg/L regulated by Beuro of Indian standard5 (BIS, 1991). Groundwater in many regions of the world’s developing nations, including Northern China, Sri Lanka, India, Pakistan, Mexico, the Western United States, Argentina, and several African countries, is highly fluoridated.
A report (WHO, 2019), estimates that 2.4 billion individuals and 486 million adolescents worldwide have decay in their permanent teeth6. As per recent data from the Ministry of Drinking Water and Sanitation, (as on 1.4.2014) there are approximately 11.7 million populations in 14,132 habitations from 19 States of India. The major fluoride affects states includes Delhi, Haryana, Punjab, Jammu, Kashmir, Gujrat, Uttar Pradesh, Madhya Pradesh, Andhra Pradesh, Bihar, Maharashtra, Karnataka, Kerala, Orissa, Tamil Nadu and Rajasthan7.
Uncertain rainfall in Rajasthan is an unwavering problem that only exacerbates drought and famine conditions. This situation is at worst in the desert portion, which covers about 61% of the state’s geographic area on the western and northern-western sides. The problem of poor water quality becomes harsh in the summer seasons of ninth months, as declining groundwater level creates more concentrated water with high toxic contents. According to report8 of the state government with the growing population, rainfall data, and per capita water usage, the state average water availability will decline to 561 CBM in 2025.
The problem of fluoride has drawn significant attraction to many researchers worldwide in the last two decades to develop and improve various technologies like photocatalytic- degradation, ozonation, adsorption, precipitation, membrane separation, coagulations etc. in making the drinking water more purposeful and safer. Adsorption is the most frequent and cost-effective approach due to its simplicity. Continuous research has been going on for decades for obtaining numerous quality adsorbents along with cost-effectiveness and effortless availability. Particular attention was paid to the sustainable development and use of natural resources, regional biomass waste and biomass derivatives9. In addition, abundant and renewable biomass waste has emerged as a promising precursor to offer many new applications to carbonaceous materials10.
Presence of oxygetated groups on the surface and lower condensation tendency, brightens up biomass to be tailored as a high percentage carbonaceous material with desired characteristics for various applications. Activated carbons (AC) are highly-porous bio materials that contain huge surface area and oxygen rich surface groups. Activated carbons made from biomass waste are used in many fields such as adsorbent11,12, supercapacitor13, oil-water separation14 resource recovery15 and so on.
Peanuts or groundnuts (Arachis hypogaea L) is an oilseeds leguminous crop widely cultivated in the tropic and subtropics 40 N° and 40 S° latitudes16. These are one of the most important agricultural waste residues, which can be used effectively for treating wastewater. In rural areas, most of the raw peanut shells are discarded as such and only few are being used as stock feed and building material. After China, India is the world’s second-largest producer of peanuts. It was assessed that in the fiscal year 2021 annual peanut production including shells in India was 6.73 million metric tons17.
Biochars prepared from peanut shells have been used for miscellaneous applications such as adsorbing toxic cations from industrial waste18, organic dyes19,20 adsorbing H2S and CO2 in indoor space21, 22, organic pollutants and heavy metals23 in soil treatment to increase soil water retention capacity and N fertilizer utilization efficiency by the plants24 as a catalyst in ammonia synthesis25 and many more.
The proposed work aims to synthesize active carbons (PSAC) from raw peanut shells and utilize them to eliminate or minimize fluoride toxic ions from groundwater samples collected from the Shekhawati region, India. The adsorption isotherms and kinetic parameters were studied to investigate sorption capacity. The produced adsorbent’s ability to effectively remove fluoride from standard aqueous solutions was evaluated in relation to the effects of some adsorptive parameters like adsorbent dose, starting adsorption concentration, pH, and contact time.
Material and method
Reagents
The main raw material peanuts were collected from some local field of Fatehpur Shekhawati, Rajasthan, India. KOH was purchased for the chemical activation of powdered shells. Fluoride stock solution was prepared from standard sodium fluoride (NaF). 100 mg/L standard fluorides solution were made by mixing of 0.221 gm anhydrous sodium fluoride in 1000 ml of doubly deionised water at room temperature. By appropriately diluting the stock solution, varied concentrations of fluoride solutions got prepared. Some real groundwater samples were collected from Shekhawati region to evaluate the removal efficiency of prepared bio sorbent fluoride elimination. SPADNS reagent (Sulfanilic acid-azochromotrop. 1,8-Dihydroxy-2-(4-sulfophenylazo) naphthalene-3,6-disulfonic acid trisodium salt) was purchased for fluoride determination spectrophotometrically. Entire chemicals needed in the experiment were of analytical grade and utilised without additional purification. Entire stages of the process used double-distilled water, produced in the department laboratory, as needed.
 |
Figure 1: Schematic diagram for preparing PSAC form peanut shells. |
Preparation method for active carbons
The shells were removed from peanuts and kept under direct sunlight for moisture vaporization for 72 hrs. The shells were then thoroughly washed in doubled-distilled water while being vigorously shaken to remove dirt and impurities. Then, the shells were oven-dried for 2 hrs. at 110 °C to obtain constant mass. The dried shells were smashed in a household mixture grinder into microscale sized particles and then sieved through a sieved shaker machine to obtain 70-80 mesh screen. Fully dried and powdered peanut shells were first carbonized in a vacuum furnace at 350, 450 and 550 °C maintaining each level for 10 minutes with a rate of 5°C/ min heating under nitrogen flow. Then the collected biochar was cooled and activated chemically by 5 M KOH solution overnight. The solution was agitating constantly using magnetic mixture at normal temperature. At this point, the biochar that had been saturated with an alkaline solution was separate out and then dried by 110 °C in oven for 2 hours. Finally, the sample was taken in an alumina crucible and heated in a vacuum applied muffle furnace for temperature ranges 250, 350, 450, 550 °C with rise of 10°C/ min. with retention time of 10 minutes at each level in the presence of continuous flows of N2 at a rate of 20 ml/min. Upon reaching at 550 °C the sample was held at the same condition for 2 hrs. After completing the procedure, the temperate of the furnace was reduced to room temperature. The active carbons were withdrawn from the crucible and washed with DI water several times with 0.05M HCL to obtain neutralized material before oven-drying. Finally, dried sample was pulverized and sieved to obtain resultant Peanut shell active carbon with a size of less than 0.5mm. Prepared active carbons were stored in a dedicator. The final yield of activated carbons from raw shells was 34.6 %.
Fluoride ion concentration analysis and Characterization of PSAC
Fluoride ion concentration was determined by SPADNS reagent using a spectrophotometer (systronics 106). Characterization of prepared materials was done with standard methods. Functional groups of activated carbons were identified by FT-IR. Exterior aesthetics and microstructure of the active biomass were analyzed by Scanning electron microscope (nova nanoSEM 450) and X-ray diffractometer (XPERT-PRO). Energy dispersive X-ray spectrum (EDS) was recorded for elemental analysis. Using quantachrome V5.21, the produced material’s surface area and pore size distribution were determined by the Brunauer-Emmett-Teller (BET) equation and the Barrett-Joyner-Halenda (BJH) model, respectively. The sample, having weighed approximately 0.0442 mg, was degassed at 200 °C for 5.3 hours. Afterwards, BET and BJH interpretations was applied through N2 adsorption-desorption isotherm at 77.35 K for obtaining pore size distributions and BET surface area.
Batch adsorption studies
The prepared bio sorbents were exposed to the fluoride adsorption process. The effect of sorbent doses (1, 2, 4, 6 and 8 g), contact times (5, 10, 20, 30, 60, 90 and 120 min), pH (ranged from 2-12) and varying initial fluoride contents (2, 4, 6, 8 and 10.0 mg/L) were investigated. For each batch experiment, a known concentration of a standard fluoride solution (100 ml) was added to a given quantity of adsorbent in Erlenmeyer flask of 250 ml and evaluated for the adsorption activity at a preset contact time at room temperature. Then, to attain adsorption equilibrium, this solution is constantly whirled using an orbital agitator at 140 rpm. After reaching equilibrium, all of the solutions were removed from the flask, passed through a Micron filtration, and the amount of residual fluoride was measured. Equations (1 and 2 ) were used to calculate the removal effectiveness (%) and uptake capacity (mg/g) for a specific experiment.
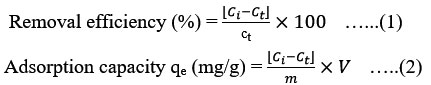
Where Ci is original fluoride content (mg/L), Ct is the residual fluoride (mg/L) at observed time t (min), m adsorbent mass (gm) and V is batch solution volume (L).
Adsorption isotherms
Experimental parameters gotten from the various models give vital indications about the adsorption process and affinities for the adsorbents. Two most universally approved isotherm models for adsorption in single-solute arrangements are the Freundlich and another is Langmuir models. It was possible to correlate the quantity of adsorption with the liquid phase concentration using the mathematical equations derived from these concepts. The best-fitting isotherm is often found using linear regression, and by comparative evolution of the correlation coefficients.
Adsorption equilibrium was examined by variety of initial F– concentrations from 2 to 10 mg/L. Adsorption tryouts were performed out for 150 minutes shaking at ambient temperature with an ideal pH level of 3 with input of 4 gm/100 ml adsorbent. Origin Pro 8.5 software was used to fit the experimental statistics into two representative models. A stronger correlation coefficient (R2) and lower error values can be used to identify the best-fitted isotherm. The Langmuir isotherm adopts that a mono-molecular layer will be adsorbed onto surface comprising finite adsorptive site with uniform energies. The Freundlich concept may be used to multilayered adsorption with variable strengths onto heterogeneous surfaces26.
Freundlich isotherm
The Freundlich isotherm predicts multilayer sorption with varying energies and heterogeneous surface adsorption with interactions between adsorbed particles27. This model assumes that the quantity of adsorbate on the adsorbent surface will grow proportionally with the adsorbate concentration. After the sorption centres of the adsorbent are finished, the sorption energy accordingly drops exponentially. Equation No. 3 tracks the Freundlich equation’s linear versions.
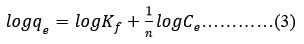
Where qe is the term used to describe the amount of fluoride that may be absorbed by unit mass of an adsorbent (measured in mg/g). After adsorption, Ce is the remaining adsorbate concentration (mg/L) in solution at equilibrium. Freundlich exponent (n) is used to calculate the bonding energy and Freundlich constant, KF ((mg/g) (L/ mg)1/n) is used to calculate the adsorption intensity.
Langmuir isotherm
The essential idea behind the Langmuir isotherm model is that the adsorbent’s surface features an even distribution of active sites. These sites are as well suited for the adsorption of a monomolecular layer in which the adsorbed molecules do not interact with one another28. The adsorptive capacity of various adsorbents can be measured and compared using the Langmuir adsorption model, which was first developed to describe adsorption in the gas-solid phase29.
Equation 4 represents the linear version of the Langmuir isotherm.
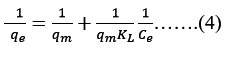
Langmuir constants qm and KL stands for the maximal uptake capability (mg/gm) and interaction ability for sorbent (mg/L) respectively. A linear graph having slope of 1/qmKL with intercept of 1/qm created by plotting 1/Ce against 1/qe.
Using the dimensionless separation factor or equilibrium parameter RL, the characteristics of the Langmuir hypothesis can be described by the following equation no (5)
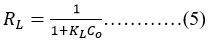
In which Co represents the concentration of fluoride at the outset (in milligrammes per litre) and KL represents the Langmuir standard constant (in units of millilitres per milligramme). Isotherms can be linear (RL=1), favourable (0<RL<1) unfavorable (RL>1), or irreversible (RL=0) depending on their RL value30.
Adsorption kinetics
Multiple kinetic frameworks are utilised to to inspect adsorption’s mass transfer and chemical reaction mechanisms. Adsorption occurs with interaction of adsorbate and active groups on the adsorbent surfaces. The study used pseudo-first order, pseudo-second order, and intra-particle diffusion models. Kinetic studies of adsorption reveal the response mechanism and sorbent uptake rate. To understand fluoride sorption on PCAC experimental results were fitted to lagergren’s pseudo-first and pseudo-second order kinetics.
Pseudo-first order equation can be written as in equation no 6.
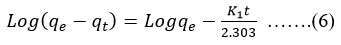
A linear plot was obtained for versus time to calculate K1 and qe by knowing slope and intercept respectively.
The adsorbent surface is chemical, and there is a slower rate of adsorption by chemisorptions, which forms the basis of the pseudo-second-order model. The following equation no 7 may be used to express Pseudo-second-order kinetics
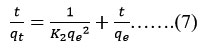
Adsorbed fluoride quantity (mg/gm) is denoted by qt, while the at equilibrium it is denoted by qe. The pseudo-first and pseudo-second order rate constants are denoted as K1 and K2, respectively. The slope of the (t/qt) vs time linear plot represents qe, while the intercept represents K2.
Intra particle diffusion
Adsorption investigations were conducted using the outcomes of batch adsorption trials to determine the rate-limiting phase. The applicability of intra-particle diffusion was investigated using Weber and Morris’ model31, which stipulates that the quantity of fluoride adsorption at any given time may be stated in the form of equation no (8)
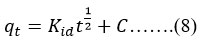
A graph made for quantity bound at time t verses the square root-time was drawn to test whether film or intraparticle diffusion was the rate-limiting phase. In this scenario, kid is the intra-particle diffusion rate constant (mg/(g min1/2)) determined by the slope, and C (mg/g) is a constant relating to the boundary layer thickness determined by the curve’s intercept. The boundary layer effect increases as C value increases.
There are three ways that the intra-particle diffusion model has been used:
The graph between qt and t1/2 yields a straight line that goes through the origin. In other words, the rate is not constrained by mass transmission across the boundary since the interception point C has a value of zero or almost zero. This happens when a system is sufficiently agitated and combined32.
In the qt versus t1/2 plot, multi-linear graphs are produced if the process is followed in two or three steps. In this form, the first step is the instantaneous or external adsorption; the second step is the controlled stepwide adsorption; and in the final equilibrium step, solute slowly diffuses from bigger pores to micropores, slowing the rate. The time needed for the second step is typically influenced by system variability, which is difficult to predict or control (e.g., solute concentration, temperature, and adsorbent particle size)33,34.
When qt is plotted against t1/2, a linear curve is obtained, although does not necessarily go through the origin because of intercept. This suggests that mass transferring over the boundary stratum controls the rate. This happens during a batch adsorption procedure that is slowly stirred35.
Results and discussion:
Characterization of chemically modified adsorbentXRD study
To confirm the crystallographic structure of prepared active carbons XRD results of the sample was shown (Figure 2) for two diffraction patterns with centring at 2ϴ =29.49° and 43.05° exist in the diffractogram represents pattern of amorphous carbonaceous which is similar to other activated carbon36. Table 1 displays XRD patterns results.
 |
Figure 2: XRD Pattern of PSAC |
Table 1: XRD results of PSAC
|
Pos. [°2 Th.] |
Hight [cts] |
FWHM [°2Th.] |
d-spacing [nm] |
Rel. Int. % |
|
29.4935 |
163.87 |
0.3542 |
0.302 |
100.00 |
|
43.0517 |
5537 |
0.7085 |
0.210 |
33.79 |
FTIR analysis
FT-IR spectra of the prepared biochar (Figure 3) for investigating chemical groups present in the PSAC. Maximum transmission measured at wavelength of 3436 cm-1 within in range of 3200-3650 cm-1. This wide transmission band’s existence was explained by the hydrogen-bonded hydroxyl group stretching at the surface region37. A stretching vibration of C-H is represented by the band at 2928 cm-1, while the bending vibration of C-H is represented by another band at around 1384 cm-1. The stretching vibrations of C=C in olefins and aromatic rings38 are represented by the band at 1620 cm-1. Additionally, a modest peak at 872 cm-1 was linked to C-H bond’s bending vibration in highly substituted aromatic ring39. Some other bands also located such as at 1053 cm-1, 1456 cm-1 and were found to attribute for C-O stretching vibrations, C-H deformations respectively. The FT-IR spectra of PSAC indicates that the existence of the aforementioned functional groups is symptomatic of the cellulose and lignocellulosic structure of the peanut shell.
 |
Figure 3: FTIR spectra of PSAC Click here to View figure |
Scanning Electron Microscope study
The SEM micrographs (FE-SEM) of peanut shell powder along with prepared bio char (PSAC) are presented as an irregular and impenetrable surface for with PS powder [ Fig 4 (a)] and for PSAC it is a relatively heterogeneous and highly porous surface [fig 4 (b)]. SEM pictures suggested that the external surface of biochar was uneven and plentiful with porous structure of different sizes and shapes. The micrographs suggesting that during carbonization of KOH impregnated PS at a desired temperature most of the activating agent evaporated and leaving behind residual biomass texture porous. The elemental mapping of the prepared sample is shown in figure 5.
 |
Figure 4: SEM images of PS powder (a): PSAC (b) with surface plot of PS powder (c) and PSAC (d) |
 |
Figure 5: Elemental mapping of PS powder (a,b,c) and PSAC (d, e,f). |
EDX analysis
The table 2 shows EDX (Energy dispersive X ray spectroscopy) analysis of PS powder and PSAC. It was observed that percentage carbon increased during pyrolysis of bio mass.
 |
Figure 6: EDX analysis of PS powder (a) and PSAC |
Table 2: Weight and atomic percentage of elements present in biochar
|
|
PSAC |
Raw PS powder |
||||
|
Elements |
Weight (%) |
Atomic (%) |
Error (%) |
Weight (%) |
Atomic (%) |
Error (%) |
|
C-K |
76.63 |
80.37 |
8.33 |
74.51 |
78.13 |
7.80 |
|
O-K |
12.35 |
9.73 |
1.74 |
9.43 |
7.42 |
3.77 |
|
N-K |
11.02 |
9.90 |
1.85 |
16.06 |
14.44 |
1.19 |
|
Total |
100.00 |
100.00 |
|
100.00 |
100.00 |
|
Point of zero charge (pHpzc)
The pH below which the entire surface area of the adsorbent is positively charged is known as point of zero charge (pHPZC). Due to the net surface charge of the carbon material, anionic fluoride adsorption is encouraged when. pHsolution < pHPZC. pHPZC value of the prepared adsorbent was found to be 3.59 (Figure 7). This means that below a pH of 3.59 the surface of the adsorbent has a positive charge, favoring the adsorption of negatively charged species.
 |
Figure 7: Point of zero charges for PSAC |
Surface area and pore size distribution
Figure 8 depicts the N2 adsorption-desorption curve, while Table 3 displays data on surface area and pore size distribution. The sample’s BET surface area was 479.569 m2/g, which included total pore volume 2.790 × 10⁻¹ and pore volumes of 0.124 cm3/g. The average pore diameter for BJH adsorption was measured to be 1.426 nm. Porous materials are divided into three categories by the International Union of Pure and Applied Chemistry (IUPAC): micropores (2 nm), mesopores (2–50 nm), and macropores (> 50 nm). The biomass charcoal sample was thus found to have a porous structure containing micropores and mesopores. These all textural properties were tabulated in table 3.
Table 3: Textural properties of PSAC
|
SBET (m2/g) |
Vtotal (cm3/g) |
Vmicro (cm3/g) |
Pore diameter (nm) |
|
479.569 |
2.790 × 10⁻¹ |
0.124 |
1.426 |
 |
Figure 8: Nitrogen adsorption-desorption isotherm for PSAC |
Adsorption investigations:
Impact of adsorbent dose
With a starting fluoride concentration of 5 mg/L, the impact of the sorbent dosage was inspected by varying amount of PSAC from 1 to 8 gm/100 ml at the optimal pH of 3. With a dosage of 1 gm of PSAC, over 40% removal was shown in the first 30 minutes, and with 6 gm of PSAC after the first hour, 80% removal was recorded. These results were illustrated in terms of percentage removal and time with varying doses of adsorbent in figure 9. Considerable rise in removal was observed when the dose raised from 1 gm to 2 and so on. This is because a higher dose of adsorbent provides more active sites for adsorption. It was also observed that initially, 1 to 4 gm, percentage removal increases remarkably but beyond 4 gm of dose there was no discernible change in removal percentage which is due to overlapping of the active site hence reducing the net surface area. In fact, with raising dose, more active site on adsorbent remains unsaturated during the process, thus the capacity may decrease at the dose of 8 gm. This is following previous results reported in the literature40.
By inspecting Fig. 9 revels that initial adsorbent doses of 4 and 6 g results to almost same quantity of fluoride elimination through adsorption in 120 min and the same pattern continues for increasing doses from 6 to 8 gm. Thus, with a starting concentration of 5 mg/L, a dose of 4 g/100ml PSAC was shown to be the most effective for fluoride removal.
 |
Figure 9: Effect of adsorbent dose |
Influence of initial fluoride concentration and contact time:
With varied initial fluoride content (50, 100, 150 and 200 mg/L) at room temperature, with 4gm/100 ml of adsorbent material, and pH of 3, the amount of fluoride adsorbed on PSAC was examined as a function of stirring time in 150 minutes adsorption equilibrium has achieved.
It was clear that (Figure 10) adsorption improves with a rise in contact duration for the first one hour due to ample driving force. Then slow up for the next 30 minutes and saturation was obtained after 150 minutes. It was revealed that the original fluoride content affected the elimination procedure. An increase in initial fluoride concentration increases greater adsorption because more sorbate molecules are available to occupy sorption sites20.
 |
Figure 10: Effect of Time and intial F concendration |
Consequence of pH change
Since the surface of activated carbon species may be positively or negatively charged depending on the solution pH, the pH of the solution has vital role. Changes in the pH of the solution have an impact on the net charge on the adsorbent surface, which regulates how adsorbate ions interact with the adsorbent. Figure 11 illustrates how pH changes affect the amount of fluoride removed over time. At pH 3, the most adsorption was seen. This is due to the fact that at low pH, the concentration of H+ ions rises increasing the adsorbent’s positive surface area. The data shown above also support the point of zero charge’s (pHzpc=3.59) validity. Below this pH, the positively charged surface of biochar and the negatively charged fluoride ions form an electrical interaction. High pH diminishes the interaction between sorbate-sorbent surfaces, which lowers adsorption due to the negative charge on the adsorbent surface. For an initial fluoride concentration of 5 mg/L with a 4 g dosage of sorbate, the percentage removal declines from 87.20% to 36.13% when the pH is raised from 2 to 12. Additionally, it was noticed that the solution’s pH had no bearing on how long it took attain adsorption equlibrium19.
 |
Figure 11: Effect of pH |
Adsorption isotherms
A set of constants that reflect the surface characteristics and affinity of adsorbent may be applied evaluate the adsorptive capabilities for the adsorbent aimed at given amount of adsorbate molecules make up an adsorption isotherm. Adsorption isotherm experimental data may be used to explain mathematical approach for Freundlich and Langmuir model.
Freundlich isotherm
Adsorption intensity (n) indicates that the process seems to be either chemical when n <1, linear when n = 1, or physical when n > 1. The value of adsorption intensity (n) indicates that the adsorption procedure is wither chemical n < 1, linear n=1, and physical when n>1. Favourable conditions for physical adsorption is expected when the intensity is found to be greater than 1 (n >1)41. A straight curve obtained for equilibrium isotherm between log qe and log Ce (Figure 12) indicates that adsorption is obeying Freundlich model42. The value of Freundlich factors (Kf and 1/n) are traced out by intercept and slope, respectively and elucidated (Table no 4). The value of n (0.83) suggests that chemisorptions adsorbed fluoride ions onto the PSAC surface.
 |
Figure 12: Freundich Isotherm model for adsorption |
Langmuir isotherm
The Langmuir isotherm is shown by the graph plotted of 1/qe versus unadsorbed fluoride ions 1/Ce (Figure 13). Table 4 presents the Langmuir constants (qm (mg/g) and KL), which were determined from the intercept and slope, respectively.
For both isotherms, linear regression analysis shows a link between the amount of fluoride absorbed and the mass amount of the adsorbent. Table 4 shows all of the mathematical parameters for both models, along with the correlation coefficient (R2) value. Less than 0 value of RL indicates good adsorption.
The results were evaluated for both the isotherms models and treated through linear regression in figure 11 and 12. Table 4 provides an overview of the constants, correlation coefficient (R2), and value errors (SSE and RMSE). Linear plots were sketched for both isotherm and it was found that the degree of linearity for the Freundlich model’s plot is greater (R2= 0.9993)) than for the Langmuir model’s plot (R2 = 0.7560) suggesting more favourable situations for Freundlich hypothesis than to Langmuir. The value of SSE and RMSE for Freundlich were lower than Langmuir model. The applicability of Freundlich model confirms the multilayer and heterogeneous adsorption process.
 |
Figure 13: Langmuir isotherm model for a adsorption |
Table 4: Adsorption equilibrium parameters
|
Isotherm model type |
Parameters |
Data outputs |
|
Langmuir model |
qm ( mg/gm) |
7.75 |
|
KL (L/mg) |
2.68 |
|
|
R2 |
0.7560 |
|
|
RL |
0.158 |
|
|
SSE |
1.36 |
|
|
RMSE |
1.08 |
|
|
Freundlich model |
KF ((mg/g) (L/ mg)1/n) |
31.62 |
|
n |
0.83 |
|
|
R2 |
0.9993 |
|
|
SSE |
0.0633 |
|
|
RMSE |
0.602 |
Adsorption kinetics
Figure 14 (a and b) shows a plot for Lagergren Pseudo first and pseudo second order equation for resulting adsorption of fluoride. The kinetic parameters were shown as in table no 5. By contrasting the experimental value of qe with computed values, the two models’ veracity may be assessed. When compared to the pseudo second order method, the pseudo first order model does not seem to be appropriate for the adsorption process because of its weaker linear regression and larger discrepancy between qe (exp) and qe (calculated).
Table 5: kinematic of Pseudo-first and Pseudo-second order studies
|
Ci mg/L |
Qe (exp.) (mg/gm) |
Pseudo first order kinetics |
Pseudo second order kinetics
|
||||
|
Qe (cal.) |
K1 |
R2 |
Qe(cal.) |
K2 |
R2 |
||
|
2 |
31.25 |
2.05 |
0.0191 |
0.9949 |
33.33 |
0.0008 |
0.9975 |
|
4 |
45.7 |
4.20 |
0.0170 |
0.9886 |
46.51 |
0.0005 |
0.9846 |
|
6 |
60.89 |
5.30 |
0.0107 |
0.9416 |
62.5 |
0.0004 |
0.9785 |
|
8 |
80.1 |
6.56 |
0.0045 |
0.5747 |
83.33 |
0.0002 |
0.9796 |
|
10 |
97.3 |
8.03 |
0.0036 |
0.9051 |
102 |
0.0002 |
0.9110 |
 |
Figure 14: Adsorption kinetic (a) Pseudo first order nd (b) Pseudo second order study |
Intra particle diffusion
A linear plot between qt and t1/2 shown in figure 15 is obtained as straight line originating from origin and the parameters are listed in table no 6 which shows that the intercept C value is equal to 0.006 ± 0.001, indicating that rate is limited by intra particle diffusion.
 |
Figure 15: Intraparticle diffusion model adsorption on to PSAC |
Table 6: Parameters for Intraparticle diffusion for adsorption on PSAC
|
Co |
Kid (gm/mg min.5 ) |
R2 |
C |
|
2 |
0.003 |
0.9465 |
0.0047 |
|
4 |
0.006 |
0.999 |
0.0074 |
|
6 |
0.007 |
0.9972 |
0.0094 |
|
8 |
0.007 |
0.9958 |
0.0067 |
|
10 |
0.009 |
0.9859 |
0.014 |
Application of prepared sorbent on actual groundwater samples
Groundwater samples were collected from thirty different sites from Shekhawati Block and all the samples were analyzed for fluoride concentration using above mentioned method in the laboratory. The major sources of ground water are tube wells or the local name ‘Beri’. Samples were collected from these tube-wells of average depth of 800 ± 200 feet. Nearly all of the samples had fluoride amounts that are greater than the legal threshold. Prepared sorbents were subjected to fluoride removal efficiency for collected samples under specified optimized conditions. These results are shown in table 7.
Table 7: Sample collection sites and fluoride content
Block: Fatehpur, Rajasthan, India Type of source: Deep tube well
|
S no |
Sample No |
Village name |
Habitat |
Fluoride content (mg/L) |
Residual Fluoride after removal (mg/L) |
|
1. |
S-1 |
ATTHWAS |
MEENO KI DHANI |
1.800 |
0.90 |
|
2. |
S-2 |
ROOPNAGAR |
ROOPNAGAR |
1.680 |
1.00 |
|
3. |
S-3 |
BALOD BARI |
BALA JI DHANI |
1.900 |
0.95 |
|
4. |
S-4 |
BALOD BARI |
JYANI KI DHANI |
2.380 |
1.3 |
|
5. |
S-5 |
BALOD BARI |
KHAKHALO KI DHANI |
6.800 |
3.1 |
|
6. |
S-6 |
BATHOD |
BATHOD |
1.790 |
0.82 |
|
7. |
S-7 |
CHUWAS |
BARHMANO KI DHANI |
4.800 |
2.3 |
|
8. |
S-8 |
BESWA |
KAJIYO KI DHANI |
2.560 |
1.6 |
|
9. |
S-9 |
BIBIPUR BARA |
BIBIOUR BARA |
4.760 |
2.8 |
|
10. |
S-10 |
KARANGA BARA |
BARJI KI DHANI |
2.100 |
0.63 |
|
11. |
S-11 |
MARDATOO CHHOTI |
JATON KI DHANI |
1.660 |
0.80 |
|
12. |
S-12 |
MARDATOO CHHOTI |
MARDTOO CHHOTI |
1.840 |
0.59 |
|
13. |
S-13 |
KISHANPURA |
DHANI KISHANPURA |
2.880 |
1.2 |
|
14. |
S-14 |
CHACHEEWAD BARA |
CHACHEEWAD BARA |
6.770 |
3.0 |
|
15. |
S-15 |
CHACHEEWAD CHHOTA |
CHACHEEWAD CHHOTA |
7.880 |
3.9 |
|
16. |
S-16 |
DHANI RIDMAL |
DHANI RIDMAL |
2.530 |
1.80 |
|
17. |
S-17 |
FADANPURA |
FADANOURA |
4.680 |
2.10 |
|
18. |
S-18 |
FADANPURA |
JYANIO KI DHANI |
2.680 |
2.10 |
|
19. |
S-19 |
GORAS |
LALU KI DHANI |
11.800 |
4.9 |
|
20. |
S-20 |
UDANSAR |
MEENA KI DHANI |
2.200 |
1.0 |
|
21. |
S-21 |
UDANSAR |
PURANMAL KI DHANI |
5.820 |
2.95 |
|
22. |
S-22 |
UDANSAR |
HUKMA RAM KI DHANI |
1.940 |
1.1 |
|
23. |
S-23 |
BEER FATEHPUR |
BEER FATEHPUR |
2.250 |
1.0 |
|
24. |
S-24 |
GODIYA BARA |
GORIYA BARA |
1.920 |
0.99 |
|
25. |
S-25 |
GODIYA BARA |
GUJRO KI DHANI |
3.040 |
1.01 |
|
26. |
S-26 |
KOLAYAT |
KOLAYAT |
5.120 |
2.5 |
|
27. |
S-27 |
SAHBSAR |
SAHBSAR |
6.150 |
2.89 |
|
28. |
S-28 |
DEENARPURA |
DEENARPURA |
1.900 |
0.88 |
|
29. |
S-29 |
KARANGA CHOTA |
KARANGA CHOTA |
1.700 |
0.87 |
|
30. |
S-30 |
HIRNA |
MILON KI DHANI |
3.500 |
1.2 |
Conclusion
In the undergoing study, the porous and oxygen containing functional group biomass charcoal material was prepared by waste peanut shell by chemical activation and under N2 protection through simple and low-cost methods. The obtained material has excellent adsorptive properties towards fluoride adsorption under optimized conditions. A systematic study on the adsorption performance was done to obtain maximum adsorption capacity at 7.75 mg/gm and other affecting factors. Among the two most studied adsorption isotherms, Freundlich isotherm was best fitted model for this study with a more linear regression coefficient (R2= 0.9993). In kinetic analysis, the pseudo second order model was more relevant due to its linearity and comparable experimental data. These finding suggest that prepared bio adsorbent can easily be used to remove toxicants removal gears from the drinking water.
Acknowledgment
Anurag Kadawasara is grateful for the research grant (JRF) that the UGC New Delhi provided to him as well as the laboratory and equipment facilities provided by the Department of Chemistry at JNV University. Special thanks to Dr V K Janu, DRDO Jodhpur for giving his contributions.
Conflict of interest
There is no conflict of interest.
References
- Sreekanth B., Yashoda, R. and. Manjunath P. Puranik. International Journal of Applied Dental Sciences, 2018, 4(3), 167-171.
- Cheng, K.K., Chalmers, I, Sheldon, T.A. BMJ. 2007, 335 (7622): 699–702.
- Marshall, E. Science, 1990, 247(4940), pp 276–277.
- World Health Organisation expert committee on Oral Health Status and Fluoride use. (1994). Fluoride on oral health. WHO Technical report series No 846. World Health organization, Geneva.
- BIS, IS:10500, Drinking Water Specification, First revision, 1991. Bureau of India Standards.
- WHO publication, (2019). INADEQUATE OR EXCESS FLUORIDE: A MAJOR PUBLIC HEALTH CONCERN.
- Lou, D. B. Feature, 2020, Vol 4 (3), 94-95.
- Times of India (July 28, 2019). Rajasthan risks running out of water: Study, water resources, government of Rajasthan.
- Isikgora, F.H. and Becer, C. R. Polym. Chem., 2015, 6: 4497–4559.
- Srinivasan, M. P., Jain, A. and Balasubramanian, R., Chemical engineering Journal, 2016, 283:789-805.
- Qiang, A., Jiang, Y. Q., Nan, H. Y., Yu, Y. and Jiang, J. N. , Chemosphere. 2019, 214: 846–854.
- Kumar, P., kadawasara, A, Sharma, P.K., choudhary, A. Poll Res. 2021, 40 (4) : 1424-1432.
- Zheng, Li, Wang, Z., Zhang, M., Chang, Yu, Wang, G. Dong, Y., Liu, S., Wang, Y., Qiu, J. Adv. Funct. Mater. 2016, 26: 111–119.
- , Li, N., Gao, B., Xing, Xu, Ruidian, Su , Bingjie, yu. J. Cleaner. Prod. 2019, 207, 764–771.
- Zhang, Xi., Guiyin, Xu, Jinpeng, H., Ding, B., Nie, P., Pan, J., Dou, H. and Li, H. Green Chem. 2015, 17: 1668–1674.
- Singh, A.L. (2011). Physiological basis for realizing yield potentials in Groundnut. In: advances in plant physiology. A. A. Hemantranjan (ed.), Scientintific publisher Jodhpur, India. (12):131-242p.
- Groundnut outlook report February 2022, Department of agriculture and farmer welfare, Govt of India.
- Tang, W.,Cai, N., Hongxia, Xi, Liu, Ya., Wang, Zhi., Liao, Y., Wei, T., Zhang, C., Fu, Z. and Yin, D.IOP Conf. Ser.: Mater. Sci. Eng. 2020, 729.
- Garg, D., Kumar, S., Sharma, K. and Majumde,r C.B., Groundwater for Sustainable Development 2019, 8: 512–519,
- Georgin, J., Dotto, G L., Mazutti, M. A. and Foletto, E.L., Journal of Environmental Chemical Engineering, 2016. 4 (1): 266-275.
- Wang, S., Nam, Ho. and Nam, Hy.Journal of Environmental Chemical Engineering, 2020. 8 (2):103683.
- Deng, S., Hu, B., Chen, T., Wang, B., Huang, J., Wang, Y. and Gang, Yu., Adsorption, 2015, 21:125–133.
- Liu, J., Yan, Li., Jianbo, Peng J., Liu, Z., Jiang, Y.,Meng, M., Zhang, W. and Liang, Ni. , Water, Air, & Soil Pollution 2018, volume 229: 391.
- Sathe, P.S., Adivarekar, R.V. and Pandit, A. B. , Journal of plant nutrition, 2022, 45 (4):503-521.
- Liu, A., Yang, Y., Ren, X., Gao, M, Xing, Li. and Tingli, M., Catal. Sci. Technol. 2021, Vol 11 (4): 1526- 1536.
- Ahmed, S and Ikram, S., International Journal of Pharmaceutical Research, 2015, 6(1):14-30.
- Ahmet, S., Caner, N. and Mustafa, T. , Ind. Eng. Chem. Res., 2015, 54( 30), 7524–7533.
- Langmuir, I. , J. Am. Chem. Soc. 1918, 40:1361.
- . , Journal of Environmental Protection, 2011, 2(6): 817–827.
- Acrivos, A., Eagleton, L.C., Hall, K.R. and Vermeulen, T. Ind. Eng. Chem. Fundamen. 1966, 5(2): 212-223.
- Weber, W.J. and Morris, J.C. Journal of the Sanitary Engineering Division, 1963, 89:31-39.
- Wu, F., Tseng, R., and Juang, R. , Chem. Eng. J. 2009, 153: 1-8.
- G. McKay, H.S. Blair, J. Gardner, J. Appl. Polym. Sci .1983. 28, 1767–1778
- , N., Sirisha, D. and Chandrasekhar, K.B., International Journal of Environmental Bioremediation & Biodegradation, 2016, 4(2): 55-67.
- Yu-zhu Ma, Bao-jun Yu, Yan Guo Cheng-yang Wang, Journal of Solid State Electrochemistry, 2016, 20: 2231–2240.
- X. Qiu, L.X. Wang, H.L. Zhu, Y.K. Guan, Q.T. Zhang. Nanoscale , 2017, 9: 7408–7418.
- Wu, M., Guo, Q., and Fu, G. Powder Technol. 2013, 247:188–196.
- Rodríguez, A., García, J., Ovejero, G., Mestanza, M. . J. Hazard Mater. 2009, 172:1311–1320.
- Deng, Z.H., Y. Q. Lu (1989), Practical infrared spectroscopy, Science Press, Beijing, p. 30.
- Najafpoura, G.D. Ghoreyshi, A.A., Radnia, H. and Younesi, H. Desalination and water treatment. 2012, 50:348-359.
- Bhanger, M.I., Shahabuddin, M.and Solangi, I.B. (2009). Removal of fluoride from aqueous environment by modified Amberlite resin. J. Hazard Mater. 171(1–3): 815–819.
- Freundlich, H. (1928). Colliodal and Capillary Chemistry. Journal of the society of chemical industry, 45(44): 797-798.

This work is licensed under a Creative Commons Attribution 4.0 International License.
About The Author
![]()
A New Edition of Web of Science
Journal Impact Factor
2022: 0.5
Five Year: 0.8
Journal is Indexed in

Cabells Whitelist
![]()


